Hello GIS enthusiasts, IGISMAP has now published the latest GIS vector data of Mexico administrative levels. Links for downloading the shapefiles of the important administrative divisions of Mexico are provided in the following. You can also download these data in KML, GeoJSON or CSV formats.
Note:
All data available are in GCS datum EPSG:4326 WGS84 CRS (Coordinate Reference System).
You need to login for downloading the shapefile.
Download Free Shapefile Data of Mexico
Mexico, officially the United Mexican States, is a country in the southern portion of North America. It is bordered to the north by the United States; to the south and west by the Pacific Ocean; to the southeast by Guatemala, Belize, and the Caribbean Sea; and to the east by the Gulf of Mexico. Mexico covers 1,972,550 square kilometers (761,610 sq mi), making it the world’s 13th-largest country by area; with approximately 126,014,024 inhabitants, it is the 10th-most-populous country and has the most Spanish-speakers. Mexico is organized as a federal republic comprising 31 states and Mexico City, its capital. Other major urban areas include Monterrey, Guadalajara, Puebla, Toluca, Tijuana, Ciudad Juárez, and León.
Disclaimer : If you find any shapefile data of country provided is in correct do contact us or comment below, so that we will correct the same in our system.
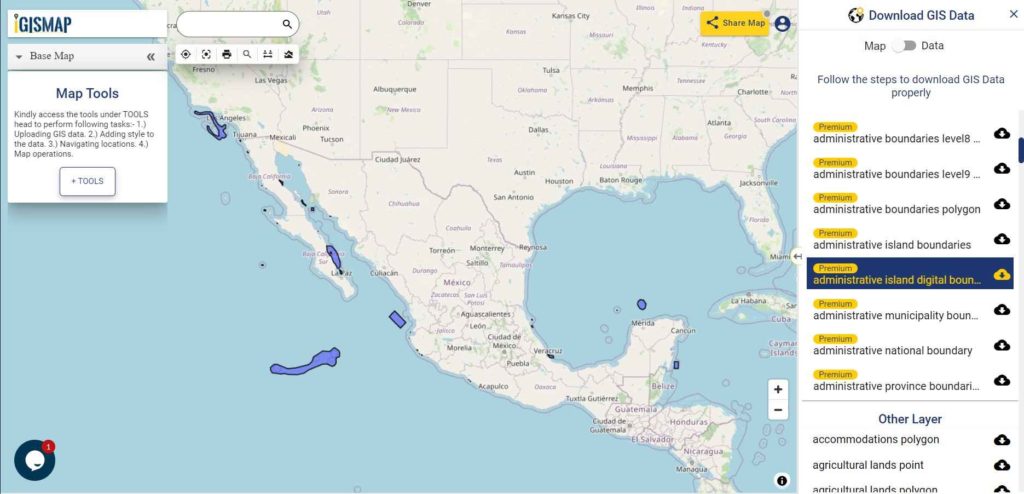
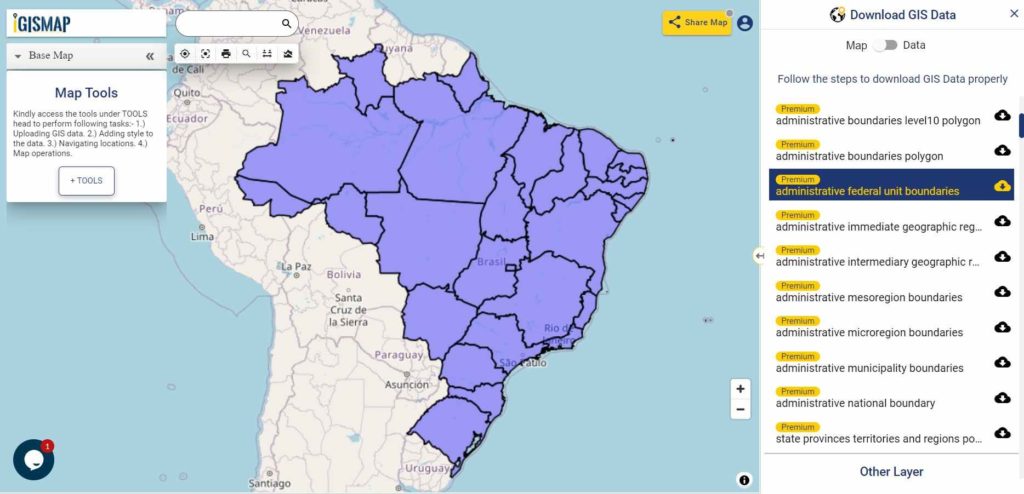
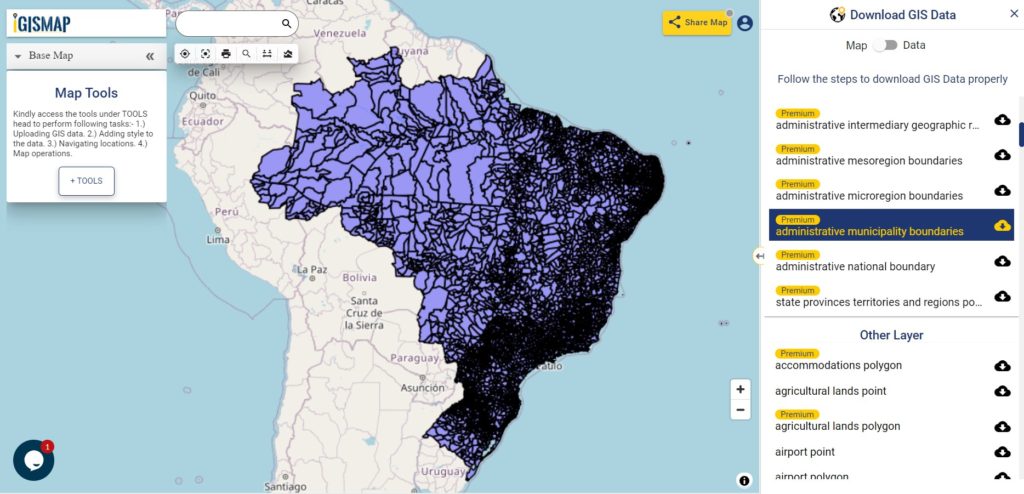
Hello GIS enthusiasts, IGISMAP has now published the latest GIS vector data of Brazil administrative levels. Links for downloading the shapefiles of the important administrative divisions of Brazil are provided in the following. You can also download these data in KML, GeoJSON or CSV formats.
Note:
All data available are in GCS datum EPSG:4326 WGS84 CRS (Coordinate Reference System).
You need to login for downloading the shapefile.
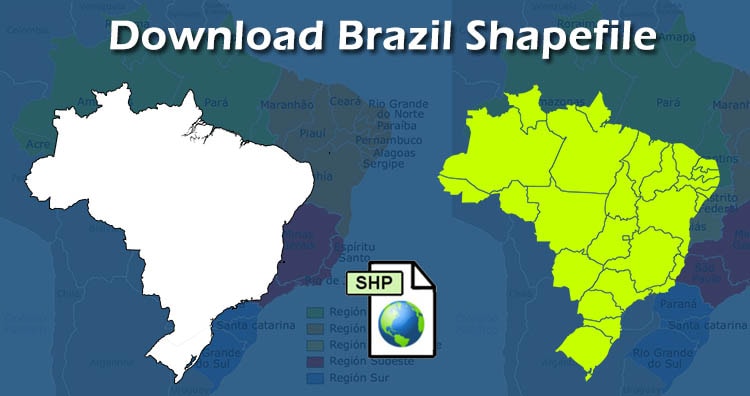
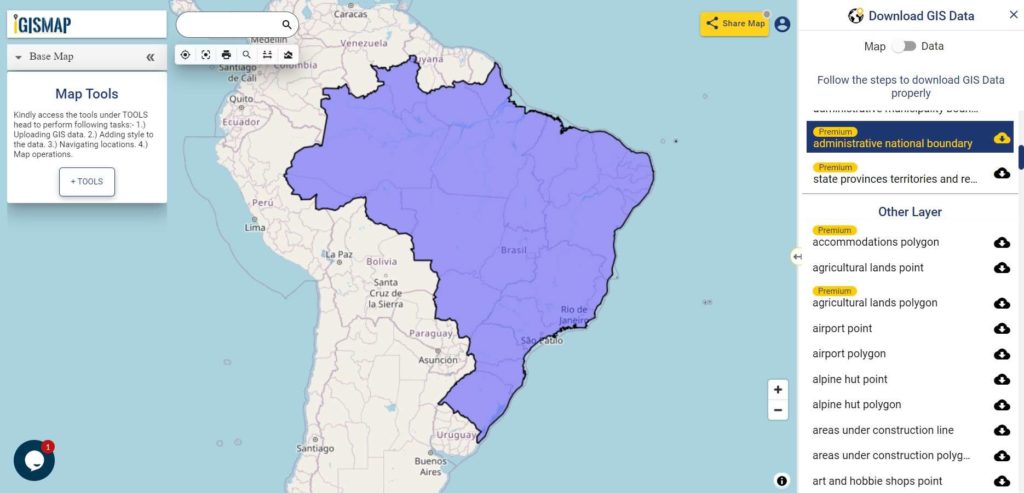
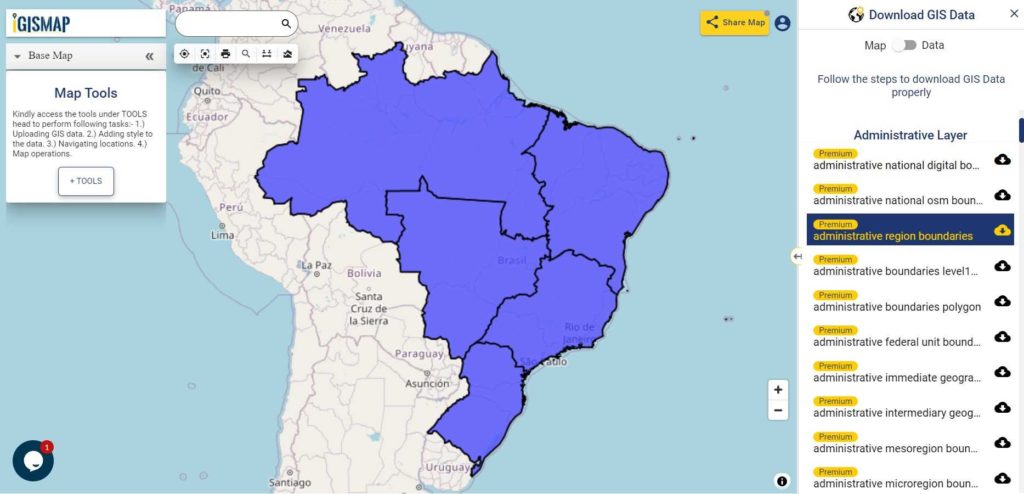
Download Free Shapefile Data of Brazil
Brazil officially the Federative Republic of Brazil (Portuguese: República Federativa do Brasil), is the largest country in both South America and Latin America. At 8.5 million square kilometers (3,300,000 sq mi) and with over 214 million people, Brazil is the world’s fifth-largest country by area and the sixth most populous. Its capital is Brasília, and its most populous city is São Paulo.
Disclaimer : If you find any shapefile data of country provided is in correct do contact us or comment below, so that we will correct the same in our system.
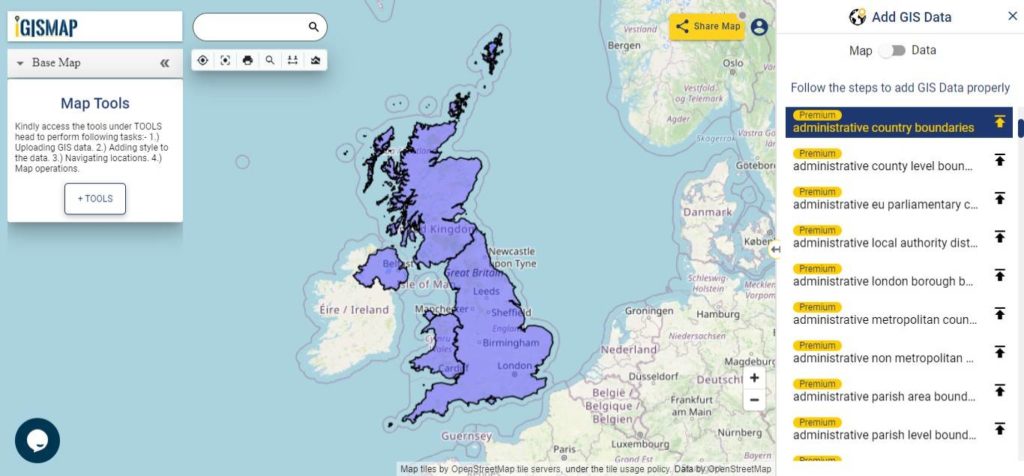
Hello GIS enthusiasts, IGISMAP has now published the latest GIS vector data of United Kingdom administrative levels. Links for downloading the shapefiles of the important administrative divisions of United Kingdom are provided in the following. You can also download these data in KML, GeoJSON or CSV formats.
Note:
All data available are in GCS datum EPSG:4326 WGS84 CRS (Coordinate Reference System).
You need to login for downloading the shapefile.
Download Free Shapefile Data of United Kingdom
The United Kingdom of Great Britain and Northern Ireland, commonly known as the United Kingdom (UK) or Britain is a sovereign state to the northwest of continental Europe, consists of:
England
Scotland
Wales
Northern Ireland
The United Kingdom includes the island of Great Britain, the north-eastern part of the island of Ireland, and many smaller islands within the British Isles. Northern Ireland shares a land border with the Republic of Ireland. Otherwise, the United Kingdom is surrounded by the Atlantic Ocean, with the North Sea to the east, the English Channel to the south and the Celtic Sea to the south-west, giving it the 12th-longest coastline in the world. The Irish Sea separates Great Britain and Ireland. The total area of the United Kingdom is 93,628 square miles (242,500 km2), with an estimated population in 2020 of 68 million.
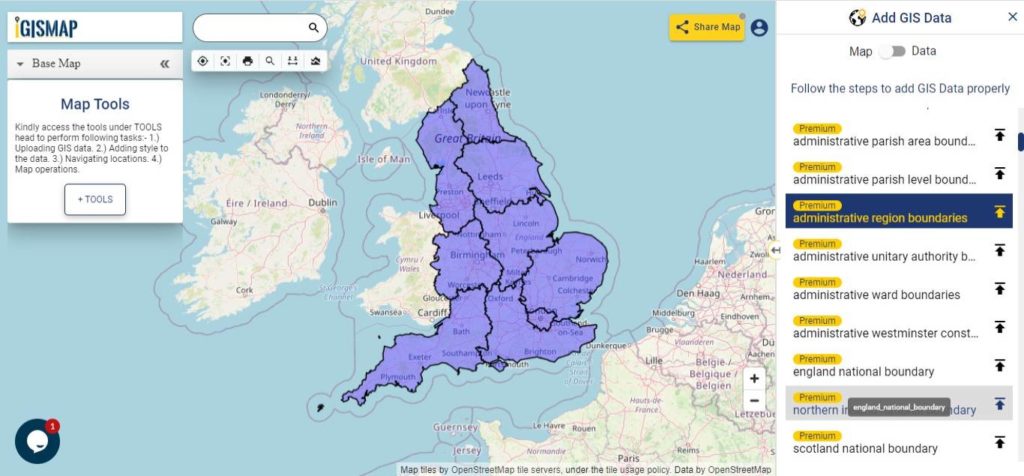
Download United Kingdom Regions And Counties Shapefile Data
The regions, formerly known as the government office regions, are the highest tier of sub-national division in England, established in 1994 which is divided into 9 regions.
County level division of pan UK includes Metropolitan counties, Non metropolitan counties, Unitary authorities and London Boroughs. Following data available in IGISMAP consist of 202 polygon features of county level boundaries.
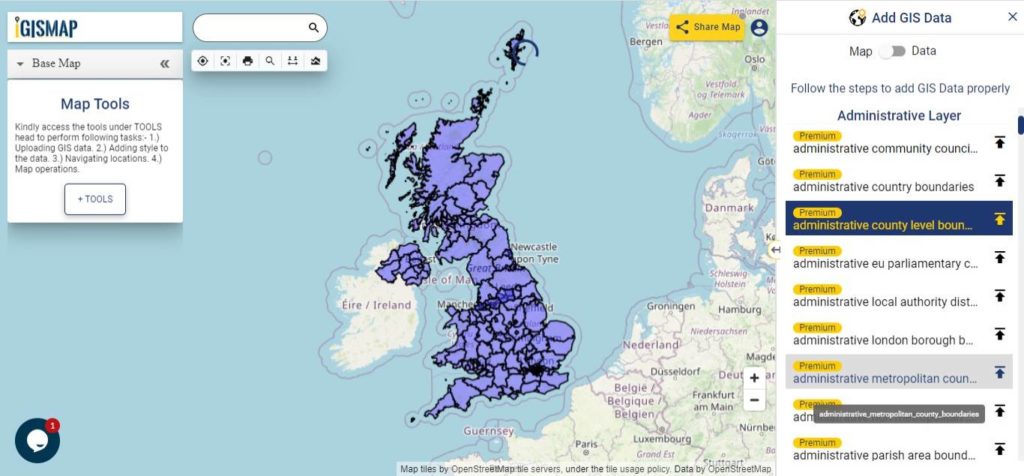
Download United Kingdom Unitary Authorities Shapefile Data
Unitary Authority divisions are associated with England, thus commonly known as Unitary authorities of England. The unitary authorities of England are those local authorities which are responsible for the provision of all local government services within a district. Following data of Unitary Authority boundaries is a combined data of Local Authority District polygons of Scotland, Wales and Northern Ireland with the Unitary Authority polygons which is a sum of 138 polygon features.
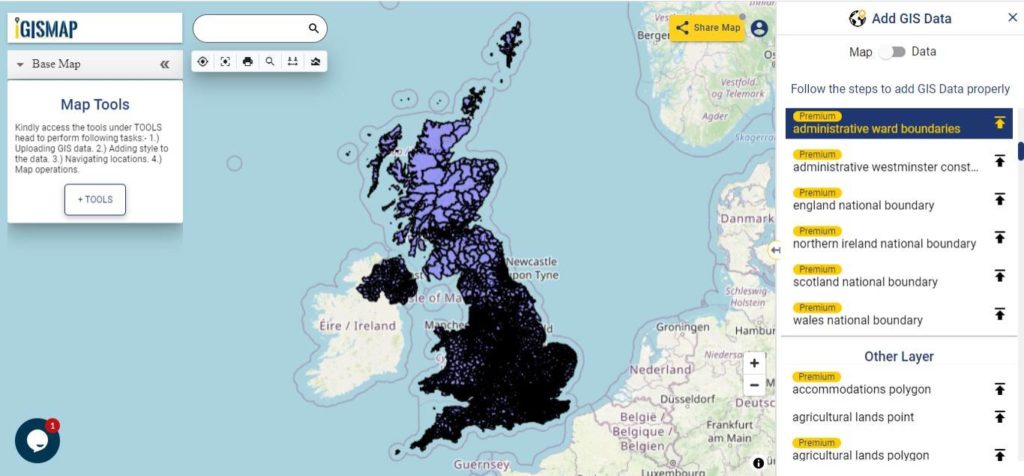
The wards and electoral divisions in the United Kingdom are electoral districts at sub-national level represented by one or more councillors. The ward is the primary unit of English electoral geography for civil parishes and borough and district councils, electoral ward is the unit used by Welsh principal councils, while the electoral division is the unit used by English county councils and some unitary authorities. Each ward/division has an average electorate of about 5,500 people, but ward-population counts can vary substantially. As at the end of 2014 there were 9,456 electoral wards/divisions in the UK.
Disclaimer : If you find any shapefile data of country provided is in correct do contact us or comment below, so that we will correct the same in our system as well we will try to correct the same in OSM.
Landsat 8 provide satellite images for remote sensing. For extracting information from satellite images land cover classification plays a important role. In this post you get pictorial tutorial for how to download Landsat 8 images in QGIS 3.4.4 for research and processing. Newbees also can check QGIS 3.4.4 for beginners.
Install Semi- Automatic Classification Plugin in QGIS 3.4.4
For landsat 8 images in QGIS 3.2.1 you need to download plugin. Go to plugin >> search for Semi- Automatic Classification Plugin and install it.
Once the Semi-Automatic Classification plugin installed then SCP input and Dock appeared on the screen.
Download Landsat Images
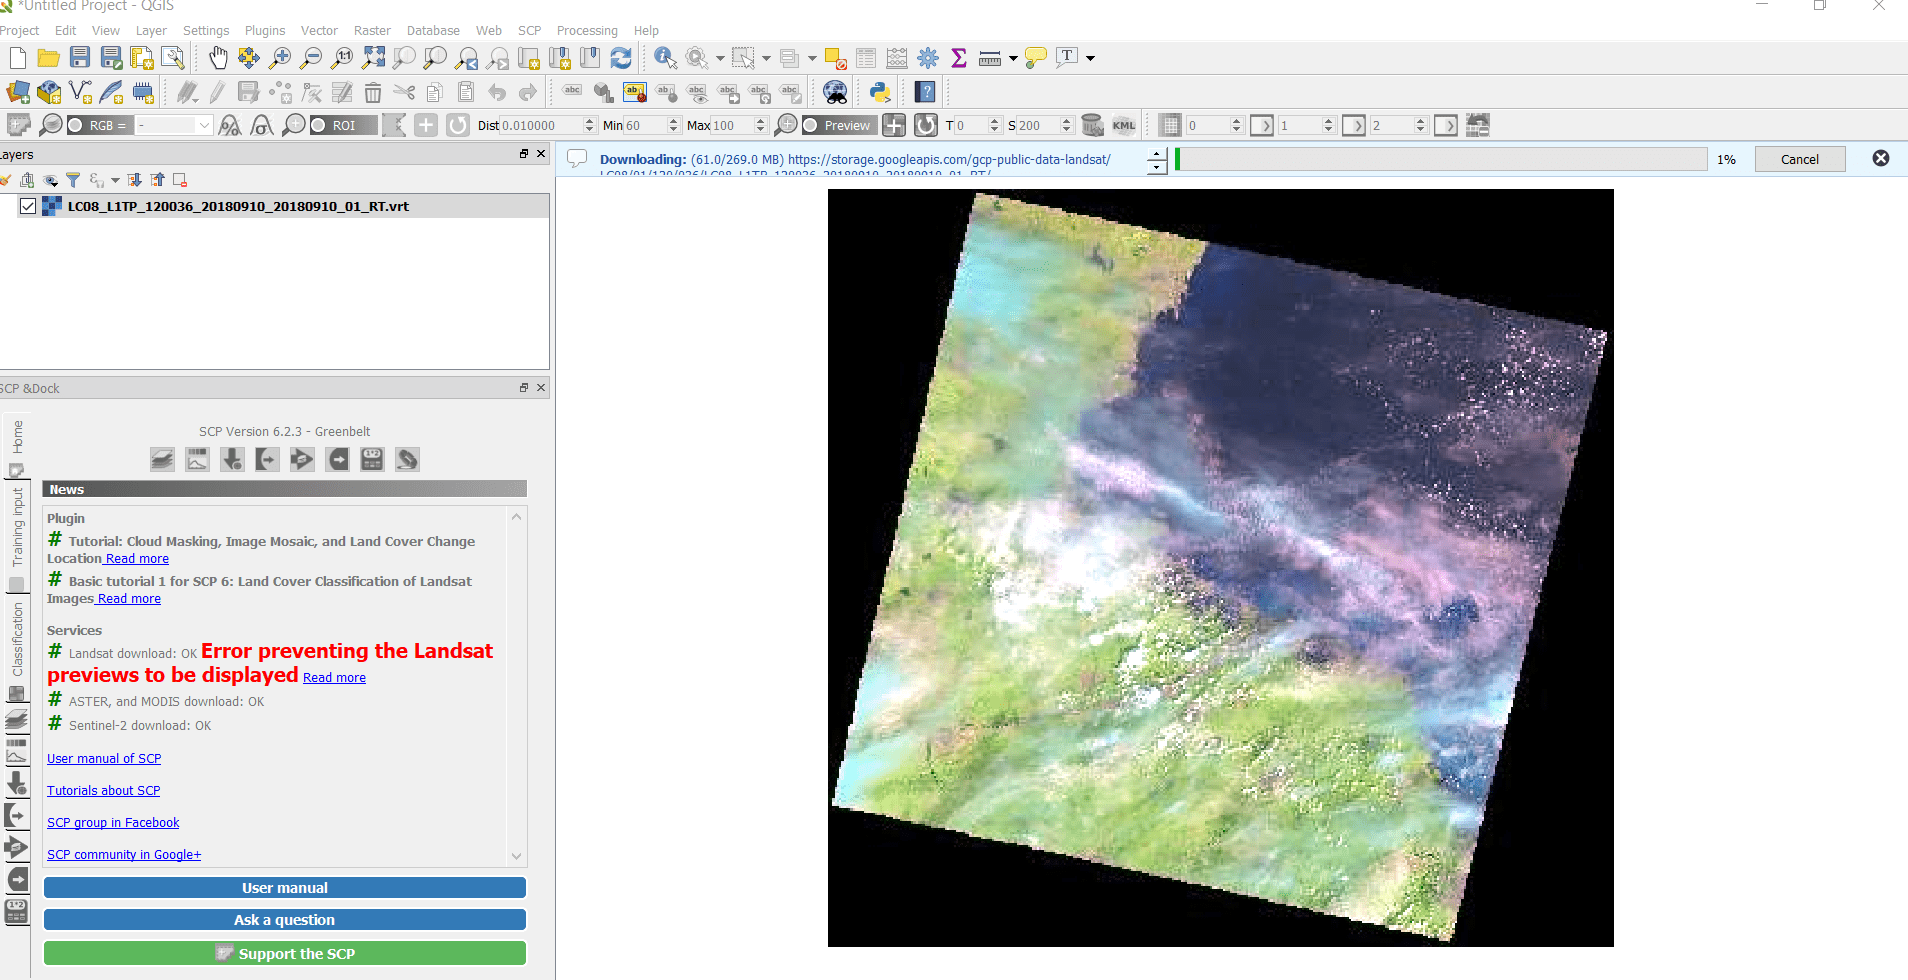
Go to SCP & Dock, tap on download product. Symbol of download shown below.
After clicking Semi-automatic classification plugin window will appear. Search for parameter by writing the coordinates of the area (longitude and latitude)
You can download images from Sentinel – 2 , Sentinel -3 , L 4-5, L7 or L8. Here we download image from L8 OLI/TIRS. So select L8 OLI/TIRS from download product. Select date and click on find.
Few seconds later a list of images appeared in the product list. Check the products in the preview for the appropriate image.
Click the load buttonfor preview map provided in the right side of the window.
We can also set the bands according to our purpose by selecting download images tab.
Now, tap on Run button for downloading the image. Select the folder where you want to save file. Downloading process take lots of time be patient.
You can see the map shown below.
This all about downloading images from Landsat 8 for research and processing.
Looking for Shapefile data of globally distributed features and boundaries for research or project, then you are at the right place. Here you can download global Country Level Boundaries shapefile and features for free.
Note:
All data available are in GCS datum EPSG:4326 WGS84 CRS (Coordinate Reference System).
You need to login for downloading the shapefile.
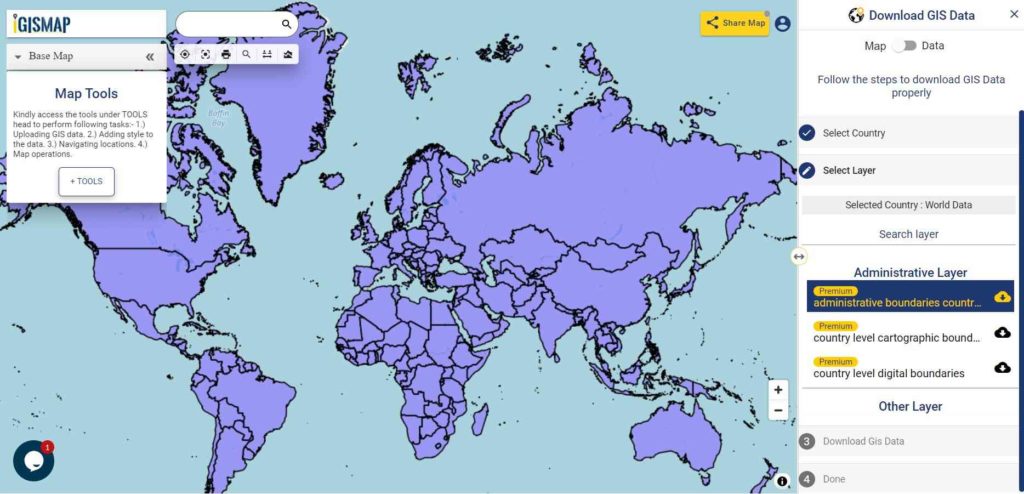
Download World Countries Boundaries Shapefile Data
You can extract the countries or features of other data using Crop Layer tool available in the map canvas itself or you extract the feature in your desktop QGIS software. Follow this link to learn how to extract features in QGIS.
All data are updated periodically once in a quarter year. Similarly you may ask or hire us to download a map of water, roads, polygon, buildings, parks of a specific Area from open street map.
Disclaimer : If you find any shapefile data of country provided is in correct do contact us or comment below, so that we will correct the same in our system.
Hello GIS enthusiasts, IGISMAP has now published the latest GIS vector data of Mexico administrative levels. Links for downloading the shapefiles of the important administrative divisions of Mexico are provided in the following. You can also download these data in KML, GeoJSON or CSV formats.
Note:
All data available are in GCS datum EPSG:4326 WGS84 CRS (Coordinate Reference System).
You need to login for downloading the shapefile.
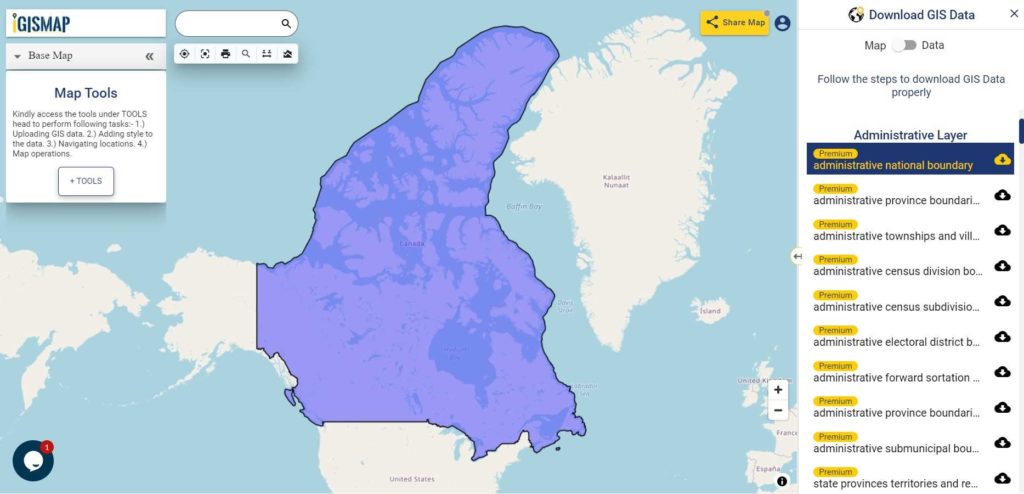
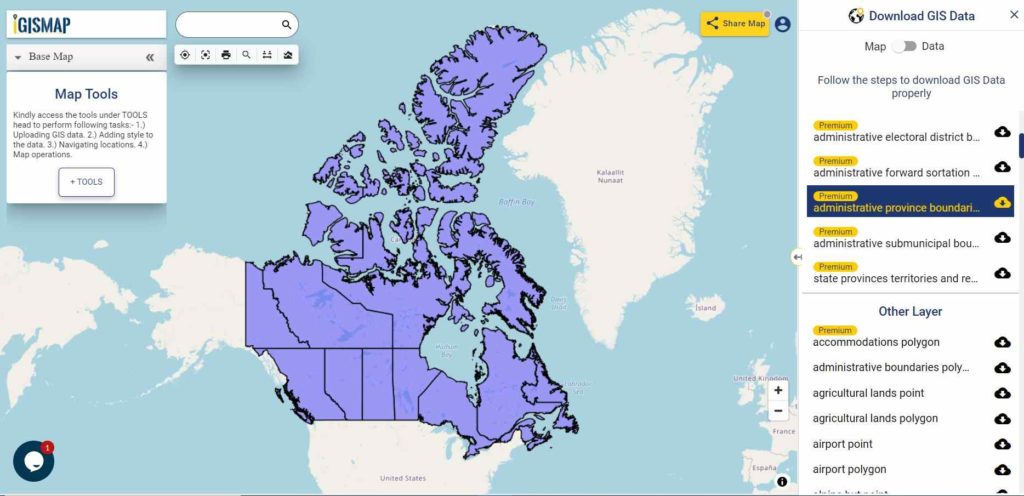
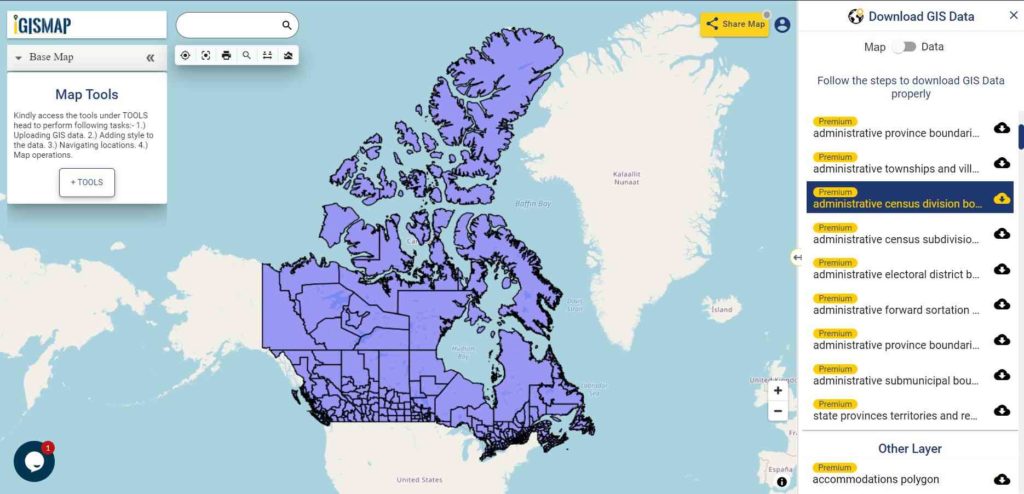
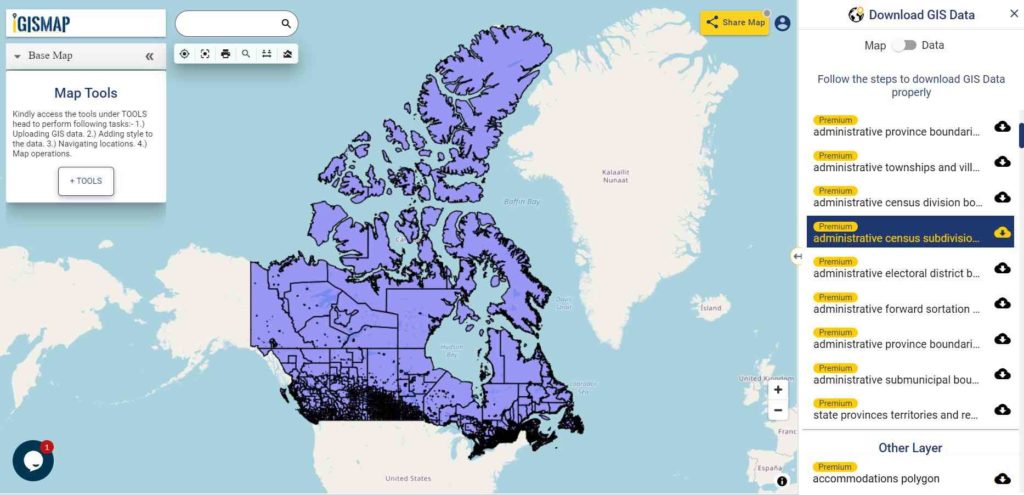
Download Free Shapefile Data of Canada
Canada is a country in North America. Its ten provinces and three territories extend from the Atlantic Ocean to the Pacific Ocean and northward into the Arctic Ocean, covering over 9.98 million square kilometers (3.85 million square miles), making it the world’s second-largest country by total area. Its southern and western border with the United States, stretching 8,891 kilometers (5,525 mi), is the world’s longest binational land border. Canada’s capital is Ottawa, and its three largest metropolitan areas are Toronto, Montreal, and Vancouver.
Disclaimer : If you find any shapefile data of country provided is in correct do contact us or comment below, so that we will correct the same in our system.
In this post we are going to discuss that how can we convert GeoTIFF to AAIGrid data format.
GeoTIFF is a public domain standard which allows georeferencing information to be embedded within a TIFF file. GeoTIFF files also includes map projection, coordinate systems and datums data to establish the exact spatial reference for the file.
AAIGrid or Arc/Info ASCII Grid is supported for read and write access, including reading of georeferencing transform and some projections. The projections support is quite limited. It is normally produced with the Arc/Info ASCIIGRID command.
For GeoTIFF to AAIGrid conversion, go to Converter tool, after logging in with your registered email and password from MAPOG. If you are a new user, click the Sign Up button in the Login popup and register to IGISMAP by filling the details.
There are three main steps for using GIS Converter:
Upload the data
Choose the format to which it should be converted
Download the converted file
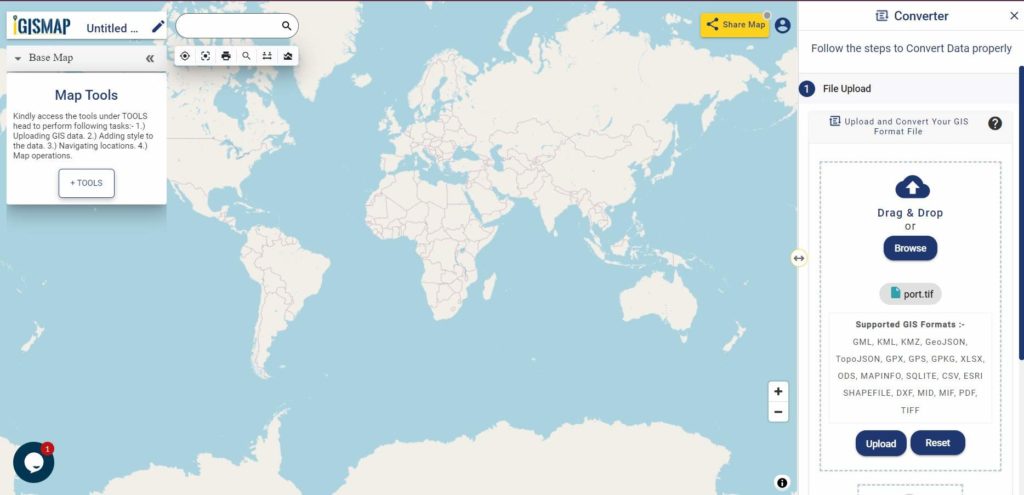
Step one is to upload the GeoTIFF file which you want to convert. You can upload your file from system or select from the Recent Files.
Upload GeoTIFF
Here we have uploaded the Satellite image of the Mumbai port in GeoTIFF format collected from Google Earth Engine.
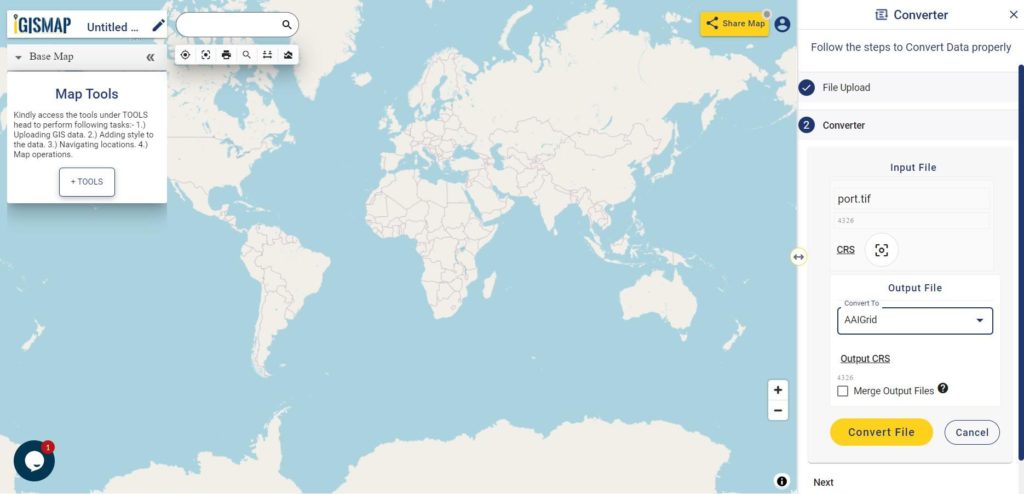
Step two is to select the output format from the dropdown for the converted file, in this case its AAIGrid. You can also set the Coordinate Reference System of your preference. As a default CRS will set to WGS 84 (World) [EPSG:4326]. Now Now Click on the Convert File.
Select AAIGrid as Output Format
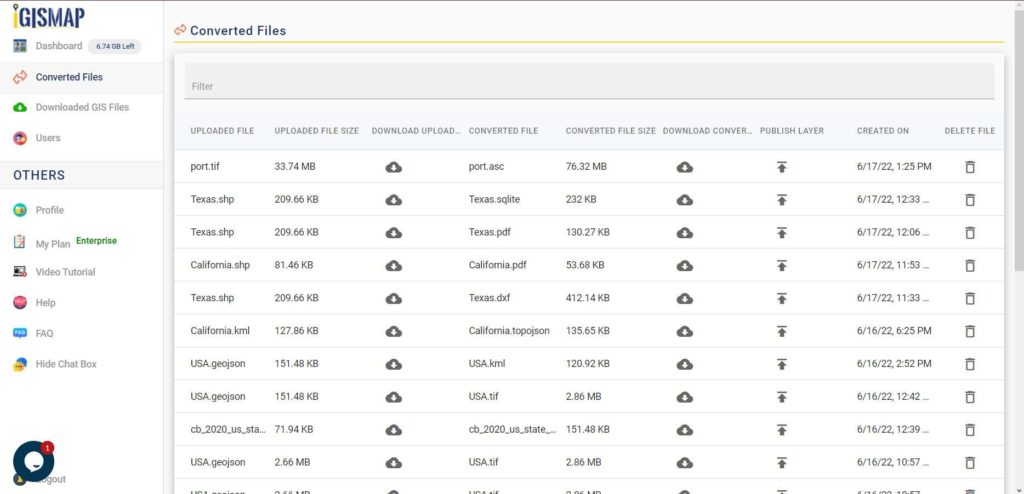
After clicking the Convert File button, your GeoTIFF file will be converted to AAIGrid file after a few seconds and will be available for downloading in the Converted Files section of the dashboard.
Download AAIGrid File
Raster files are currently not available for processing in IGISMAP, thus the output AAIGrid file cannot be visualized in the map canvas. Instead it will be available for download in the Converted Files section.
Converted Files section from the dashboard contains the list of the details of all the conversion done in your account, providing both input and output data available for download their corresponding formats
If you face any problem during implementing this tutorial, please let us know. Feel free to comment in given comment box.
The use of Telecommunication is a necessity for everyone these days. As a result telecommunication has so much to do with different sectors of technologies. One of those technologies is GIS, GIS plays a major role for telecom industry. Telecom GIS System is an initiative by IGIS Map to provide help for research and analytics of existing socio-economic factors, business processes and operational complexities in Telecommunication industry. It is created to solve the vast area of issues related to GIS for Telecommunication industry.
It is powerful tool to create maps, integrate information, visualize scenarios, solve complicated problems, present powerful ideas & develop effective solutions. It helps telecom industry personnel recognizes the opportunities, market trends, threats and patterns.
Visualize with Us – Users can locate areas of market trends and growth as they appear. Which can help them in providing time to respond to the situations.
Analyze with Us – Users can analyze the test scenarios with GIS tool. They can select and analyze the network performance and fix the issues before they affect services.
Telecom GIS System is offering these 3 modules in its package for the Telecom industry’s benefit.
Mobile Application (For Field Data collection Updating and Maintenance)
The Telecom GIS system have the feature to attach documents, spreadsheets, or images to provide users with additional information or required documentation with these modules. The GIS system uses the information technology and GIS for software and data so that it can provide these excellent services to the industry professionals which otherwise may not be possible with tabular format data.
Telecom GIS System – Issues
Telecommunication industries are striving to add innovations to various aspects such as Plan, Build and Operate because of the growth prospects of the industry. Here are some major problems faced by Telecommunication sector:
Capacity Planning
Demand Forecasting
Personnel Management
Market Segmentation
Real-time Knowledge Of Network Structure
As we have already discussed these issues in our previous blog, here is the link for more details on Problems Faced by Telecom Industry and the ways in which GIS helps in solving these problems.
Telecom GIS System – Features
This GIS system can help telecommunication industries in various ways. It will enhance the ability of stakeholders to build resilient infrastructure, facilities, distribution, quality of services, security and innovation in business. Its features helps stakeholders to understand the network structure on a near real-time basis, for better capacity planning.
Some of the features of Telecom GIS System are as follows:
Location-Based Information
Location is fundamental to all telecommunications services—cable, wireless, and wire-line. Now with Telecom GIS system, quickly discover and access location information from an application on any device, anywhere, anytime. Most noteworthy the stakeholders can also enable sales and marketing departments to more effectively target their customers or transfer location information to the field technician to resolve problems and issues. The stakeholders can also evaluate the most cost-effective areas and routes for deploying new networks with the location-based information.
Field Data Collection
The Field data collection will be made available to all stakeholders through web interface and a mobile application. GIS system provides provides the selective mode of data collection by walk or vehicle mode. The field data collection enhances efficiency of network monitoring activities as this provides the real-time field data information. Field Data collection also helps in decreasing the response time for network recovery on the field. Geographic based work order management.
Map Creation and Updation
Map creation of networks was a lot troubled work previously, it used to take more time and man power to create a map of land survey data and lots of drawing skills to map them. Maps are created easily with the help of GIS technology now-a-days. Hence GIS system provides tool to create map in just a minute and can be updated after getting published. No drawing skills is required for creating the map of networks for telecom industry.
The integrated maps and information can help stakeholders make the better decisions about maintaining and planning the network infrastructure.
Query Management and Analysis
Telecom GIS system helps in optimize strategic planning for network expansion, Optimized network routing, cost estimating and jurisdiction with Query management and analysis of the network area. It provides the query and analysis tools to determine optimal network routing between sites to determine optional paths for cable networks applying user defined criteria (i.e. minimum distance, minimum items required). The system also provides web interface with functionality like services, physical and logical tracing. The system can also be able to do analysis of the number of customers affected due to the fault in a network.
Conversion of CAD/GIS data sets
This system supports almost every CAD and GIS data. So if the stakeholder wants to convert the CAD/GIS data files into other formats they are free to do so. Conversion of data sets can help users to get the required format of data as output they need.
Report generation and designing tools
Report generation is one of the most important feature in the Telecom GIS system. In this system stakeholders can get both the administrative report and the work order report. The user can generate own reports and download the network data. Report generation could help in Outside or inside plant management, query management or the bill of material generation.
Telecom GIS System also offers the designing tool’s functionalities like pan, zoom, identifying features on a map, measure distance, interactive north arrow, magnification window, overview window, find place, query attribute, search attribute, editing, geo-processing tasks, adding base maps etc.
Share and Collaborate
Telecom GIS system allow the stakeholders to collaborate by sharing maps and dashboards that illustrate performance and statuses to support decision-making. It allows the field operations to collect data and communicate with the main officers and similarly enables sales staff to share market forecast maps with network planners. Sharing network data can be very helpful for collaborating in telecom industry.
Check out video – how to use IGIS Map Tool in Telecom
Telecom GIS System – Uses
Identify New Business Opportunities
Telecom Marketing experts can identify the specific areas with the high growth potential businesses by visualization of map. They can determine the areas for the network investment for new businesses with high profit.
Mapping potential customers
Telecom industries personnel can visualize the potential customer base by analyzing the best location for network investments. And route for determining the nearing and exceeding capacity networks for opportunities to reach new customers.
Effective Functioning
Real-time data information via maps helps telecom industries analyze real-time progress when establishing new network infrastructure. From this information they can understand manage the progress quickly and efficiently to reduce the time to market.
Telecom GIS System helps identify relations between potential customer’s location and the organization’s marketing region. Telecom sector can use this GIS system for getting information details similar to customer’s demography, location, lifestyle, business behavior and managing organization’s marketing strategy, promotional events or Maximizing the effectiveness of strategic investments.
Basically, GIS is widely used in making effective decisions using the existing network structure and network performance status in Telecom sector. Telecom GIS system is an effective and efficient software to use for the telecom industries. For furthermore queries drop you comments below. Any suggestions are welcome.
Want a Telecom GIS System hire us or ask for Quotation. Drop mail at akshay@engineerphilosophy.com for queries.
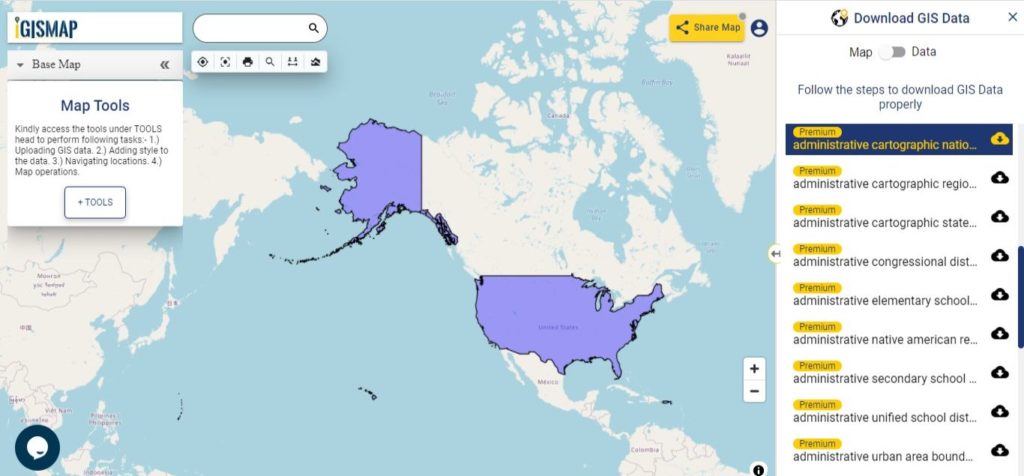
Hello GIS enthusiasts, IGISMAP has now published the latest GIS vector data of USA administrative levels. Links for downloading the shapefiles of the important administrative divisions of USA are provided in the following. You can also download these data in KML, GeoJSON or CSV formats.
Note:
All data available are in GCS datum EPSG:4326 WGS84 CRS (Coordinate Reference System).
You need to login for downloading the shapefile.
Download Shapefile Data of USA
The United States of America (U.S.A. or USA), commonly known as the United States (U.S. or US) or America, is a country primarily located in North America. It consists of 50 states, a federal district, five major unincorporated territories, 326 Indian reservations, and some minor possessions. At 3.8 million square miles (9.8 million square kilometers), it is the world’s third- or fourth-largest country by total area. The United States shares significant land borders with Canada to the north and Mexico to the south as well as limited maritime borders with the Bahamas, Cuba, and Russia. With a population of more than 331 million people, it is the third most populous country in the world. The national capital is Washington, D.C., and the most populous city is New York City.
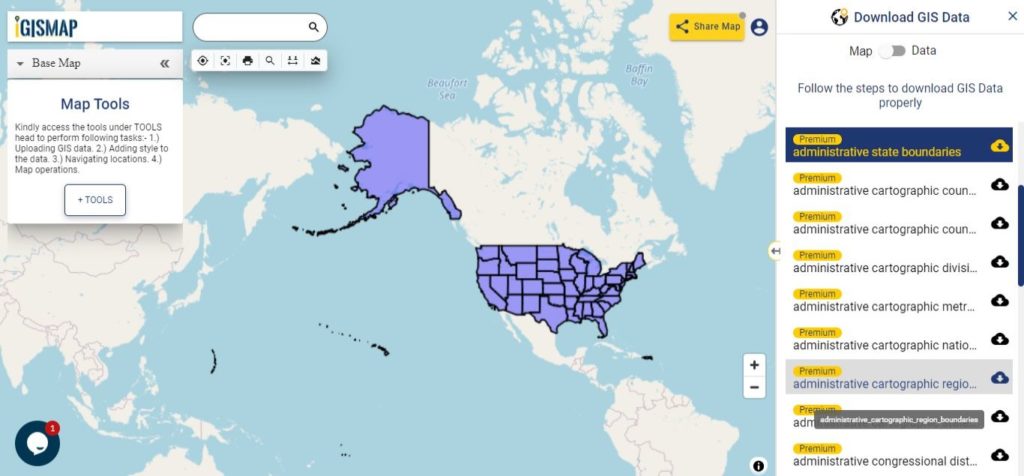
The United States of America is a federal republic consisting of 50 states, a federal district (Washington, D.C., the capital city of the United States), five major territories, and various minor islands. The 48 contiguous states and Washington, D.C., are in North America between Canada and Mexico. Alaska is an exclave in the far northwestern part of North America, connected only to Canada, and Hawaii is an archipelago in the mid-Pacific. Territories of the United States are scattered throughout the Pacific Ocean and the Caribbean Sea.
According to the numerous decisions of the United States Supreme Court, the 50 individual states and the United States as a whole are each sovereign jurisdictions.[4] The states are not administrative divisions of the country; the Tenth Amendment to the United States Constitution allows states to exercise all powers of government not delegated to the federal government.
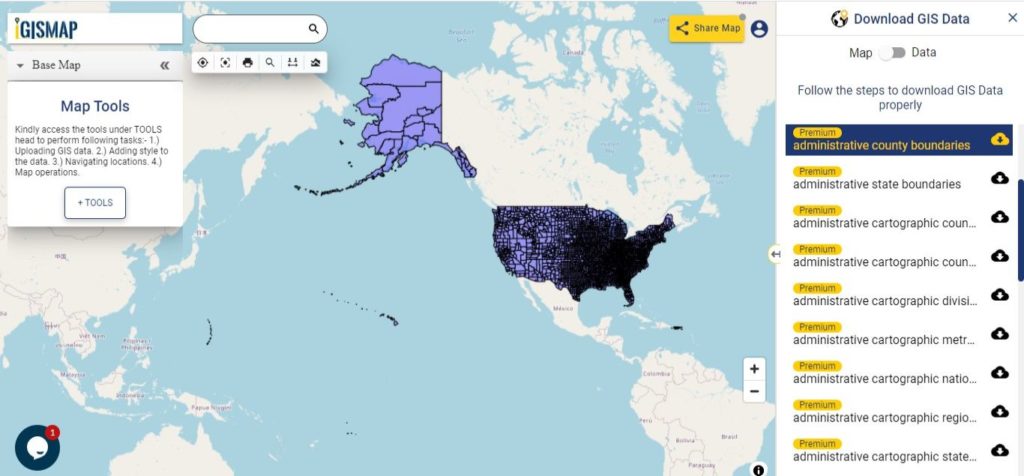
In the United States, a county is an administrative or political subdivision of a state that consists of a geographic region with specific boundaries and usually some level of governmental authority. Most counties have subdivisions which may include townships, municipalities and unincorporated areas. The number of counties per state ranges from the three counties of Delaware to the 254 counties of Texas. The following is a list of the 3,233 counties and county-equivalents in the 50 states and District of Columbia sorted by U.S. state, plus an additional 100 county-equivalents in the U.S. territories sorted by territory.
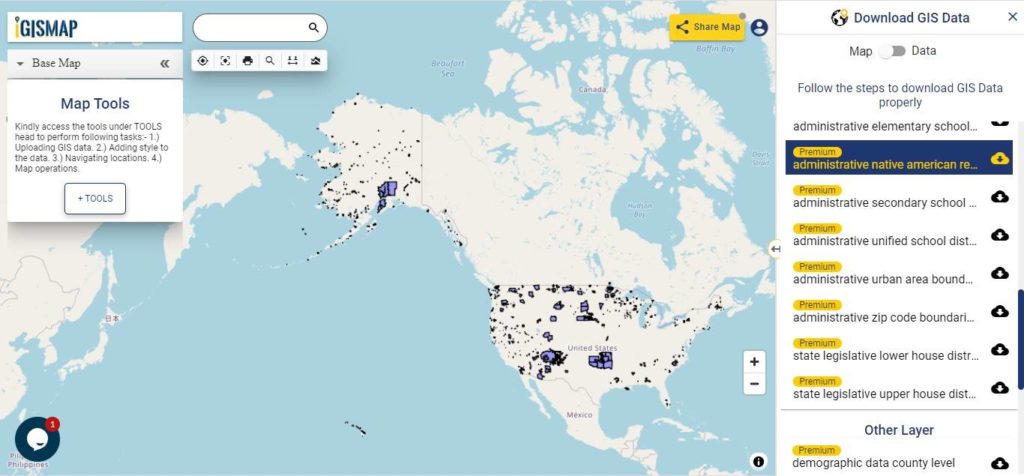
Download USA Native American Reservation Lands Shapefile Data
The Indian reservation system was created to keep Native Americans off of lands that European Americans wished to settle. The reservation system allowed indigenous people to govern themselves and to maintain some of their cultural and social traditions. The Dawes Act of 1887 destroyed the reservation system by subdividing tribal lands into individual plots.
Following classes of land reservation are established in USA
Indian Reservation Area
Alaska Native Village Statistical Areas
Hawaiian Home Lands
Oklahoma Tribal Statistical Areas
State Recognized Reservations
State Designated Tribal Statistical Areas
Tribal Designated Statistical Areas
There are 326 Indian Reservations in the United States.[1] Most of the tribal land base in the United States was set aside by the federal government as Native American Reservations. In California, about half of its reservations are called rancherías. In New Mexico, most reservations are called Pueblos. In some western states, notably Nevada, there are Native American areas called Indian colonies.
Alaska Natives previously had many small reserves scattered around Alaska; however, all but one (the Annette Island Reserve of Tsimshian) were repealed with the passage of the Alaska Native Claims Settlement Act in 1971.
There are Hawaiian home land, area held in trust for Native Hawaiians by the state of Hawaii under the Hawaiian Homes Commission Act of 1921.
Oklahoma Tribal Statistical Area is a statistical entity identified and delineated by federally recognized American Indian tribes in Oklahoma as part of the U.S. Census Bureau’s 2010 Census and ongoing American Community Survey.
A state designated American Indian reservation is the land area designated by a state for state-recognized American Indian tribes who lack federal recognition.
A tribal designated statistical area is a statistical entity identified and delineated for the Census Bureau by a federally recognized American Indian tribe that does not currently have a federally established Indian reservation.
Disclaimer : If you find any shapefile data of country provided is in correct do contact us or comment below, so that we will correct the same in our system as well we will try to correct the same in OSM.
Converting GIS data file from KMZ to GPX format is just a few click process with MAPOG KMZ To GPX Converter Online.
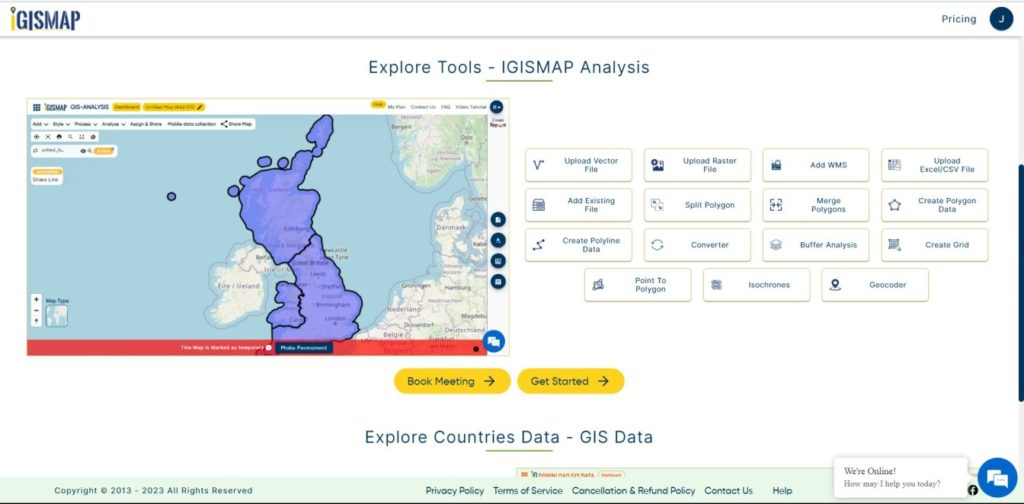
IGIS Map Converter
IGIS Map converter is an amazing tool for data conversion. With just one click, it can translate KML data, commonly used in software like Google Earth, Fusion Tables, Maps, and GPS devices, into GeoJSON (JSON) format. GeoJSON is widely utilized in software such as MongoDB, Geoserver, CartoWeb, and Feature Server.
It converts GIS/CAD files online without the need for complex and enterprise software such as ArcGIS, QGIS, or AutoCAD. IGIS Map Converter is more user-friendly compared to other conversion software or tools.
IGISMAP to Convert KMZ to GPX
For KMZ to GPX conversion, go to MAPOG Converter Tool, after logging in with your registered email and password. If you are a new user, click the Sign Up button in the Login popup and register to IGISMAP by filling the details.
IGISMAP
There are four main steps for using GIS Converter:
Click on Tool Converter
Upload the data
Choose the format to which it should be converted
Download the converted file
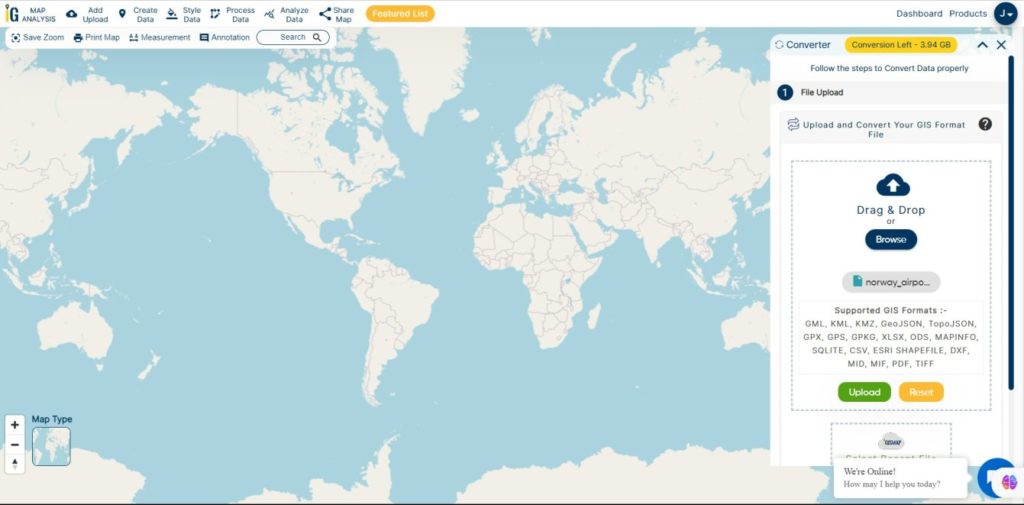
Step one is to upload your KMZ file which you want to convert. You can upload your file from system or select from the Recent Files.
Upload KMZ
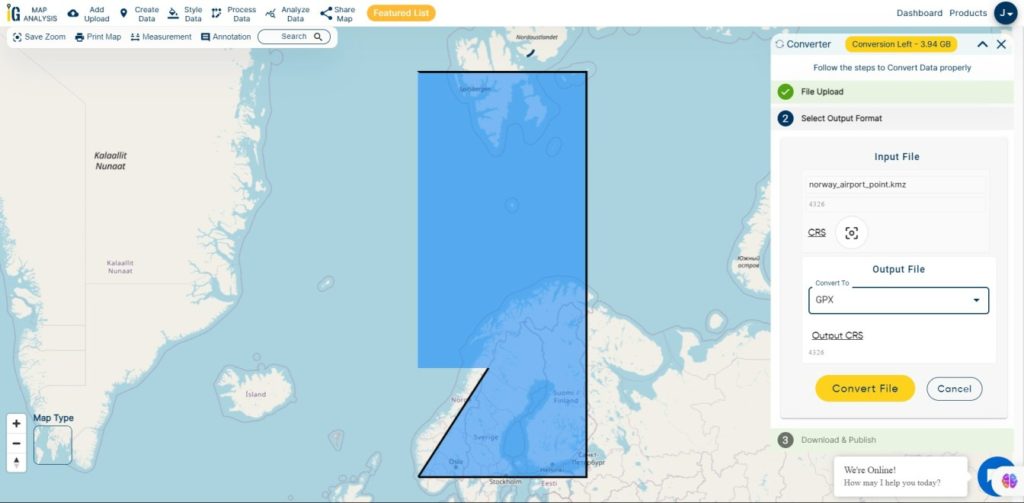
Here we using the KMZ file of Norway Airport Points.
Step two is to select the output format from the dropdown for the converted file, in this case its GPX. You can also set the Coordinate Reference System of your preference. As a default CRS will set to WGS 84 (World) [EPSG:4326]. Click on the Convert File.
Select GPX as an Output Format
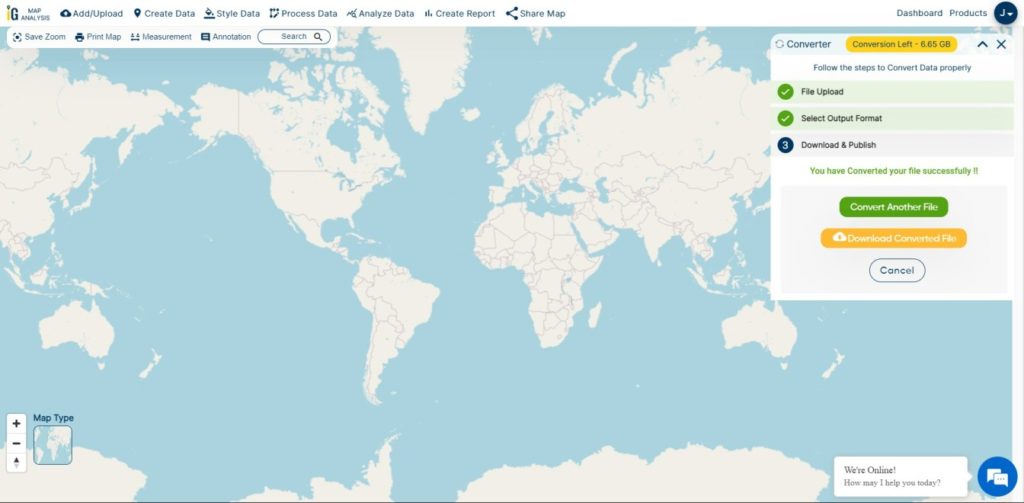
Your KMZ file will then gets converted to GPX file after a few seconds and will be available for downloading.
Download GPX File
You can also choose to style the layer or continue with further conversion process by clicking the Convert Another File button.
Converted Files section from the dashboard contains the list of the details of all the conversion done in your account, providing both input and output data available for download their corresponding formats.
We use cookies to ensure that we give you the best experience on our website. If you continue to use this site we will assume that you are happy with it.Ok