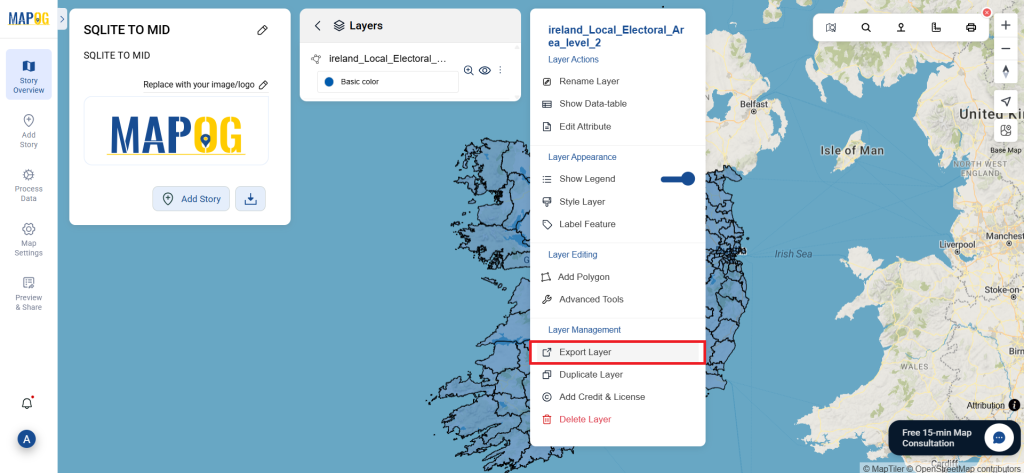
This guide will walk you through the steps to convert SQLITE data into MID format using the Converter Tool in MAPOG. Whether you’re a first-time user or a seasoned pro, so we’ll break down the entire conversion process into straightforward steps.
Firstly, The Converter Tool in MAPOG allows you to seamlessly convert data from one format to another, almost like magic. However, You simply upload your data in one format, and the tool transforms it into another format that best suits your needs. Plus, GIS Data can be downloaded in a variety of formats, making it versatile for a wide range of applications.
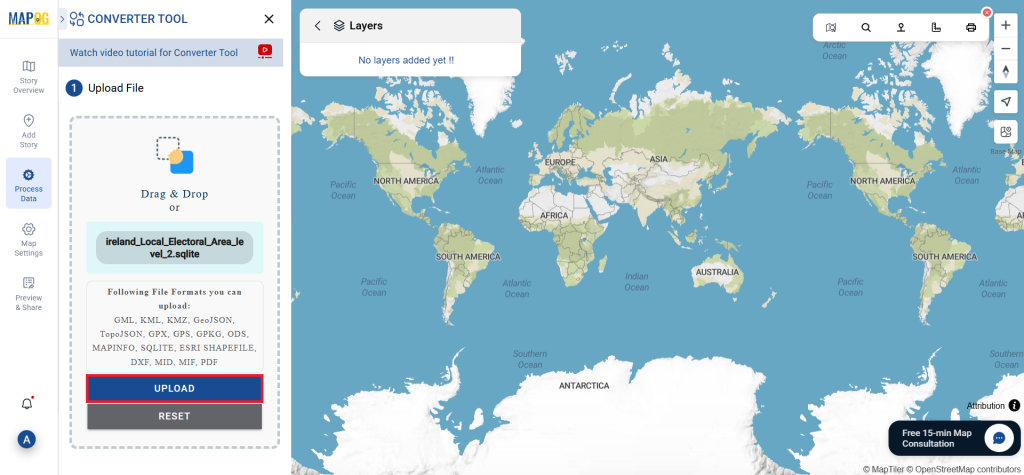
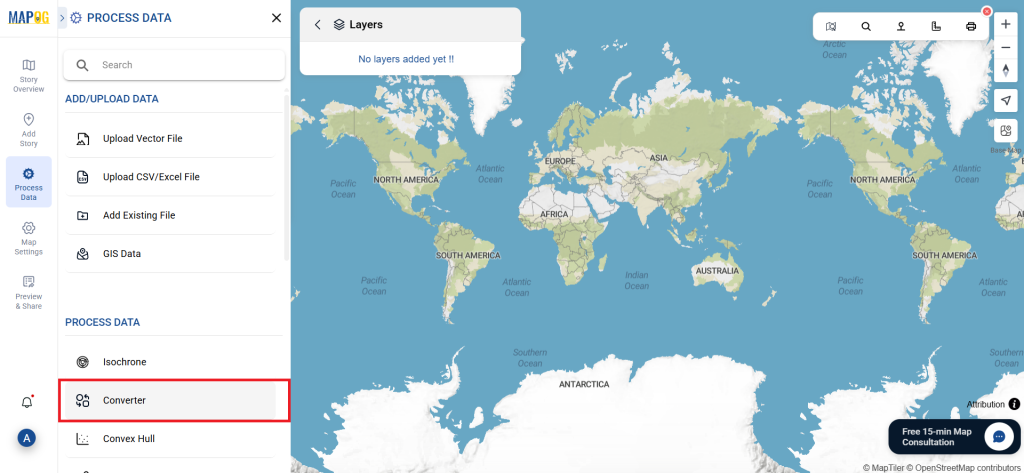
Navigate the “Process Data” section and select the “Converter Tool” option to get started.
Upload your SQLITE file. This is your entry point where you feed in the information that needs conversion.
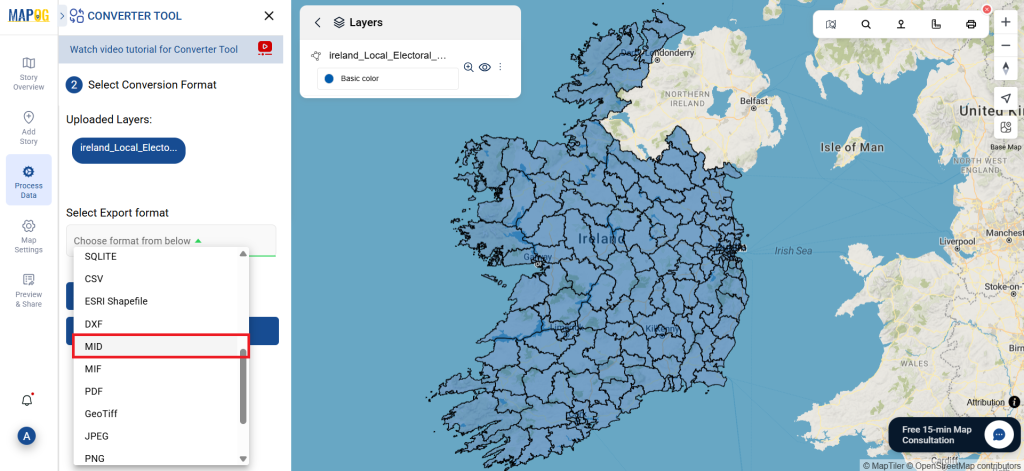
Step 2: Choose the Conversion Format:
To proceed, set the output format to MID if your goal is to export just the data. The tool offers various conversion options, but for this guide, we’ll focus on converting the file to MID format.
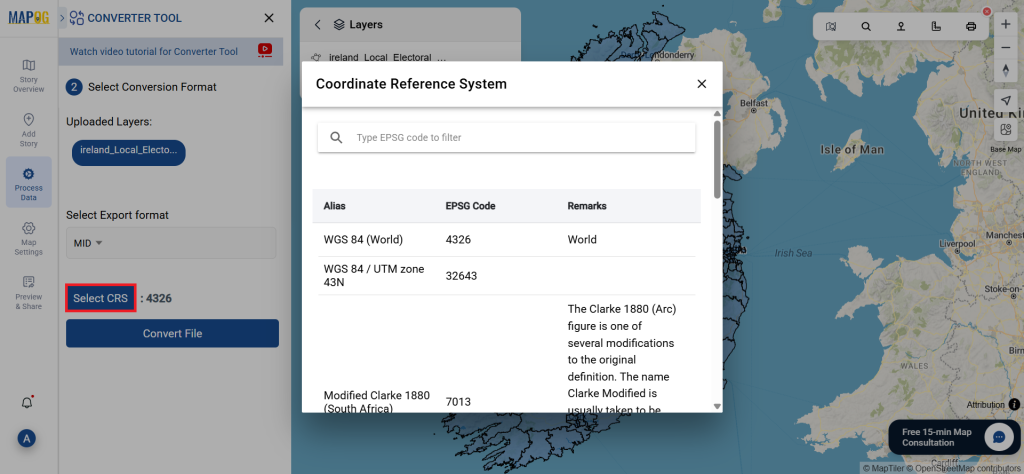
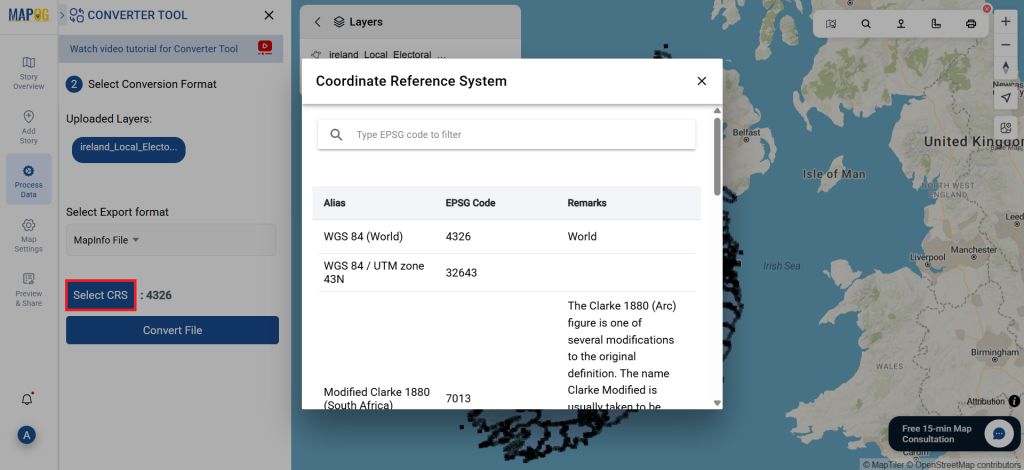
Additionally, you can configure the Output CRS to match your spatial requirements.
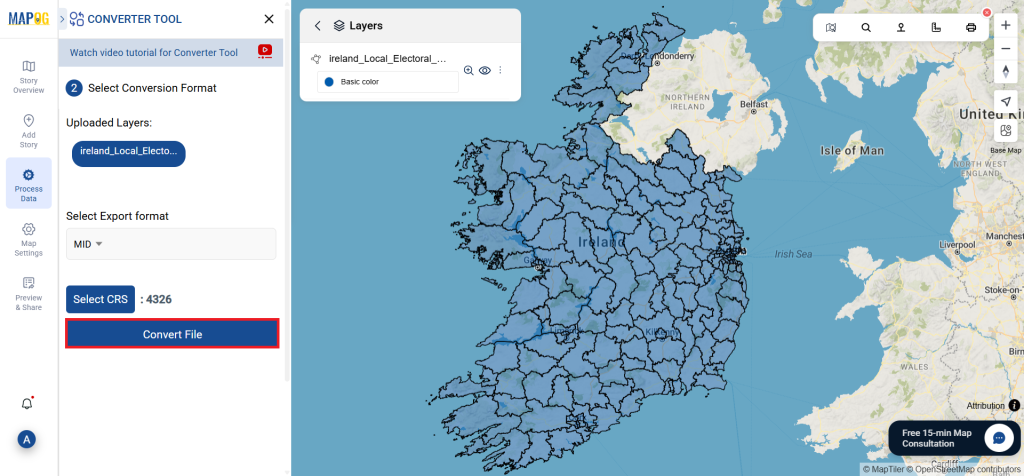
Step 3: Execute the Conversion:
Navigate to the ‘Convert Files’ section and let the tool do its job. By using the Converter Tool, you upload your data, and the tool automatically converts it from SQLITE to MID format, streamlining the entire process.
Step 4: Review and Download:
Take a moment to review your converted MID data to make sure everything looks correct. Once you’re happy with it, go ahead and download the file. This step is really important to ensure that the conversion worked properly and that all your data is intact.
Looking to download animal shelter data for mapping, emergency response, or urban planning? GIS Data by MAPOG makes it simple and efficient. With access to a wide range of GIS formats including Shapefile, KML, MID, GeoJSON, and more, this platform offers structured, reliable shelter datasets. Whether you’re involved in disaster preparedness, public welfare, or environmental studies, MAPOG provides detailed animal shelter data ready for integration into any GIS workflow.
How to Download Animal Shelter Data
MAPOG’s user-friendly interface makes accessing shelter data intuitive. With support for over 15+ GIS formats like KML, SHP, DXF, CSV, MIF, SQL, and TOPOJSON, users can easily integrate the data into their preferred GIS software.
• All data is provided in GCS datum EPSG:4326 WGS84 CRS (Coordinate Reference System). • Users need to log in to access and download their preferred data formats.
Step-by-Step Guide to Access Shelter Datasets
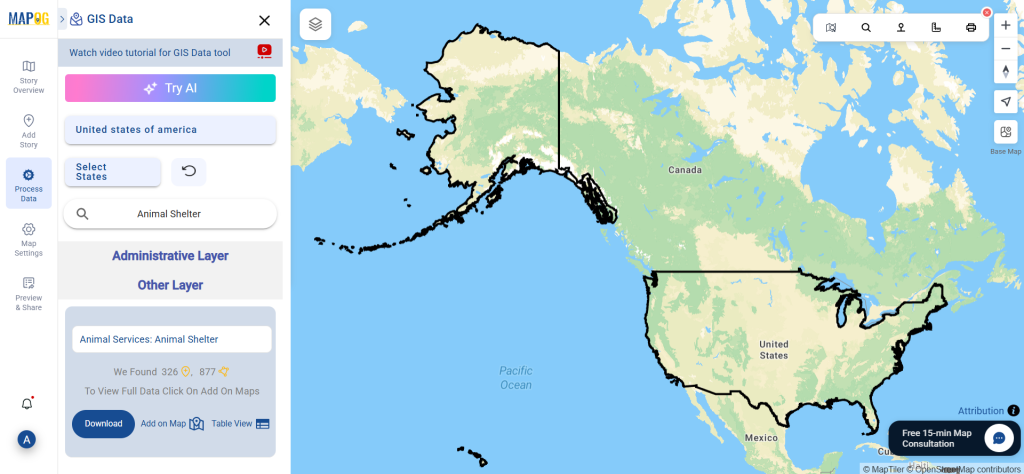
Step 1: Search for Animal Shelter Layers
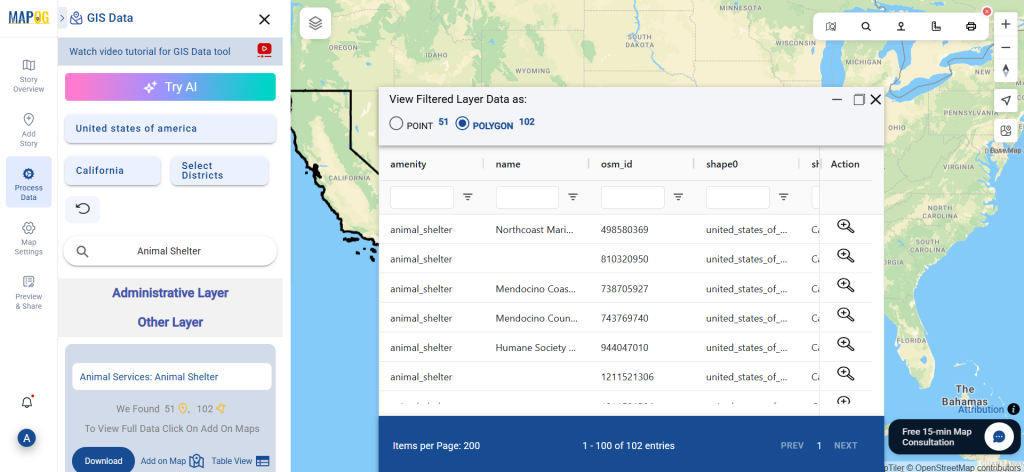
After coming in MAPOG interface click on Process data and under add upload data section , select GIS data. Begin by selecting your region of interest. Use the search tool to locate “Animal Shelter Data.” Check if the data is available as points or polygons based on your mapping needs.
With MAPOG’s “Try AI” feature, typing phrases like “shelters near me” or “animal shelters in [location]” brings up the most relevant layers. This smart search saves time and improves result accuracy.
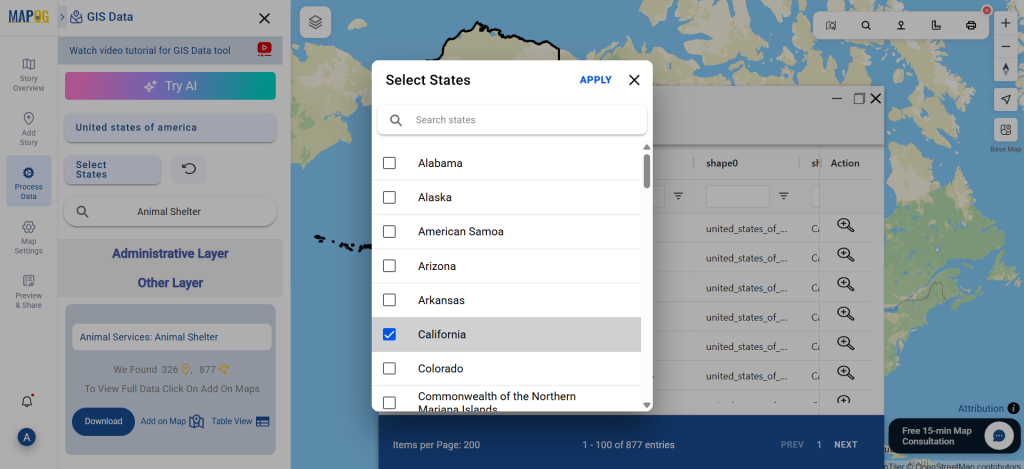
Step 3: Filter by Region
Narrow your search using the Filter Data tool. You can refine data by state and district, helping you target shelter locations with high precision and localized relevance.
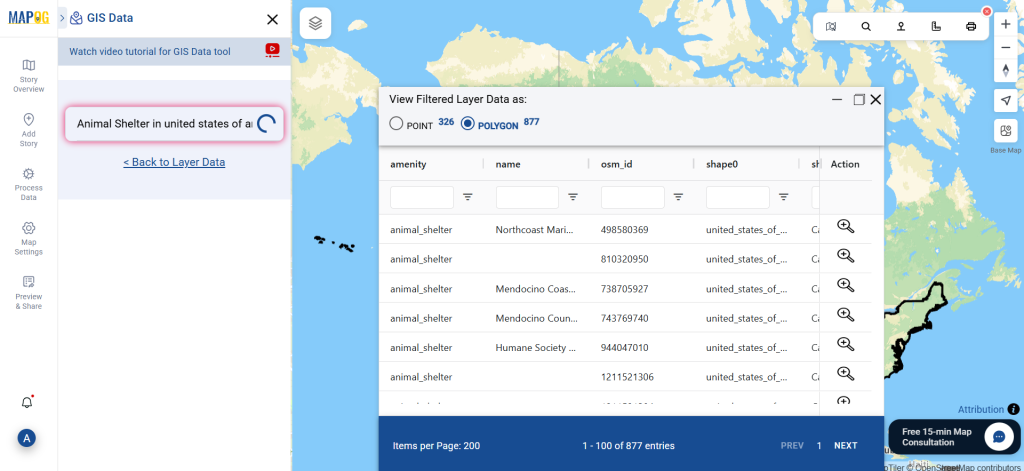
Step 4: Add Data to Map
Click “Add on Map” to visualize your selected data. This interactive mapping view aids in analyzing shelter distribution, access routes, and potential coverage gaps.
Step 5: Download Animal Shelter Data
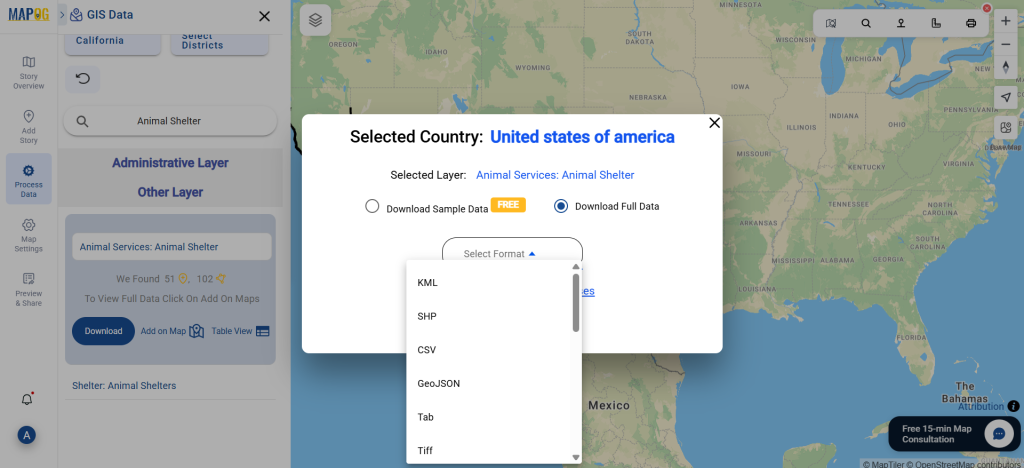
Once finalized, click “Download Data.” Choose between sample or full data and select the desired format—Shapefile, KML, MID, or others. Accept the terms, and your download is ready.
Final Thoughts
To sum up, MAPOG simplifies the entire process to download animal shelter data, making it accessible for both professionals and hobbyists. With detailed, ready-to-use shelter datasets in multiple formats, you’re equipped for better planning, research, and humane response strategies.
For any questions or further assistance, feel free to reach out to us at support@mapog.com. We’re here to help you make the most of your GIS data.
❓ Frequently Asked Questions (FAQ) on Animal Shelter GIS Data
1. Where can I download animal shelter data for GIS mapping?
You can download animal shelter GIS data from MAPOG Dashboard. The platform provides structured datasets in formats like Shapefile, KML, GeoJSON, MID, and CSV, making it compatible with most GIS software.
2. Which GIS formats are available for animal shelter data?
MAPOG supports over 15+ GIS formats, including SHP, KML, CSV, GeoJSON, DXF, SQL, MID/MIF, and TOPOJSON. All data is provided in EPSG:4326 WGS84 CRS for global compatibility.
3. How do I filter animal shelter data by region?
Using MAPOG’s Filter Data tool, you can refine shelter data by country, state, or district. This ensures that planners, researchers, and NGOs get localized datasets for accurate analysis.
4. Can I preview animal shelter locations before downloading?
Yes. MAPOG allows users to click “Add on Map” to visualize animal shelter locations before downloading. This helps in identifying distribution patterns, accessibility routes, and service gaps.
Disaster response teams – locating shelters during emergencies.
NGOs & researchers – studying animal welfare and public health.
Government agencies – planning and monitoring community services.
6. Do I need to create an account to download animal shelter data?
Yes. Users need to log in to MAPOG to access and download full datasets in their preferred format.
7. Is the animal shelter data free?
MAPOG provides both sample datasets and full datasets. Sample data is often free, while full datasets may require access permissions or subscription depending on the coverage and format.
Disclaimer : The GIS data provided for download in this article was initially sourced from OpenStreetMap (OSM) and further modified to enhance its usability. Please note that the original data is licensed under the Open Database License (ODbL) by the OpenStreetMap contributors. While modifications have been made to improve the data, any use, redistribution, or modification of this data must comply with the ODbL license terms. For more information on the ODbL, please visit OpenStreetMap’s License Page.
GIS Data by MAPOG is a user-friendly platform that allows users to download clinic data in various GIS formats, including Shapefile, KML, and GeoJSON. The platform provides a seamless way to access and analyze healthcare facility locations, making it easier for planners, researchers, and policymakers to map and study clinic distributions worldwide.
How to get Clinic Data in MAPOG
MAPOG supports multiple data formats, ensuring compatibility with GIS tools. Users can access Shapefile, KML, CSV, GeoJSON and many more formats for their analysis. We can get 200+ countries 900+ datasets available here.
All data is provided in GCS datum EPSG:4326 WGS84 CRS (Coordinate Reference System).
Users need to log in to access and download their preferred data formats.
Step-by-Step Guide to Download Clinic Data
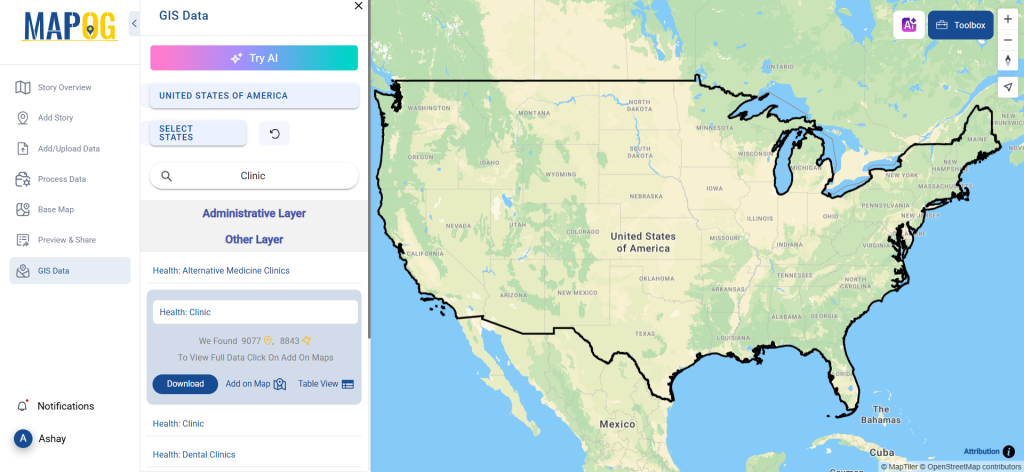
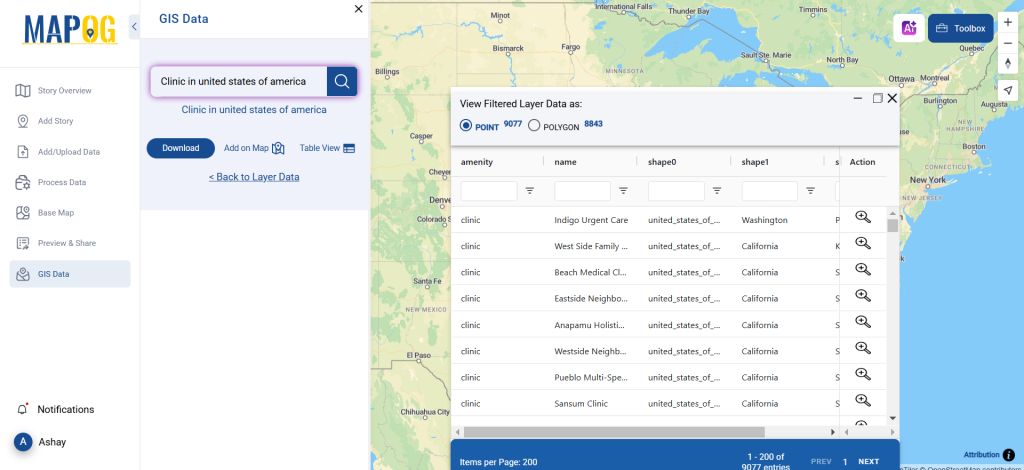
Step 1: Search for ‘Clinic Data’
After accessing the GIS Data interface, select the desired country. Use the search layer option to locate Clinic data for specific locations. Review data attributes to check if they are formatted as points or polygons. For instance, users can search for medical centers in countries like the USA, UK, Canada, and Germany.
Try the AI tool, “Try AI,” in the upper left corner to simplify the search process. Just enter what data you need and from which region, and the AI will provide the most relevant results.
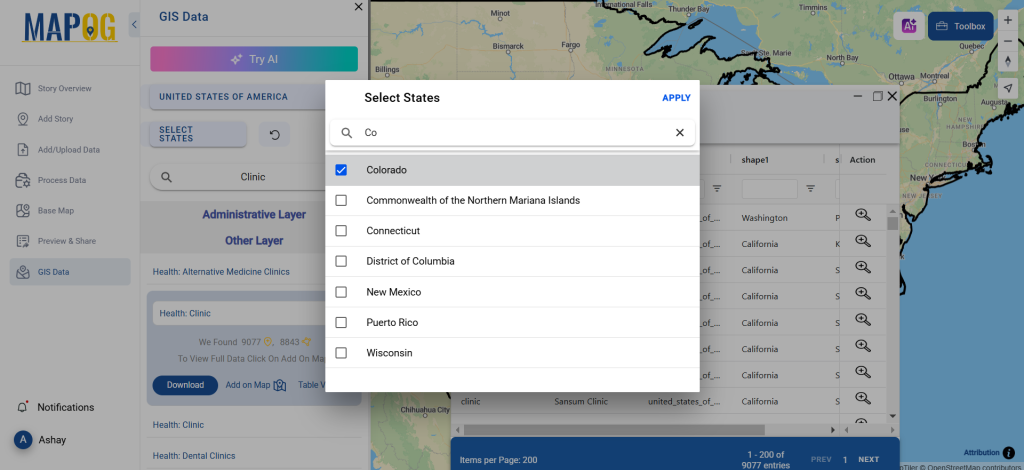
Step 3: Apply Filters
Refine your search using the Filter Data option. This allows users to select specific states, cities, or districts, ensuring precise results. Filtering data enhances accuracy, making it useful for regional healthcare analysis and planning.
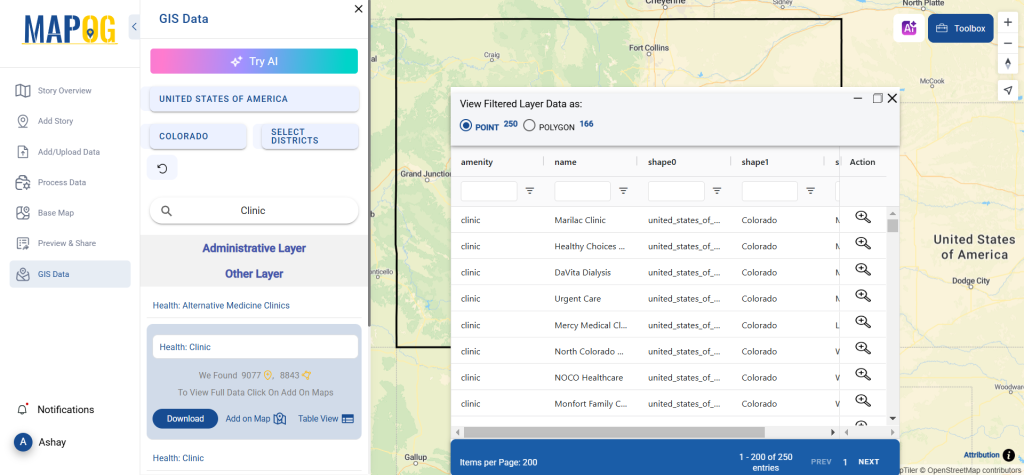
Step 4: Add to Map for Visualization
With the “Add on Map” feature, users can overlay clinic data onto a map for spatial analysis. By clicking on this option, they can either create a new map or integrate the dataset into an existing GIS project for deeper insights.
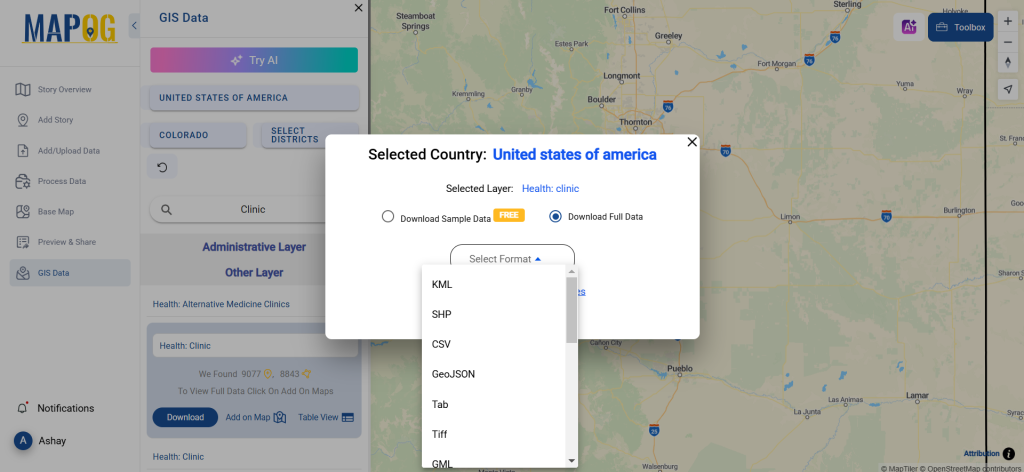
Step 5: Download Clinic Data in Preferred Format
Click the “Download Data” button. Choose between sample data or the full dataset based on requirements. Select the format you need, such as Shapefile, KML, or GeoJSON. Accept the terms and conditions, then proceed with the final download.
Conclusion
GIS Data by MAPOG makes it easy to download clinic data in multiple GIS formats. With precise location-based data, users can enhance healthcare planning, accessibility analysis, and emergency preparedness. Whether for government agencies, research institutions, or urban planners, MAPOG provides a valuable resource for healthcare mapping.
Disclaimer : The GIS data provided for download in this article was initially sourced from OpenStreetMap (OSM) and further modified to enhance its usability. Please note that the original data is licensed under the Open Database License (ODbL) by the OpenStreetMap contributors. While modifications have been made to improve the data, any use, redistribution, or modification of this data must comply with the ODbL license terms. For more information on the ODbL, please visit OpenStreetMap’s License Page.
Greenfield development refers to the construction of new infrastructure on previously undeveloped land. This includes residential, commercial, and industrial projects. Accessing accurate geographic data is crucial for planning and decision-making. GIS Data by MAPOG makes it easy to download Greenfield Development Data in multiple formats like Shapefile, KML, and MID, ensuring compatibility with various GIS tools.
Why Use GIS Data by MAPOG?
GIS Data by MAPOG is a user-friendly platform offering multiple GIS formats, including Shapefile, KML, and GeoJSON. It simplifies the process of obtaining Greenfield Development Data, allowing users to analyze administrative and geographic datasets efficiently. With coverage spanning 200+ countries and over 900 data layers, it ensures detailed mapping and analysis for urban planning and infrastructure development.
All data is provided in GCS datum EPSG:4326 WGS84 CRS (Coordinate Reference System).
Users need to log in to access and download their preferred data formats.
Step-by-Step Guide to Download Greenfield Development Data
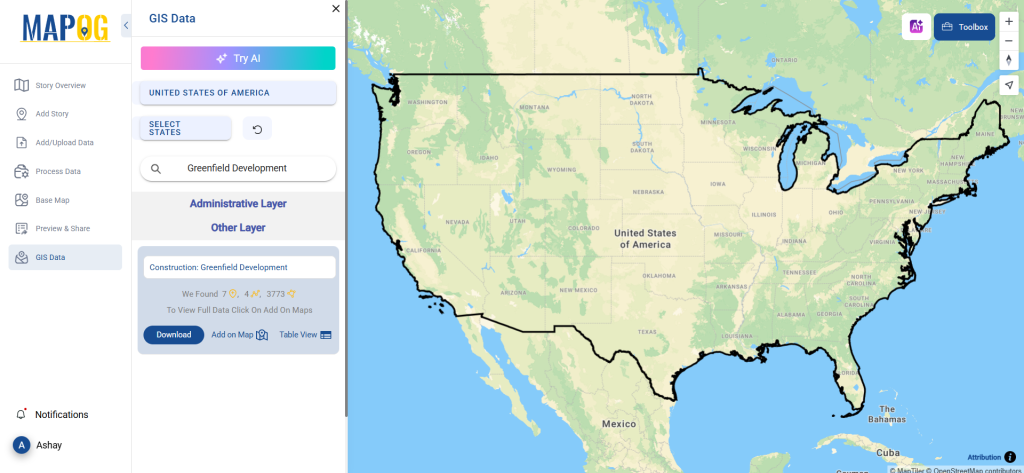
Step 1: Search for Greenfield Development Data
Log in to GIS Data by MAPOG. Select the desired country and use the search bar to find “Greenfield Development data.” Review the data attributes, including whether the dataset is a point or polygon.
The “Try AI” tool, located in the upper left corner, simplifies the search process. Enter the required data type and location, and the AI will suggest relevant datasets instantly.
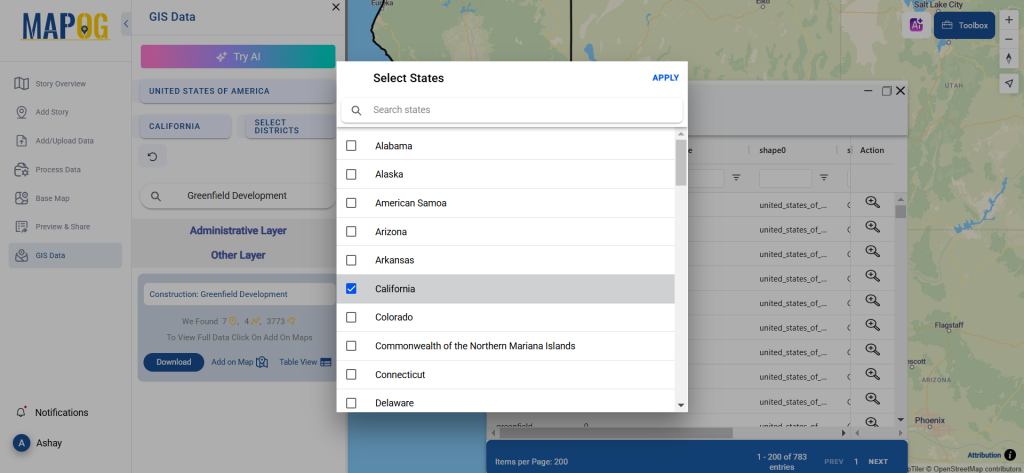
Step 3: Apply Filters for Specific Data
Refine your search using the filter option. Filter by state, district, or city to focus on specific areas of Greenfield development. This feature enhances accuracy and relevance for spatial analysis and planning.
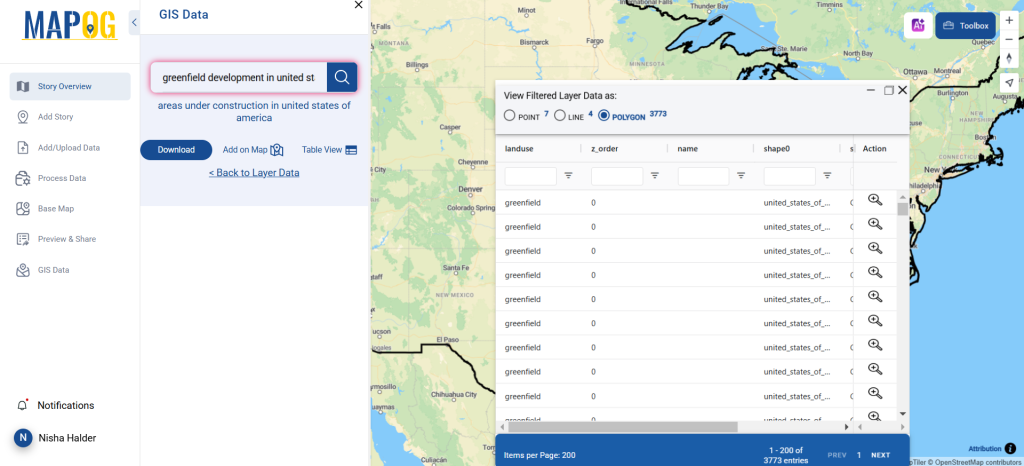
Step 4: Visualize Data on the Map
The “Add on Map” feature allows users to overlay selected data onto a GIS map. This helps in visualizing spatial patterns and analyzing development potential. Users can add the dataset to an existing map or create a new one.
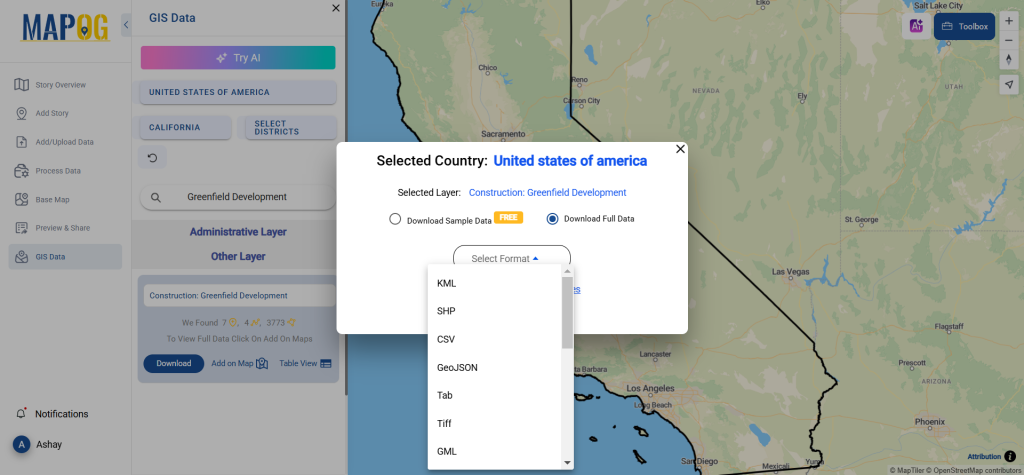
Step 5: Download Data in Your Preferred Format
Click on “Download Data” and choose between sample data or the full dataset. Select the required format—Shapefile, KML, GeoJSON, or any of the 15+ supported formats. Accept the terms and conditions, then click “Download.”
Conclusion
Downloading Greenfield Development Data from GIS Data by MAPOG is simple and efficient. With multiple formats available, users can seamlessly integrate data into their GIS workflows. Whether for urban planning, environmental assessment, or infrastructure development, MAPOG ensures easy access to up-to-date Greenfield Development Data, making it an essential tool for professionals and researchers.
Disclaimer : The GIS data provided for download in this article was initially sourced from OpenStreetMap (OSM) and further modified to enhance its usability. Please note that the original data is licensed under the Open Database License (ODbL) by the OpenStreetMap contributors. While modifications have been made to improve the data, any use, redistribution, or modification of this data must comply with the ODbL license terms. For more information on the ODbL, please visit OpenStreetMap’s License Page.
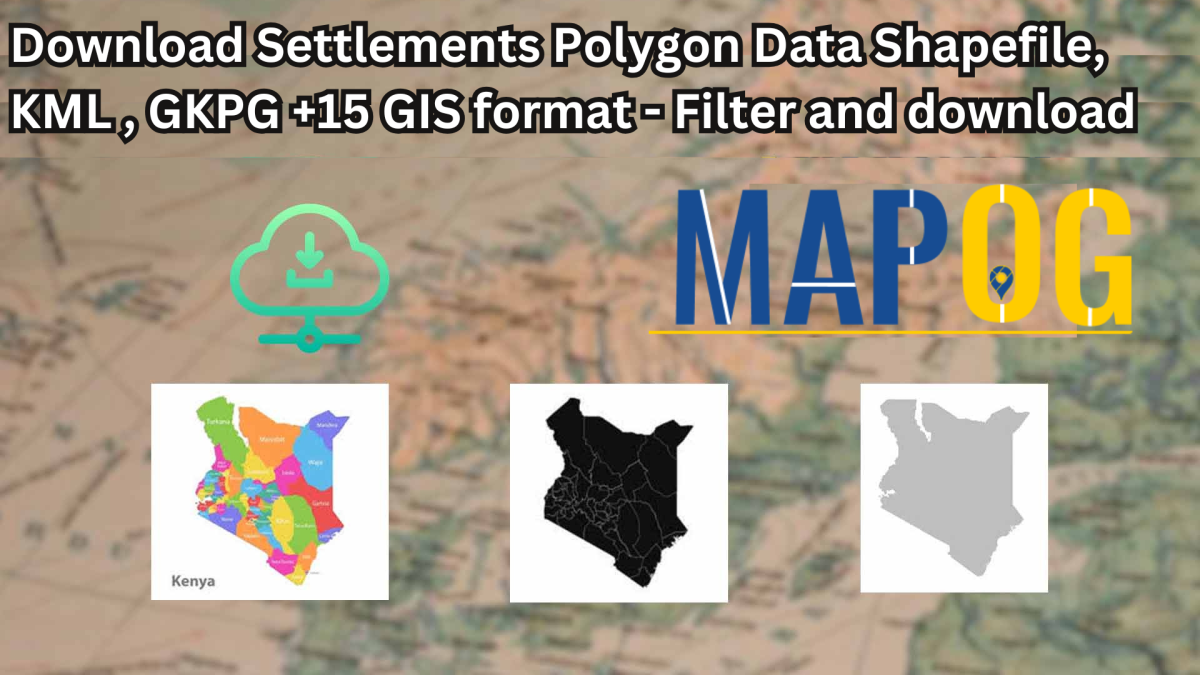
Looking to map residential patterns or study human settlements with precision? Download Settlements Polygon Data easily using GIS Data by MAPOG—a robust platform that offers access to well-structured spatial datasets in over 15 GIS-supported formats such as Shapefile, KML, MID, GeoJSON, and more. Whether you’re planning urban infrastructure, conducting demographic analysis, or working on environmental studies, MAPOG’s detailed settlement polygons allow you to explore populated areas with accuracy and clarity.
How It Works – A Smart, Streamlined Process
GIS Data by MAPOG is designed with user experience in mind, offering a quick and intelligent way to access settlement boundaries from a massive database covering 900+ layers. You can Download Settlements Polygon Data in multiple formats including KML, SHP, CSV, SQL, DXF, MIF, and GPX. Whether you’re a professional, student, or policy planner, the platform ensures that you get high-quality data ready for integration into any GIS software.
All data is provided in GCS datum EPSG:4326 WGS84 CRS (Coordinate Reference System).
Users need to log in to access and download their preferred data formats.
Step-by-Step Guide to Download Settlements Polygon Data
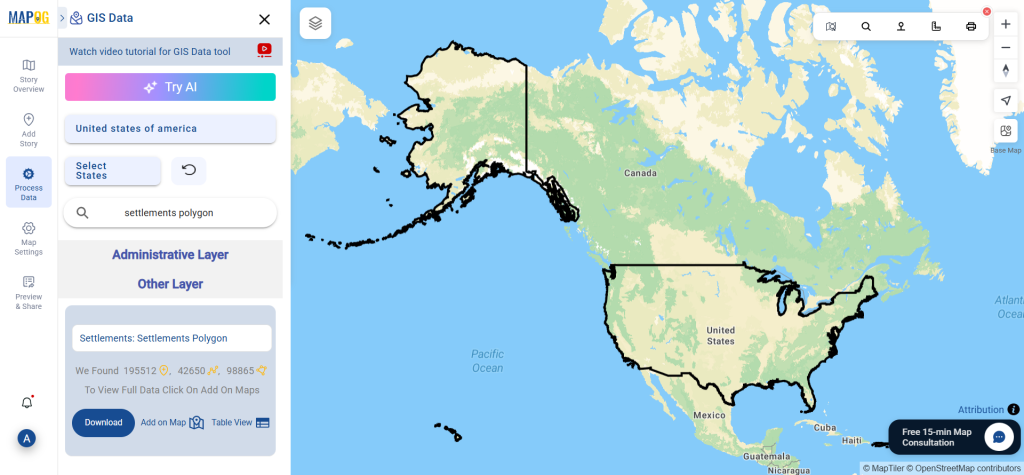
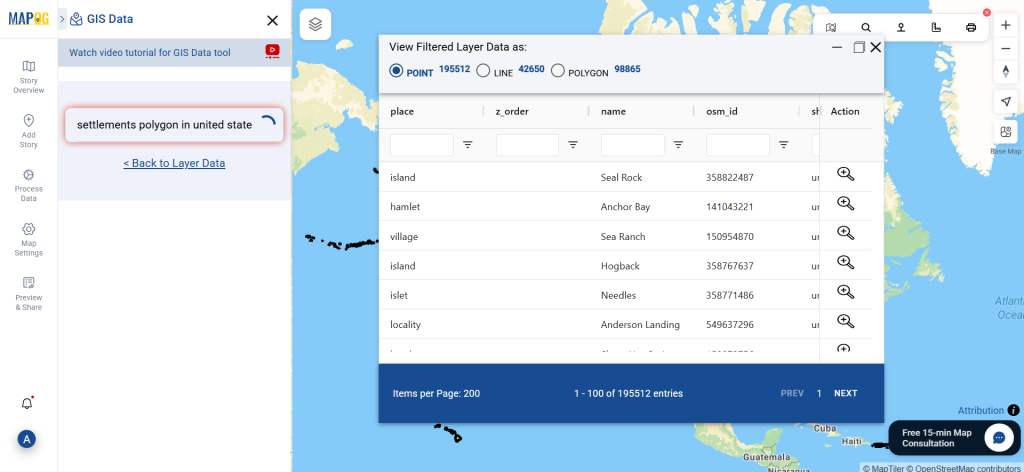
Step 1: Search for Settlement Layers
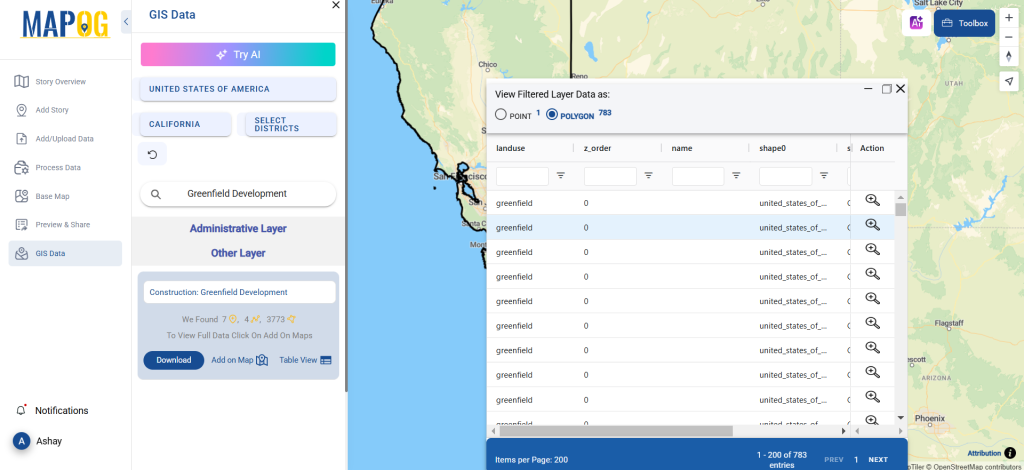
Begin by selecting your area of interest within the MAPOG interface. Use the search bar to locate “Settlements Polygon” layers. You’ll be able to check attributes such as population details, area, and density coverage.
The built-in “Try AI” feature can instantly fetch the most relevant datasets. Just type phrases like “Residential areas polygon” or “Settlements in a region,” and let the AI deliver accurate results without the hassle of manual browsing.
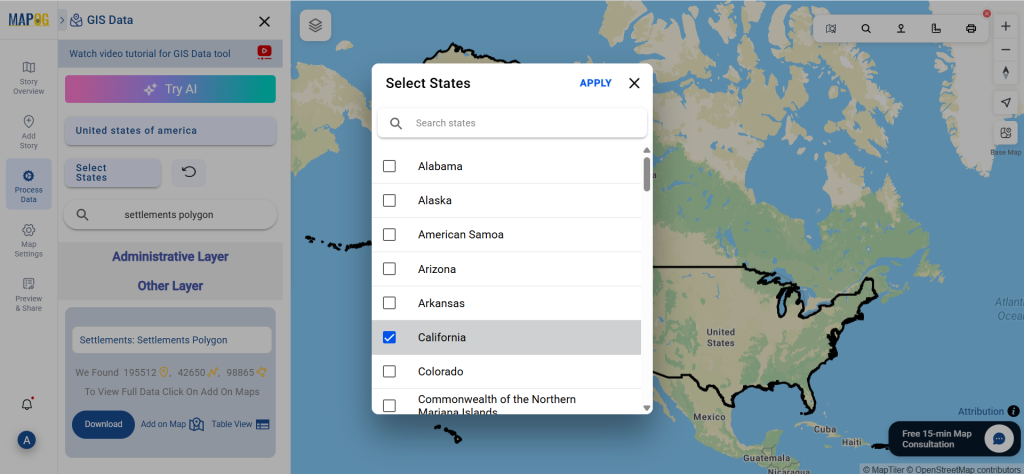
Step 3: Filter the Data for Precision
Narrow down your results using the Filter Data option. Whether you’re looking for settlement data in a specific district or state, this feature ensures you’re only working with the most relevant polygons.
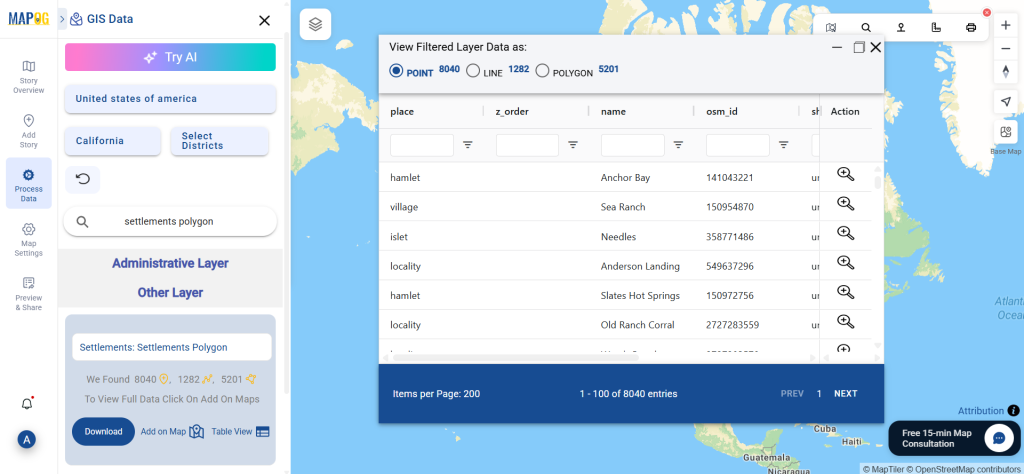
Step 4: Add Data to Map for Live Visualization
Click on the “Add on Map” button to overlay your selected dataset onto the analysis interface. This allows you to visualize the shape and spread of settlements in real time, compare multiple layers, or assess accessibility and proximity to other features.
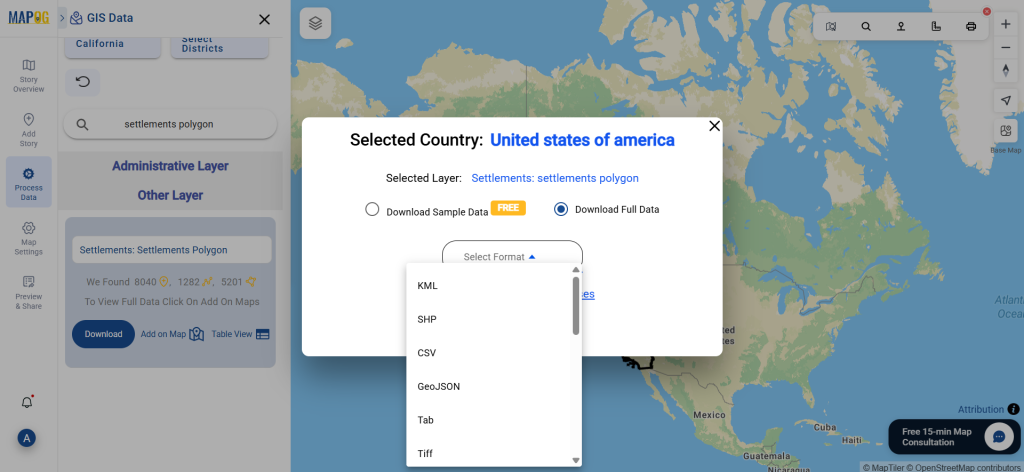
Step 5: Download in Your Preferred Format
Once satisfied with the dataset, proceed to download. Choose a sample or full version, select your required format—whether it’s Shapefile, KML, MID, or any of the supported 15+ options—agree to the terms, and initiate your download.
Final Thoughts
MAPOG makes it remarkably simple to Download Settlements Polygon Data for a wide range of GIS applications. The combination of smart search tools, flexible download formats, and interactive mapping ensures that your workflow remains efficient and insightful. Whether you’re building a city model, conducting a field study, or managing a development project, MAPOG gives you access to settlement polygons that are accurate, reliable, and ready to use.
Disclaimer : The GIS data provided for download in this article was initially sourced from OpenStreetMap (OSM) and further modified to enhance its usability. Please note that the original data is licensed under the Open Database License (ODbL) by the OpenStreetMap contributors. While modifications have been made to improve the data, any use, redistribution, or modification of this data must comply with the ODbL license terms. For more information on the ODbL, please visit OpenStreetMap’s License Page.
GIS Data by MAPOG is a user-friendly platform that provides easy access to various GIS data formats like Shapefile, KML, and GeoJSON. Whether you are a GIS professional or a researcher, this platform makes it effortless to download shopping malls data efficiently. It includes a vast collection of administrative and geographic datasets, allowing for detailed mapping and spatial analysis of shopping centers worldwide.
How to Download Shopping Malls Data Using GIS Data by MAPOG?
MAPOG simplifies the shopping malls data download process, offering over 200 countries and 900+ layers in multiple GIS formats, such as Shapefile, KML, and MID. With a step-by-step guide, users can efficiently access relevant data for their projects.
All data is provided in GCS datum EPSG:4326 WGS84 CRS (Coordinate Reference System).
Users need to log in to access and download their preferred data formats.
Step-by-Step Guide to Download Shopping Malls Data
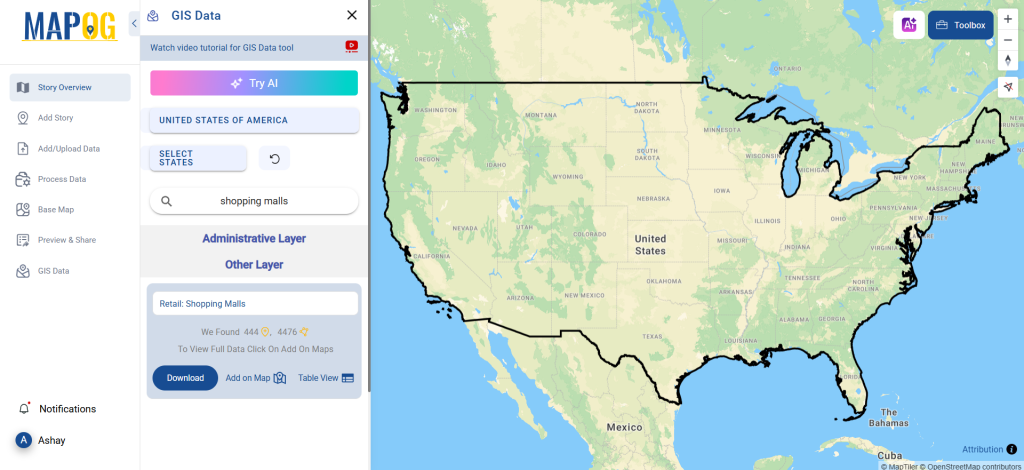
Step 1: Search for Shopping Malls Data
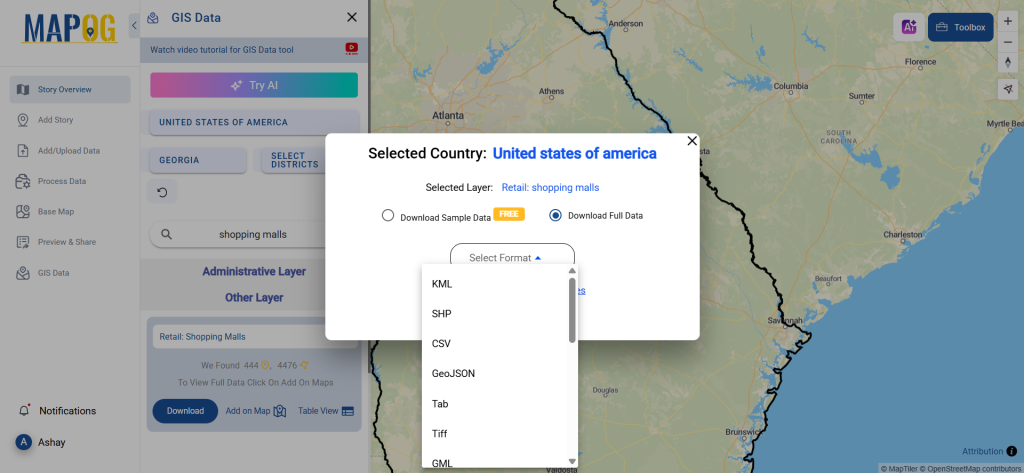
Log in to GIS Data by MAPOG. Select your desired country, then use the search bar to locate Shopping Malls Data. The system provides details such as location, size, and data attributes, formatted as point or polygon layers.
The “Try AI” tool simplifies the search. Just enter the type of data and the location, and the AI feature will provide accurate results, saving time and effort.
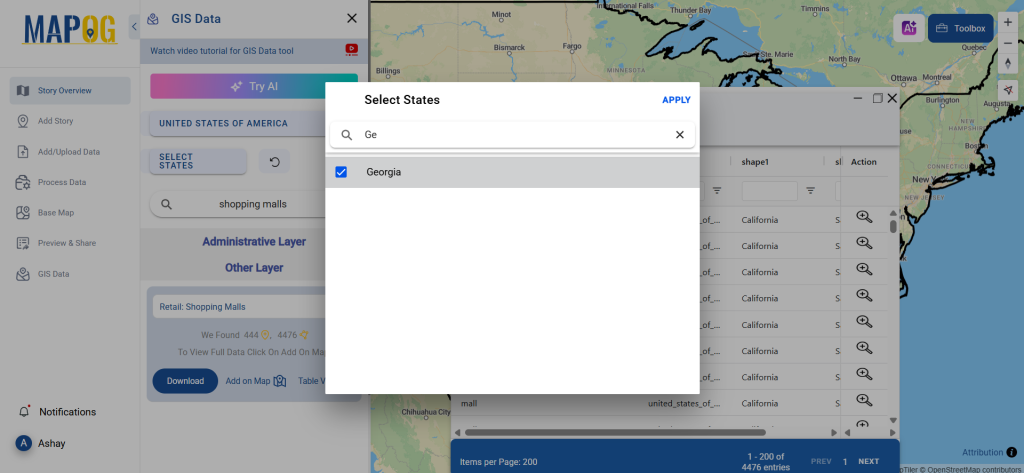
Step 3: Filter Data for Specific Locations
The filtering option allows users to refine their search based on specific regions, cities, or districts. This feature ensures that only relevant shopping malls data is selected, enhancing accuracy for analysis or visualization.
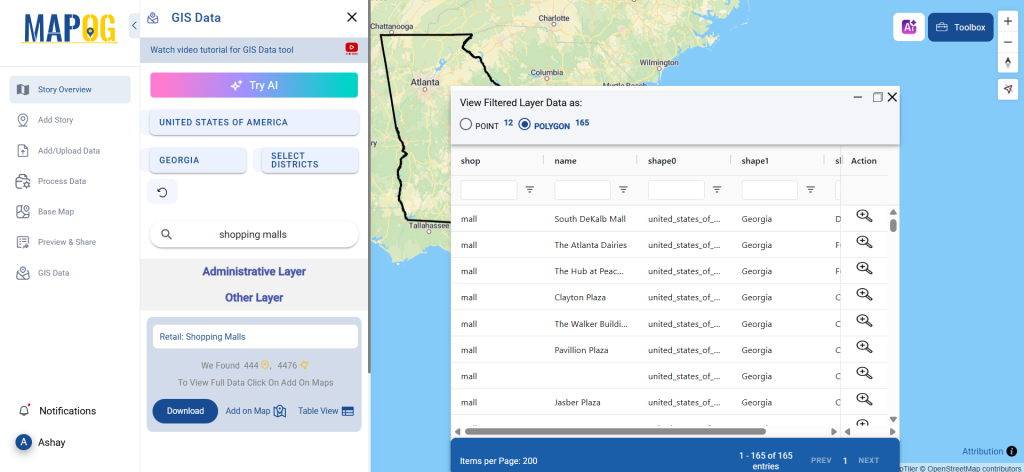
Step 4: Visualize Data on a Map
With the Add on Map feature, users can overlay selected shopping malls data onto a map for further analysis. This functionality helps in identifying shopping trends, spatial patterns, and urban development opportunities.
Step 5: Download the Data
Click the Download Data button and choose between sample data or the full dataset. Select the required format—Shapefile, KML, GeoJSON, MID, or any of the 15+ supported formats. Accept the terms and conditions and initiate the download.
Conclusion
GIS Data by MAPOG offers a seamless way to download shopping malls data in multiple formats. Whether for business analysis, urban planning, or research, this platform ensures access to accurate and up-to-date shopping mall information. Start exploring today and unlock valuable insights with high-quality GIS data.
Disclaimer : The GIS data provided for download in this article was initially sourced from OpenStreetMap (OSM) and further modified to enhance its usability. Please note that the original data is licensed under the Open Database License (ODbL) by the OpenStreetMap contributors. While modifications have been made to improve the data, any use, redistribution, or modification of this data must comply with the ODbL license terms. For more information on the ODbL, please visit OpenStreetMap’s License Page.
GIS Data by MAPOG is a powerful platform that allows users to download Animal Hospitals Data in various formats, including Shapefile, KML, GeoJSON, and MID. The platform provides an intuitive interface to access comprehensive geographic datasets that support mapping, analysis, and planning. Whether you’re a GIS professional or an enthusiast, MAPOG simplifies the data extraction process for better decision-making.
Why Animal Hospitals Data Matters
Animal hospitals play a vital role in providing healthcare for pets and wildlife. Their locations, services, and availability are crucial for veterinarians, pet owners, and emergency responders. With GIS Data by MAPOG, users can access up-to-date and accurate geographic information about animal hospitals worldwide. This data aids in spatial analysis, resource allocation, and service optimization in veterinary care.
All data is provided in GCS datum EPSG:4326 WGS84 CRS (Coordinate Reference System).
Users need to log in to access and download their preferred data formats.
Step-by-Step Guide to Download Animal Hospitals Data
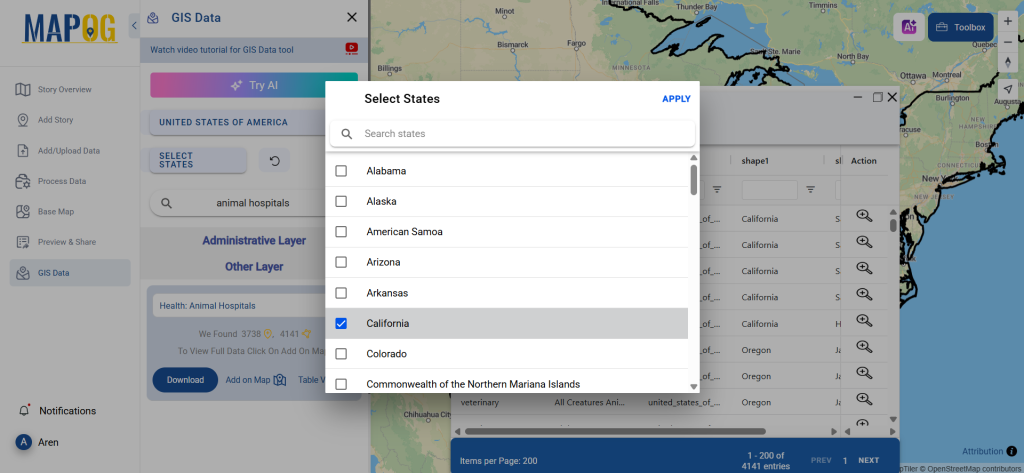
Step 1: Search for Animal Hospitals Data
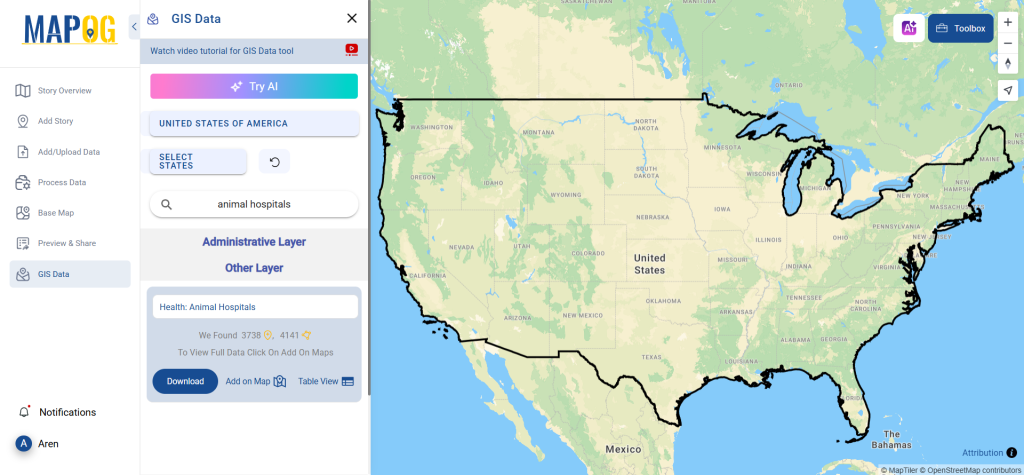
Begin by selecting your desired country in the GIS Data by MAPOG interface. Use the search layer option to locate “Animal Hospitals Data” data. Users can check whether the dataset is formatted as points, polygons, or lines, depending on their mapping needs.
The “Try AI” feature, located in the upper left corner, streamlines the data search process. Simply enter “Animal Hospitals Data” along with the preferred location, and the AI tool will generate relevant datasets within seconds.
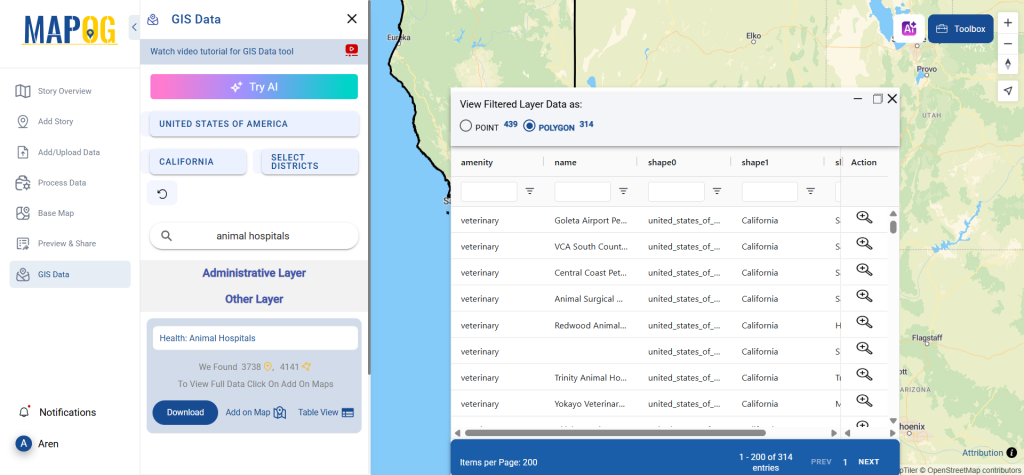
Step 3: Apply Filters for Precision
Refine your search by filtering data based on state, district, or city. This feature ensures users get detailed and location-specific data, making GIS mapping more precise and relevant.
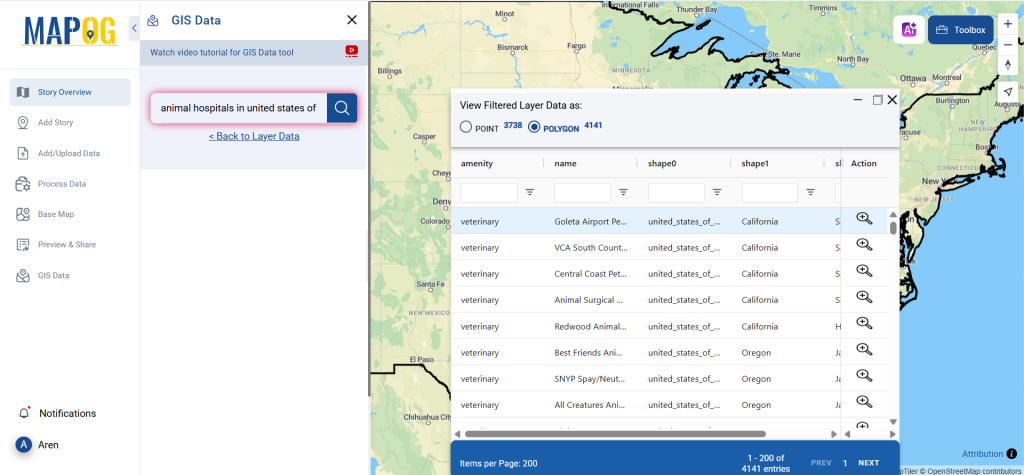
Step 4: Visualize Data on a Map
The “Add on Map” feature lets users overlay Animal Hospitals Data onto a live GIS map. This helps analyze spatial relationships and trends, making the data more actionable.
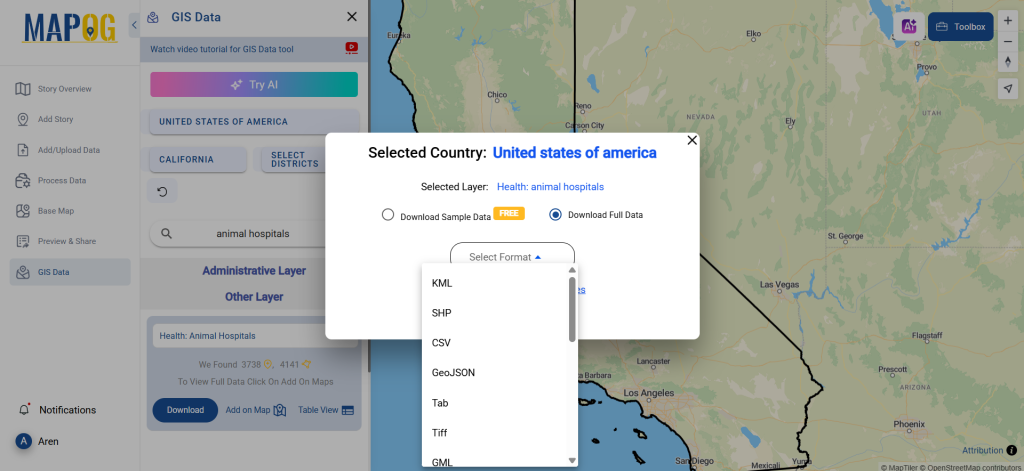
Step 5: Download Data in Your Preferred Format
Click the “Download Data” button and select from over 15+ GIS formats, including Shapefile, KML, GeoJSON, MID, and more. Choose between a sample dataset or the full version, agree to the terms, and initiate the download.
Final Thoughts
Download Animal Hospitals Data effortlessly with GIS Data by MAPOG. Whether for urban planning, veterinary services, or research, this platform provides high-quality GIS datasets in multiple formats. Start mapping animal healthcare services today and enhance your spatial analysis with accurate and reliable GIS data.
Disclaimer : The GIS data provided for download in this article was initially sourced from OpenStreetMap (OSM) and further modified to enhance its usability. Please note that the original data is licensed under the Open Database License (ODbL) by the OpenStreetMap contributors. While modifications have been made to improve the data, any use, redistribution, or modification of this data must comply with the ODbL license terms. For more information on the ODbL, please visit OpenStreetMap’s License Page.
The rise of electric vehicles (EVs) has increased the need for accurate mapping of charging stations. To facilitate location-based analysis, GIS Data by MAPOG allows users to download Electric Vehicle Charging Station data in multiple formats, including Shapefile, KML, MID, and 15+ GIS formats. The platform offers a seamless experience, making it easier to obtain high-quality spatial data for mapping, planning, and analysis.
Simplified Access to EV Charging Station Data
GIS Data by MAPOG provides a user-friendly interface to download EV charging station data efficiently. With a wide range of administrative and geographic datasets, users can explore and analyze charging station locations worldwide. The platform supports multiple GIS data formats, ensuring compatibility with leading mapping tools.
All data is provided in GCS datum EPSG:4326 WGS84 CRS (Coordinate Reference System).
Users need to log in to access and download their preferred data formats.
Step-by-Step Guide to Download Electric Vehicle Charging Station Data
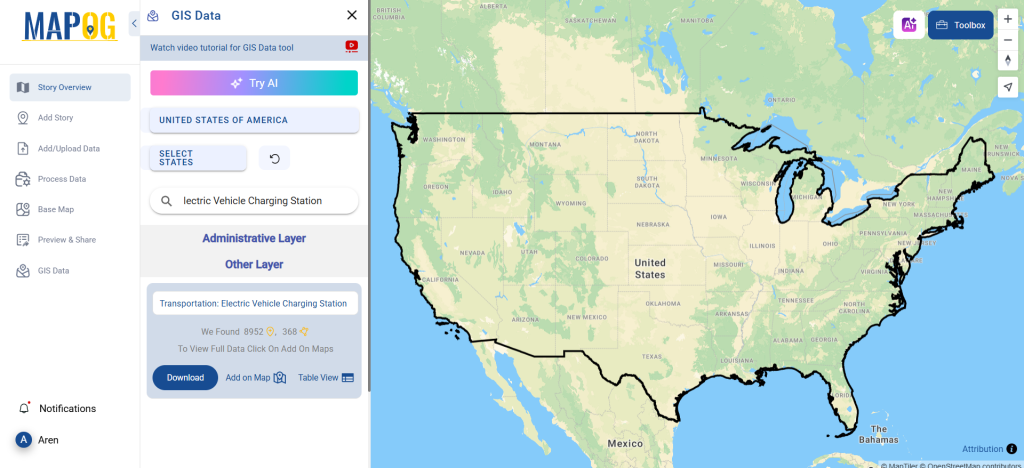
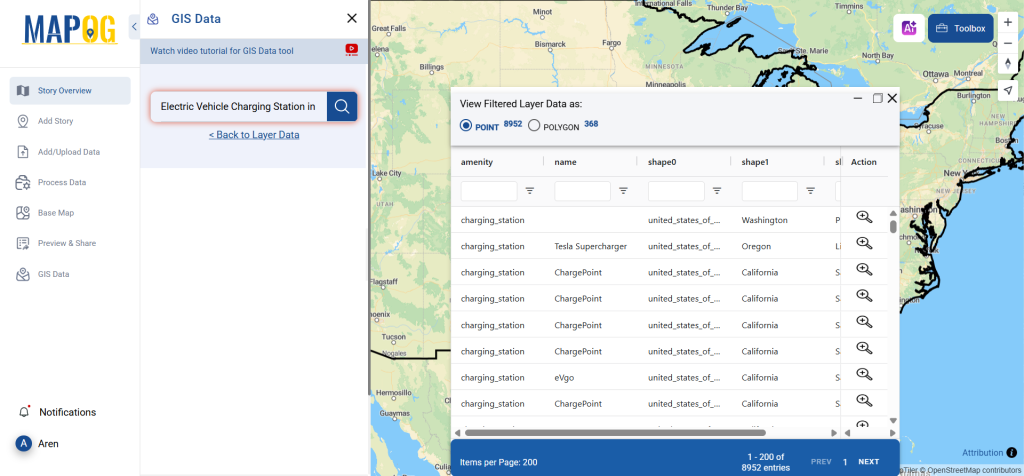
Step 1: Search for ‘Electric Vehicle Charging Station Data’
Start by selecting the country of interest within the GIS Data interface. Use the search layer feature to locate Electric Vehicle Charging Station Data. Review details such as whether the dataset is formatted as a point or polygon, ensuring it aligns with your analysis needs.
Enhance your search experience using the “Try AI” tool, positioned in the upper left corner. Simply enter your data requirement and location, and the AI will retrieve the most relevant Electric Vehicle Charging Station Data, saving time and improving search accuracy.
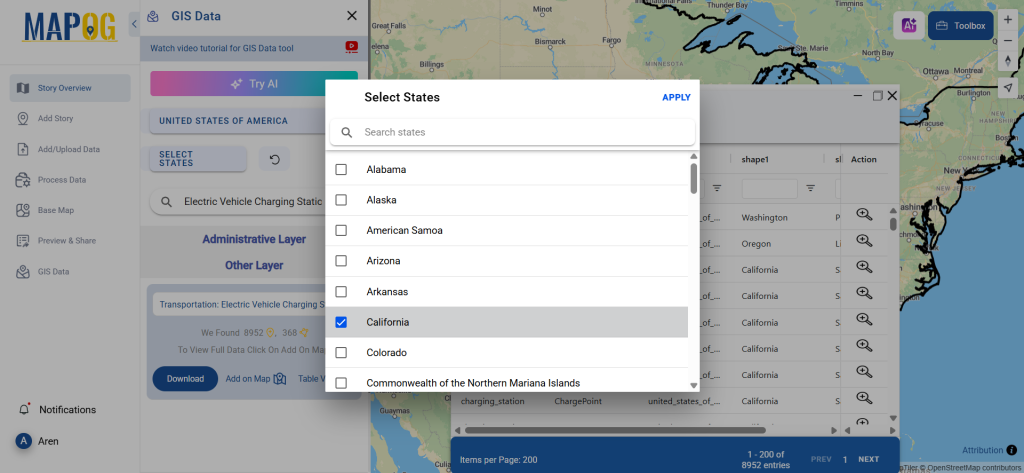
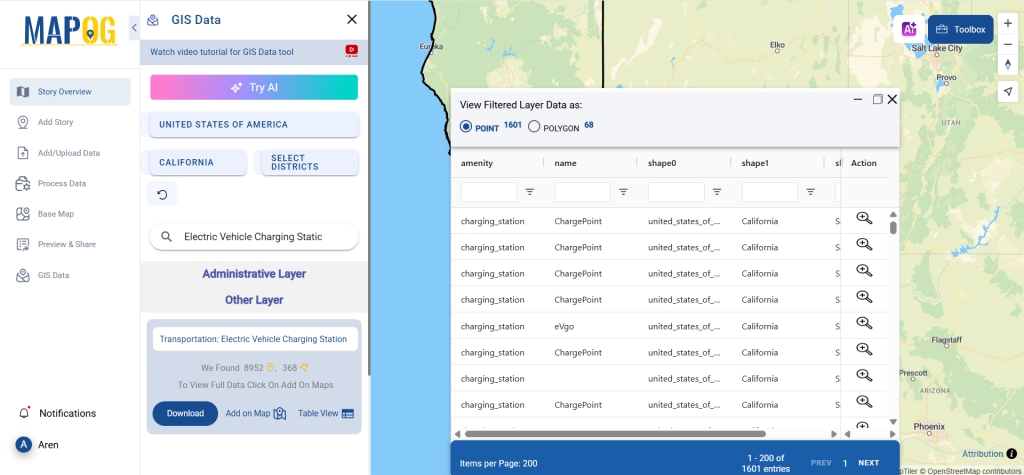
Step 3: Filter Data for Precise Insights
Utilize the filter feature to narrow down datasets by state, district, or city, refining your search for more granular and relevant results. This is particularly beneficial for urban planners and businesses seeking charging infrastructure details for specific regions.
Step 4: Add Data to the Map
Integrate Electric Vehicle Charging Station Data into your GIS project using the “Add on Map” function. This visualization feature enables users to overlay data, analyze spatial relationships, and gain deeper insights into charging station distribution and accessibility.
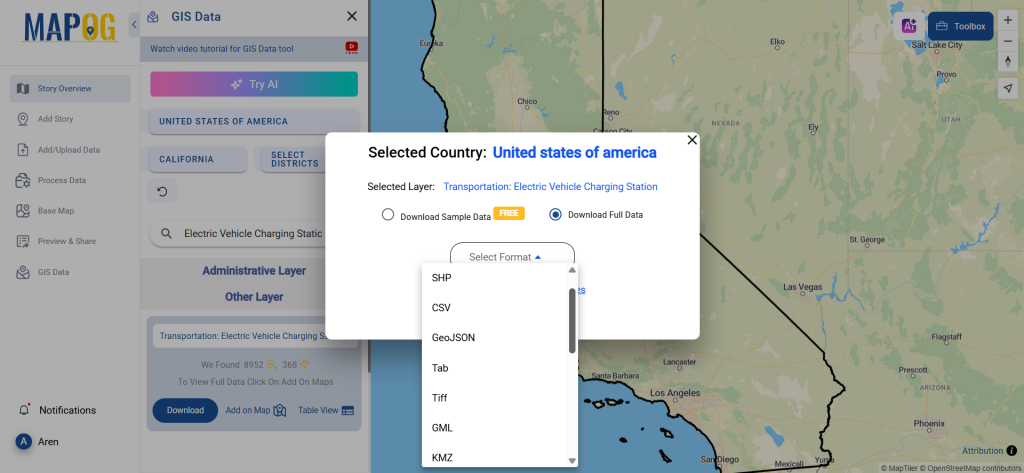
Step 5: Download Data in Multiple GIS Formats
Click the “Download Data” button to access the dataset. Choose between downloading a sample file or the full dataset, depending on project requirements. Select the preferred format from Shapefile, KML, MID, GeoJSON, and 15+ supported formats. Agree to the terms and conditions, then confirm the download to complete the process.
Disclaimer : The GIS data provided for download in this article was initially sourced from OpenStreetMap (OSM) and further modified to enhance its usability. Please note that the original data is licensed under the Open Database License (ODbL) by the OpenStreetMap contributors. While modifications have been made to improve the data, any use, redistribution, or modification of this data must comply with the ODbL license terms. For more information on the ODbL, please visit OpenStreetMap’s License Page.
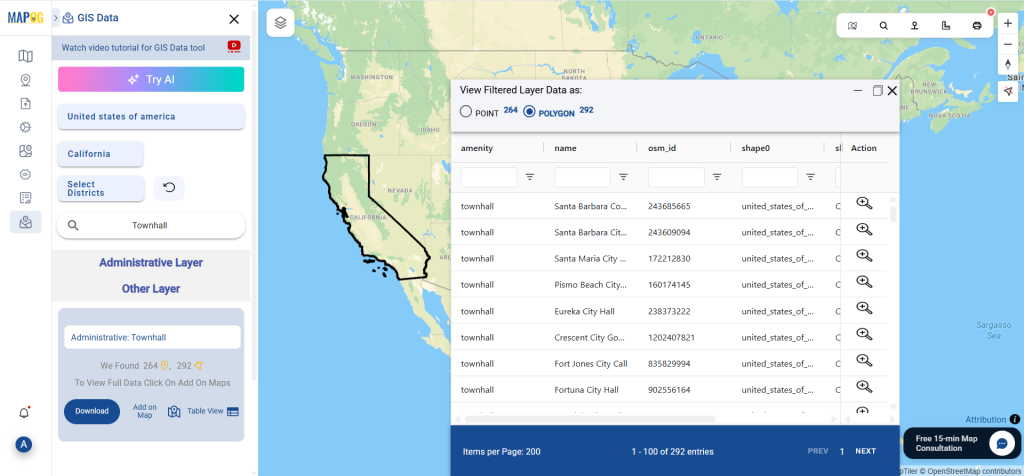
Need accurate and structured data for administrative infrastructure? Download Townhall Data easily using GIS Data by MAPOG — a robust platform designed to support urban planning, governance, and civic infrastructure analysis. Townhalls, as administrative buildings for local governments, play a crucial role in managing civic services, hosting council meetings, and engaging with citizens. With MAPOG, accessing geospatial datasets of townhall locations becomes smooth, reliable, and highly customizable, thanks to its support for over 15 GIS formats including Shapefile, KML, GeoJSON, and MID.
Why Use MAPOG to Download Townhall Data?
GIS Data by MAPOG is built to simplify geospatial data collection. It caters to planners, researchers, civic authorities, and GIS professionals by offering downloadable datasets that align with various GIS software. Whether you’re working on a local governance project, spatial urban study, or service accessibility model, you can download Townhall Data from MAPOG in your preferred format with ease.
All data is provided in GCS datum EPSG:4326 WGS84 CRS (Coordinate Reference System).
Users need to log in to access and download their preferred data formats.
Step-by-Step Guide to Download Townhall Data
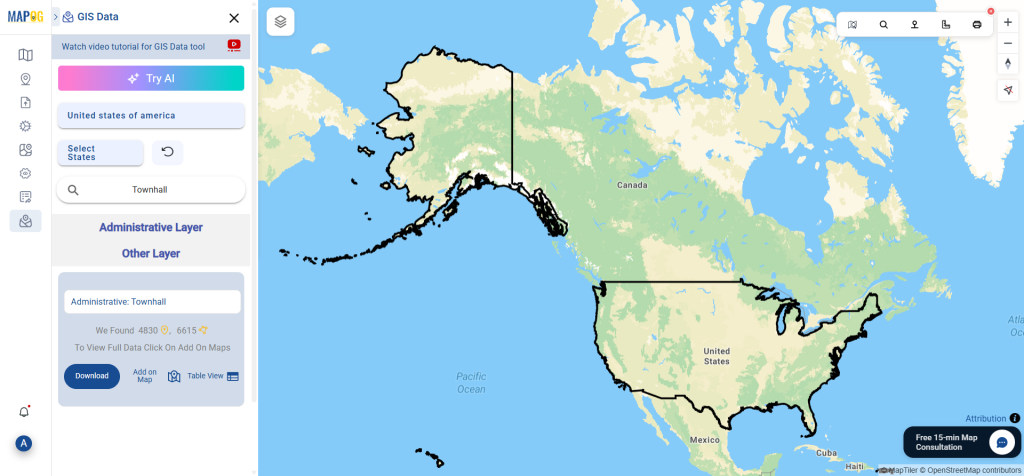
Step 1: Search for Townhall Data
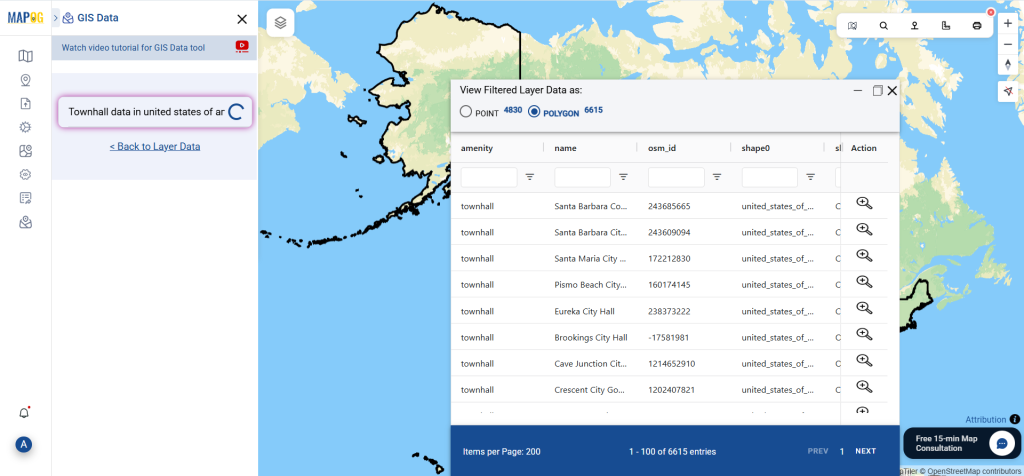
To get started, navigate to GIS Data by MAPOG and use the search feature to locate “Townhall Data.” Each layer comes with rich metadata — you can quickly identify if the data is in point, polygon, or multipoint format based on the available attributes.
Not sure where to look? MAPOG offers an AI-assisted search feature called “Try AI.” Just type queries like “Townhall locations” or “Townhall data for selected area” and let the AI engine retrieve the most relevant datasets. This reduces search time and increases accuracy in dataset discovery.
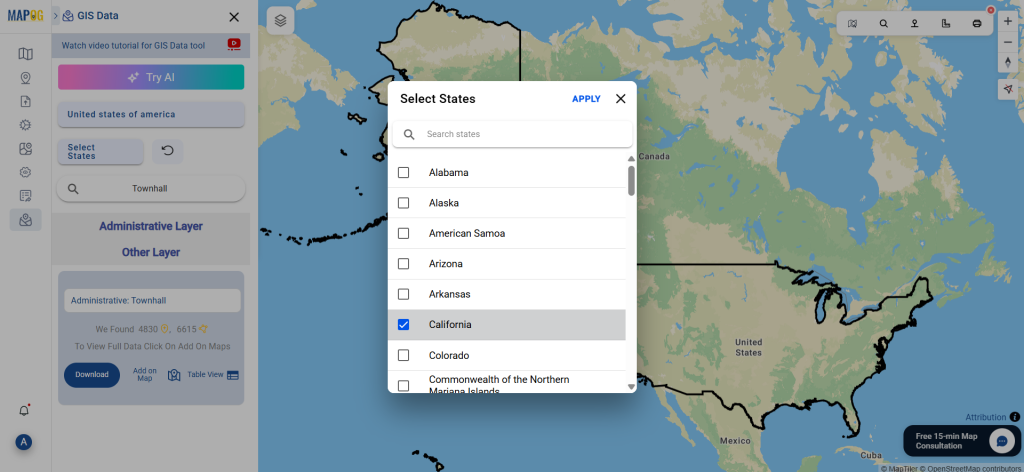
Step 3: Filter by Region
The Filter Data option helps users refine their search further. You can narrow datasets down by selecting specific states, districts, or city levels. For instance, if the main dataset covers an entire country or region, this tool allows you to extract more localized information relevant to your analysis.
Step 4: Visualize Using “Add on Map”
The “Add on Map” button lets you overlay selected townhall datasets directly on the GIS interface. This helps you visualize their geographic distribution and spatial relationships instantly. It’s a crucial step for those who want to examine patterns, density, or service coverage zones before downloading the files.
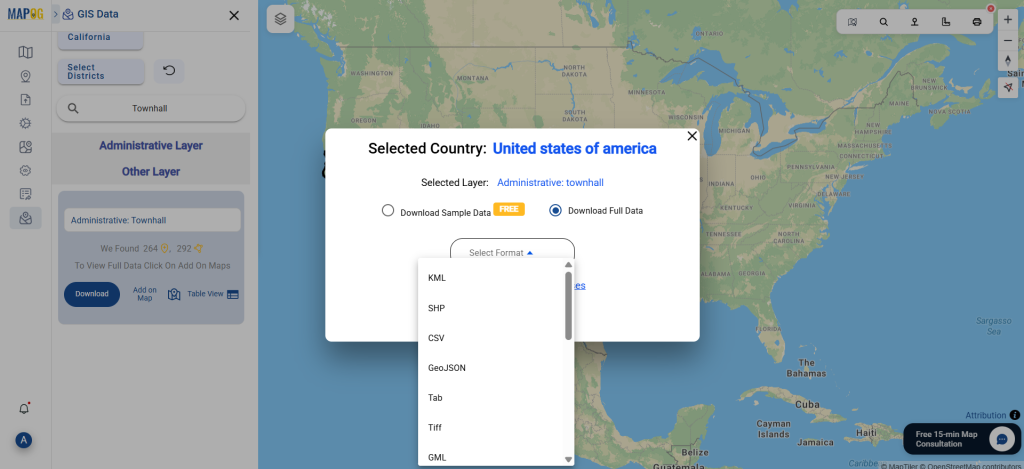
Step 5: Download Townhall Data
Once the appropriate dataset is selected and verified on the map, proceed to download. You can choose between a sample version or full dataset. Then, pick the file format you need — such as Shapefile, KML, GeoJSON, MID, or others — agree to the usage terms, and download with a single click. The files are instantly ready for integration into your GIS workflow.
Final Thoughts
Whether you’re an urban planner, public policy researcher, GIS analyst, or a civic tech innovator, having access to structured, multi-format administrative location data is vital. Thanks to GIS Data by MAPOG, the process to download Townhall Data is both accessible and intuitive. Its smart search tools, data filters, and visualization options make it a go-to resource for high-quality, location-based datasets.
Disclaimer : The GIS data provided for download in this article was initially sourced from OpenStreetMap (OSM) and further modified to enhance its usability. Please note that the original data is licensed under the Open Database License (ODbL) by the OpenStreetMap contributors. While modifications have been made to improve the data, any use, redistribution, or modification of this data must comply with the ODbL license terms. For more information on the ODbL, please visit OpenStreetMap’s License Page.
This guide will walk you through a straightforward process to convert SQLITE to MapInfo file using the Converter Tool in MAPOG. Whether you’re just getting started or already familiar with the platform, these step-by-step instructions are designed to be clear, practical, and easy to follow. As you move through each step, you’ll see how simple it is to transform your SQLITE data into MapInfo format efficiently.
Key Concept to Converting Files:
To begin with, the Converter Tool in MAPOG acts as a powerful utility that allows you to seamlessly switch between data formats. Instead of manually handling complex file types, you just upload your file and let the tool take over. It quickly processes your input, delivering the converted output tailored for your geospatial analysis. Moreover, GIS Data can be downloaded in various formats, offering flexibility for a wide range of applications.
Navigate to “Process Data” and select the “Converter Tool” option.
2. Upload your SQLITE file, that needs conversion.
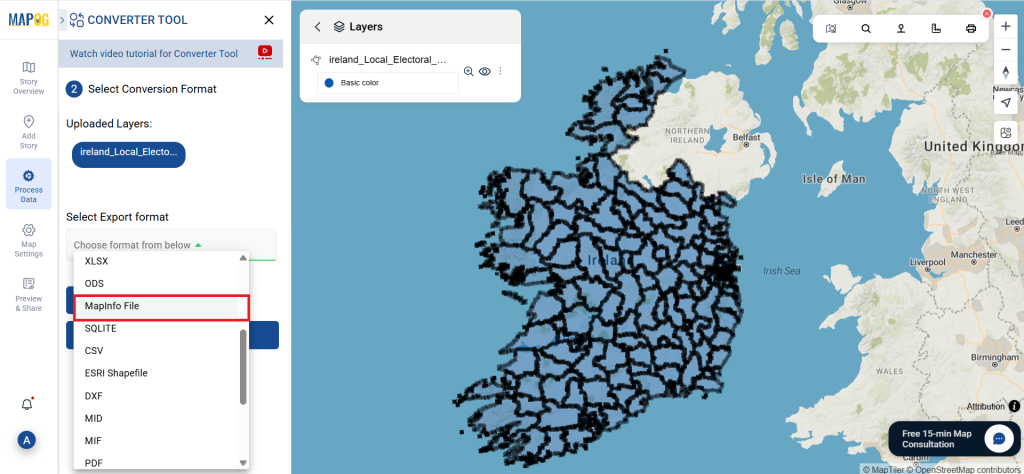
Step 2: Choose the Conversion Format:
Furthermore, MAPOG offers flexibility by allowing GIS data downloads in multiple formats. So, depending on your project requirements, you can choose the one that fits best. In this case, pick MapInfo File as your output format if your goal is to export only the core data.
You can also set the Output CRS as per your spatial analysis.
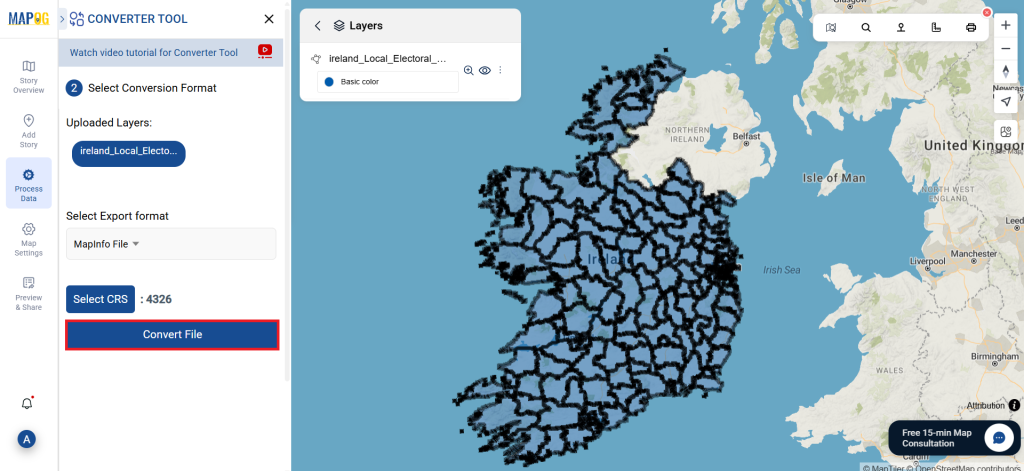
Step 3: Execute the Conversion:
Head over to ‘Convert Files’ and let the tool do its magic. Simply input your data, and the Converter Tool will transform it from SQLITE format toMapinfo File format.
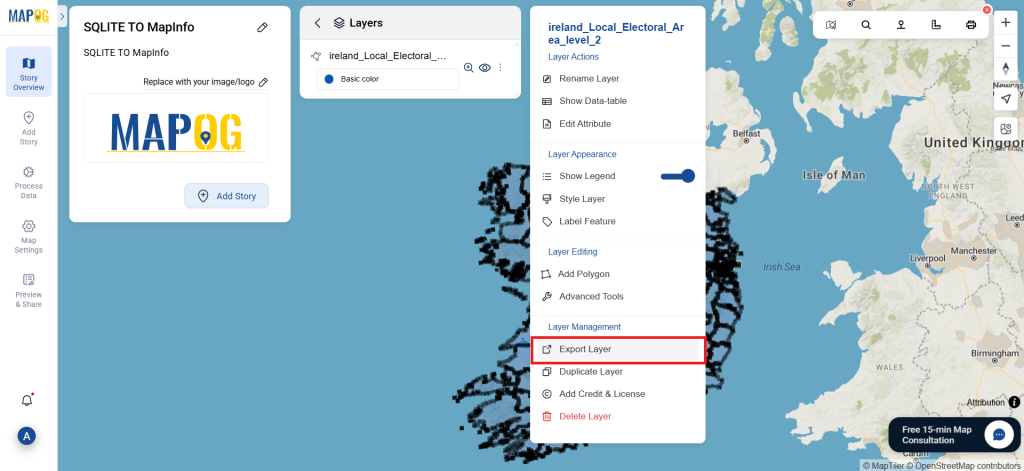
Step 4: Review and Download:
Carefully check your converted Mapinfo data to ensure accuracy. Once you’re satisfied with the results, proceed to download the file. This step is crucial to confirm that the conversion was successful and that all your data has been preserved.
We use cookies to ensure that we give you the best experience on our website. If you continue to use this site we will assume that you are happy with it.