Download Finland Administrative Boundary Shapefiles – Regional State Administrative Agencies, Municipalities and more

Great news for all GIS admirers. IGISMAP have recently published with GIS data collection for more than 100 new countries. Links for downloading the shapefiles of the important administrative divisions of Finland are provided in the following. You can also download these data in KML, GeoJSON or CSV formats. 

Note:

  • All data available are in GCS datum EPSG:4326 WGS84 CRS (Coordinate Reference System).
  • You need to login for downloading the shapefile.

Download Free Shapefile Data of Finland

Finland, officially the Republic of Finland, is a Nordic country in Northern Europe. It borders Sweden to the northwest, Norway to the north, and Russia to the east, with the Gulf of Bothnia to the west and the Gulf of Finland to the south, across from Estonia. Finland covers an area of 338,455 square kilometres (130,678 sq mi) with a population of 5.6 million. Helsinki is the capital and largest city. The vast majority of the population are ethnic Finns. Finnish and Swedish are the official languages, Swedish is the native language of 5.2% of the population. Finland’s climate varies from humid continental in the south to the boreal in the north. The land cover is primarily a boreal forest biome, with more than 180,000 recorded lakes.
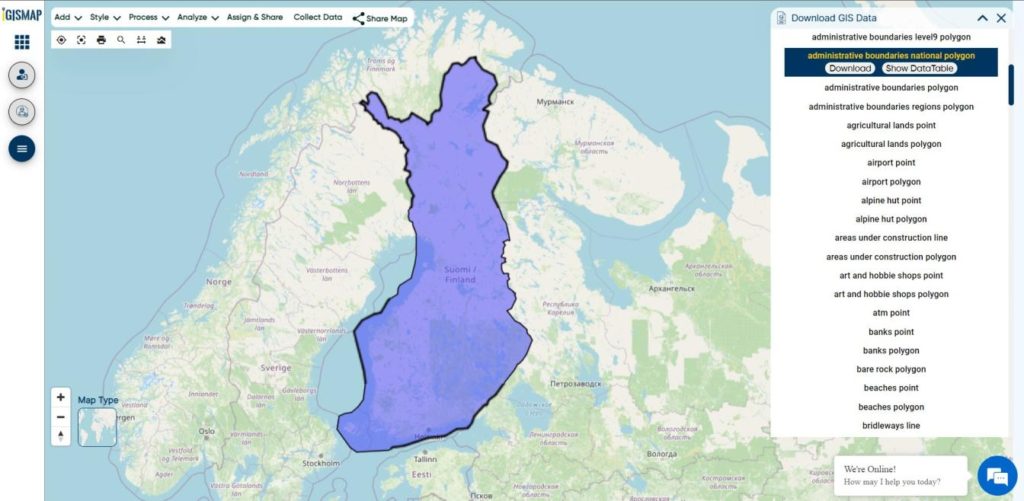
Finland GIS Data - National Boundary
Finland National Boundary

Download Finland National Boundary Shapefile

Download Finland Regional State Administrative Agencies Shapefile Data

The Regional State Administrative Agencies are a set of top-level regional organs of the state of Finland, mainly in charge of basic public services and legal permits. Six agencies took over some of the tasks of the earlier provinces of Finland, which were abolished at the end of 2009. A seventh agency in the autonomous area Åland is named the State Department of Åland.

The agencies themselves do not constitute a subdivision of Finland instead, the first-level subdivisions are the regions of Finland. The other important set of top-level regional state agencies are the Centres for Economic Development, Transport and the Environment

Finland Regional State Administrative Agency Boundaries

Download Finland Region Boundaries Shapefile

This shapefile covers following administrative agencies listed below:

  • Regional State Administrative Agency for Southern Finland
  • Regional State Administrative Agency for Southwestern Finland
  • Regional State Administrative Agency for Western and Inland Finland
  • Regional State Administrative Agency for Eastern Finland
  • Regional State Administrative Agency for Northern Finland
  • Regional State Administrative Agency for Lapland
  • State Department of Åland

Download Finland Regions Shapefile Data

Finland is divided into 19 regions. The regions are governed by regional councils that serve as forums of cooperation for the municipalities of each region. The councils are composed of delegates from the municipal councils. The main tasks of regional councils are regional planning, the development of enterprises, and education. Between 2004 and 2012, the regional council of Kainuu was elected via popular elections as part of an experimental regional administration.

Finland Region Boundaries

Download Finland Region Boundaries Shapefile

This shapefile covers following regions of Finland listed below:

  • Lapland
  • North Ostrobothnia
  • Kainuu
  • North Karelia
  • North Savo
  • South Savo
  • South Karelia
  • Central Finland
  • South Ostrobothnia
  • Ostrobothnia
  • Central Ostrobothnia
  • Pirkanmaa
  • Satakunta
  • Päijät-Häme
  • Kanta-Häme
  • Kymenlaakso
  • Uusimaa
  • Southwest Finland
  • Åland

Download Finland Municipalities Shapefile Data

The municipalities represent the local level of administration in Finland and act as the fundamental, self-governing administrative units of the country. The entire country is incorporated into municipalities and legally, all municipalities are equal, although certain municipalities are called cities or towns. Municipalities have the right to levy a flat percentual income tax, which is between 16 and 22 percent, and they provide two thirds of public services. Municipalities control many community services, such as schools, health care and the water supply, and local streets. They do not maintain highways, set laws or keep police forces, which are responsibilities of the central government.

Finland Municipality Boundaries

Download Finland Municipality Boundaries Shapefile

Other Administrative Boundary Data:

Download Free Shapefile for the following:

  1. World Country Shapefile
  2.  Australia Shapefile download
  3. Argentina
  4. Brazil
  5. Download Shapefile of Canada
  6. Denmark
  7. Germany
  8. India
  9. Indonesia
  10. Japan
  11. Kenya
  12. Lebanon
  13. Madagascar
  14. Malaysia Shapefile
  15. Mexico Shapefile
  16. Mongolia
  17. New Zealand
  18. Nigeria
  19. Papua New Guinea
  20. Philippines
  21. Poland
  22. Singapore
  23. South Africa Province Shapefile
  24. South Korea
  25. Tunisia
  26. United Kingdom Shapefile
  27. Download Shapefile of United States of America
  28. Vietnam

Disclaimer : If you find any shapefile data of country provided is incorrect do contact us or comment below, so that we will correct the same in our system as well we will try to correct the same in openstreetmap.

Map the locations of slums and embed the map on your website

On one fine day, people from a well reputed Non-Governmental Organization (NGO) contacted us about how we can locate slum areas. This NGO works for social welfare activities such as food, clothes, water supply, drainage, etc. for the people who live in slums. They basically wanted a web map for slum locations where they can provide the above social services and keep track of various details to those locations through visualization and spatial analysis.

The use of GIS technology is advancing in the field of data science and information technology as demand for maps and geospatial analysis became important in both public and private sectors. There is limited GIS software that provides services in both creating maps and hosting them on websites. IGISMap gives powerful tool sets to create interactive maps of locations and geospatial features associated with applications based on social services, business analysis, scientific research etc. Using the tools of IGISMap, we can manage, analyze, and visualize slum areas where monitoring and management is required. IGISMap is a web platform providing multiple GIS applications that are most important in the field of geospatial analytics. GIS tools of IGISMap application allows users to Add Data, Create Data, Map Data, Style Data, Process Data, Analyze Data and also help users to Share Data privately or publicly.

IGISMap application has Create Point Data tool which can be used to plot locations and point objects as point vector data model. By using the Create Point Data tool let’s discuss how we can map the slum locations like the following.

Final Map of Slum Locations

Click https://map.igismap.com/add-points to open Create Point Data tool

Start plotting points for the slum locations

In Create Point Data tool, first step is to Add Points, where we can start plotting the slum locations as points, in the form of pins. IGISMap provides you with three features for plotting points: Drop Points, Search Address, and Lat Lon Values.

Create Point Data tool
  • Drop points let us drop a pin at the desired location on the map. Zoom to the location of the slum and click to add the pin.
Drop Points
  • Search Address option opens a search address box, where you can enter an address and choose the right option from the dropdown list, then click the Plot button to plot a point on that location.
Seach Address and Plot Points
  • Lat Lon Values will open two boxes to enter latitude and longitude values of the location you want to plot, Plot Location button in this option will plot a pin at the location you have entered.
Enter Coordinates and Plot Points

Add Attributes popup will appear every time you plot a point. Using this popup, you can add the attribute fields and values. Click the Submit button to Submit the save the attribute entries. You can choose to delete the point you plotted by clicking the Delete Point button. You can disable this popup anytime using the following toggle button.

But we can open this popup anytime while plotting, by simply clicking on an existing pin.

After plotting every desired location for our data, click the Save and Publish button to publish your data in the map.

Review and edit the datatable

After the slum locations are published as point GIS layer, Show/Edit Datatable section will be open. Here you can edit the attribute values entered for each point location after clicking the button in the data table along each row in the data table. You can also choose to delete a point by clickingbutton.

Show/Edit Datatable

Options to edit or delete the attribute fields are also available in this step along with the option to add new attribute fields to this data. If you thought of adding more points to the data of ATM Locations, select the Back button to go to the Add Points section, where you can add more points and make changes to the already published data.

Option to update the data table as bulk is available in this section. Where the whole data table can be downloaded in Excel format using Download Datatable button. And to make the changes outside IGISMap, then upload the edited/updated spreadsheet file using Upload Datatable button and integrate with the same point data of ATM locations. 

After making all the changes in the datatable, let’s move to the styling section by clicking the Next button to finish plotting.

Plotting of Slum Locations Completed

Styling the slum location points

A map will become more meaningful if appropriate icons and colors are used to visualize the spatial features of the map. In IGISMap styling options, Bubble Style and Icon Style are provided for point GIS data.

In Icon Styling, IGISMap provides two more options – Basic and Category styling. For now, let’s make it simple by providing an appropriate pin icon for styling the Slum location points.

After opening Icon Style tool from the Done section or from the Map Tools, select the data from the dropdown and click Next

Styling with Proper Icons

Basic Icon will be selected as default. Select appropriate icon from the list and click Save Style to apply icon for the points.

Select Icon

Another styling option using Icon Style tool is the Categorial Icon, where users can select the category on the basis of which styling is added to the point data.

Check this article to understand How to style point GIS data categorically using Icon Style tool.

Bubble style is used to visualize the data quantitatively based on the numerical fields in the datatable. We can assign the size and color of the bubble for each class of values.

Check this article understand How to create Bubble Map for point GIS data.

Click on Save Style option to save the Styling options of added points.

It’s done! Now if the user wants to add more points, click on Create more points on the layer option, which will then direct you back to the Add Points section.

Add Points

If the user wants to create a new layer, select Create New Layer option.

Embed your slum locations map in a website

As the data is created completely and styles appropriately, let’s embed the map of Slums in a website. For this, click the button at the top right, where you will reach the UI to control the sharing of this map.

Share Map

After the share map components are enabled and disabled as desired, click Next button to proceed to the step for copying the iframe link to embed in a website.

Embed Map
Iframe link

Copy this link from the popup and attach it to your website. Thus the map will be available as interactive as below.

Check the article Share your Map to understand more about Share Map feature of IGISMap.

Check other articles:
Check the following IGISMap tools:

Map habitat locations of endangered animals & keep track of their living

Wilderness without wildlife is just scenery
-Lois Crisler

The International Union for Conservation of Nature (IUCN) states that endangered species are the species of plant or animal that are seriously at the risk of extinction. In this time of data revolution, data analytics plays a huge role in the field of environmental science and atmospheric studies. Keeping the record of the habitat locations of endangered species and observing the variations in their environmental factors will help the authorities to study the causes that threaten the life of these species. These observations can be further useful to prevent global extinction by rehabilitating their populations and restoring habitats. In the article we create point vector data in GIS tool.

GIS technology is an effective tool for managing, analyzing, and visualizing wildlife data to target areas where monitoring and managing is required. GIS technology helps in tracking the migration patterns, mapping biodiversity, and habitat suitability models which provide analysis for animals to locate their habitat locations in suitable environmental conditions. 

Consider that a wildlife conservationist wants to map the habitat locations of endangered animals in India and keep track of the factors such as total strength, temperature, precipitation, food, water, etc. There are a lot of GIS applications available, but only IGISMap meets the requirements creating a map and hosting the map. Create Point Data tool of IGISMap can be used to plot locations and point objects as a point vector data model.

Map habitat locations of endangered species

Users can rely on the Create Point Data tool of IGISMap application to plot the habitat locations of endangered animals as given below.

Final Map of Habitat Locations

GIS data created in IGISMap can be shared via links or embed in websites. More information based on these locations can be added as attributes in the datatable. Attribute information in the datatable can be queried using the Proximity Analysis tool of IGISMap. Let’s look into the steps on how the habitat location map can be created and further used for the protection of endangered animals.

To navigate to the IGISMap Create Point Data tool, click the below link

https://map.igismap.com/add-points

Adding the points of habitat locations of endangered animals

First step is to Add Points, where we can start plotting the habitat locations as points, in the form of pins. IGISMap provides you with three features for plotting points: Drop Points, Search Address, and Lat Lon Values.

Create Point Data tool
  • Let’s select the Drop Points option and zoom to the location with the desired location to plot a pin in that specific location on the map
Drop Points

Everytime when a point gets plotted, a popup will open to enter the attribute values in each attribute field of the habitat locations. Click the Submit button to Submit and save the attribute entries. You can choose to delete the point you plotted by clicking the Delete Point button. Else you can click Skip to close the popup. You can disable the default opening of this popup using the toggle button.

  • Search Address option opens a search address box, where you can enter an address and choose the right option from the dropdown list, then click the Plot button to plot a point on that location.
  • Lat Lon Values will open two boxes to enter latitude and longitude values of the location you want to plot, Plot Location button in this option will plot a pin at the location you have entered.

A plotted point can be moved to a different location by click and drag to the desired location

Note: If the Drop Points option is active for dropping pins, it should be unselected for selecting the plotted pins to open the attribute popup.

After making all the changes, click on the Save and Publish button to publish the GIS data of habitat locations.

Review and Edit the Datatable of the Data

Save and Publish button will publish the point location of endangered animals as point GIS data layer. The default name of the published layer will be point1 that can be edited any time. Show/Edit Datatable section will also open, where attribute fields and attribute values of each location can be edited, updated or deleted.

Option to update the data table as bulk is available in this section. Here the whole datatable can be downloaded in Excel format using Download Datatable button. And to make the changes outside IGISMap, then upload the edited/updated spreadsheet file using Upload Datatable button. Further, integrate with the same point data of habitat locations.

Show/Edit Datatable

Here the Back button is present for going back to the Add Points section to add more points or click Next option to proceed further.

Styling The Habitat Location Points Of Endangered Species

A map will become more meaningful if appropriate icons and colors are used to visualize the features of the map. IGISMap provides – Bubble Style and Icon Style for point GIS data. Icon Styling has two more options – Basic Icon and Category Icon styling.

In basic styling, users can use different styling options for the pin. In Basic Icon styling, user can select any of the icons to represent the point locations.

Basic Icon Styling

Check this article to understand How to style point GIS data categorically using Icon Style tool

Here we are going to style our data using Bubble Style. Bubble style is used to visualize the data quantitatively based on the numerical fields in the datatable. We can assign the size and color of the bubble for each class of values.

Bubble Styling

Check this article understand How to create Bubble Map for point GIS data

IGISMap provides direct access to Icon Style and Bubble Style tools from an existing map, where you can style point GIS data published in that map

It’s done! Now if the user wants to add more points, click on Create more points on the layer option. If the user wants to create a new layer, select Create New Layer option.

Add Points feature is available in the More section of the layer which will allow to add more points and attribute informations to the data you created.

More options

Embedding Map In Your Website

Now lets embed the map of habitat location in a website. For this, click the button at the top right, where you will reach the UI to control the sharing of this map.

Share Map

Enable and provide the necessary components of the Share Map and click Next button. Now select the Embed Map option and click Embed Map button.

Embed Map

A popup appears with html iframe code

HTML Iframe Link

Copy this link from the popup and attach it to your website. Check the article Share your Map to understand more about Share Map feature of IGISMap.

Check similar articles:
Check the following IGISMap tools:

Plot ATM locations on a map and embed on your website

Consider that you are an engineer working for the technical support team in a bank. And you were asked to host a web map of the ATM locations under your branch. This same map should be later available to dynamically visualize the transactions associated with each ATM in a quantitative representation. In this article, you will learn how to plot atm/shop locations on map and embed it on your website.

There are limited GIS software and online tools where you can do this job. Most of them are limited to any single service, ie., either creating a map and hosting the map on a website, but IGISMap allows you to do both. IGISMap is a GIS based web platform providing multiple GIS applications that are most important in the field of geospatial analytics. The peculiarity of IGISMAP in the GIS Industry is its UI/UX which helps the user to perform effortless geospatial operations. GIS tools of IGISMAP allow you to Add Your Data, Create Your Data, Map Your Data, Style Your Data, Process Your Data, and Analyze Your Data, and additionally, it helps you to share your Data privately or publicly.

How to Plot ATM/shop locations on map

Create Point Data tool of IGISMap is a powerful GIS tool to plot point vector data to represent locations and point objects with single latitude and longitude values. Using Create Point Data tool, we can create an interactive map of ATM locations like the following.

Map of ATM Locations

Lets walk through each step of the Create Point Data tool to create a map like this and share with your team.

  • First, you need to log in to IGISMap from https://map.igismap.com/. If you haven’t signed up for IGISMap, click the Sign Up button to create an IGISMap account.
  • After Logging In, you will be directed to the dashboard of your IGISMap account.
  • From the dashboard, click on the Create Point Data tab to open the tool as shown below.
Create Point Data tool

Start Plotting Points for the ATM Locations

First step is Add Points, where we can start plotting the ATM locations as points, in the form of pins. IGISMap provides you with three features for plotting points: Drop Points, Search Address, and Lat Lon Values.

  • Let’s select the Drop Points option and zoom to the location with the desired ATM Machine to plot a pin in that specific location on the map
Add Points – Drop Points
  • Search Address option opens a search address box, where you can enter an address and choose the right option from the dropdown list, then click the Plot button to plot a point on that location.
  • Lat Lon Values will open two boxes to enter latitude and longitude values of the location you want to plot, Plot Location button in this option will plot a pin at the location you have entered.

Also, a popup will open for entering attribute values in each attribute field for that atm location when a point is plotting. Click the Submit button to Submit the save the attribute entries. You can choose to delete the point you plotted by clicking the Delete Point button. You can disable the default opening of this popup using the toggle button.

But we can open this popup anytime while plotting, by simply clicking on an existing pin.

Note: If the Drop Points option is active for dropping pins, it should be unselected for selecting the plotted pins to open the attribute popup.

After plotting every desired ATM location for our data, click the Save and Publish button to publish your data in the map.

Review and Edit the Datatable

After the atm location is published, Show/Edit Datatable section will be open. Here you can edit the attribute values entered for each point location after clicking the button in the data table along each row in the data table. You can also choose to delete a point by clickingbutton.

Datatable

Options to edit or delete the attribute fields are also available in this step along with the option to add new attribute fields to this data. If you thought of adding more points to the data of ATM Locations, select the Back button to go to the Add Points section, where you can add more points and make changes to the already published data.

Option to update the data table as bulk is available in this section. Where the whole data table can be downloaded in Excel format using Download Datatable button. And to make the changes outside IGISMap, then upload the edited/updated spreadsheet file using Upload Datatable button and integrate with the same point data of ATM locations. 

After making all the changes in the datatable, let’s move to the styling section by clicking the Next button to finish plotting.

Style Your ATM Location Points

A map will become more meaningful if appropriate icons and colors are used to visualize the features of the map. In IGISMap styling options, Bubble Style and Icon Style are provided for point GIS data.

Check this article understand How to create Bubble Map for point GIS data.

Here we are going to style our data using Icon Style. In Icon Styling, IGISMap provides two more options – Basic and Category styling. For now, let’s make it simple by providing an appropriate pin icon for styling the ATM location points. And apply it on the ATM Locations data as follows.

Check this article to understand How to style point GIS data categorically using Icon Style tool.

Edit Style

IGISMap provides direct access to Icon Style and Bubble Style tools from an existing map, where you can style point GIS data published in that map

Embed Your ATM Locations Map in a Website

As the data is created completely and styled appropriately, let’s embed the map of ATM Locations in a website. For this, click the button at the top right, where you will reach the UI to control the sharing of this map.

Share Map

Once the components are enabled and disabled as desired. After that click the Next button to proceed to the step of copying the iframe link to embed in a website.

Share Map – Embed Map
Link to Embed Map

Copy the HTML code link and embed it on your website. Thus the map will be available as interactive as below.

Afterward merge the data table of the ATM Locations with the transaction data of each ATMs. Furthermore, for quantitative visualization, we can use Bubble Style. The style will apply automatically to your website. So with the following steps, you can plot atm/shop locations on a map and embed them on your website.

Article Share your Map will help you understand more about Share Map feature of IGISMap.

Other articles:
Check the following IGISMap tools:

Download Switzerland Administrative Boundary Shapefiles – Cantons, Districts, Postal Codes and more

Hello GIS enthusiasts, IGISMAP has now published the latest GIS vector data of Switzerland administrative levels. Links for downloading the shapefiles of the important administrative divisions of Switzerland are provided in the following. You can also download these data in KML, GeoJSON or CSV formats.

Note:

  • All data available are in GCS datum EPSG:4326 WGS84 CRS (Coordinate Reference System).
  • You need to login for downloading the shapefile.

Download Free Shapefile Data of Switzerland

Switzerland, officially the Swiss Confederation, is a landlocked country at the confluence of Western, Central and Southern Europe. Switzerland is bordered by Italy to the south, France to the west, Germany to the north and Austria and Liechtenstein to the east. It is geographically divided among the Swiss Plateau, the Alps and the Jura, spanning a total area of 41,285 km2 (15,940 sq mi) and land area of 39,997 km2 (15,443 sq mi).

Switzerland National Boundary

Download Switzerland National Outline Boundary Shapefile

If you are looking for any other GIS formats then use GIS File Converter.

Download Switzerland Cantons Shapefile Data

Switzerland being a federal republic composed of 26 cantons. The 26 cantons of Switzerland are the member states of the Swiss Confederation.

Switzerland Canton Boundaries

Download Switzerland Canton Boundaries Shapefile

Download Switzerland Districts Shapefile Data

Districts of Switzerland are a political subdivision for cantons. In the federally constituted Switzerland, each canton is completely free to decide its own internal organization. Following data of Switzerland have 159 district boundaries.

Switzerland District Boundaries

Download Switzerland District Boundaries Shapefile

Download Switzerland Postcode areas Shapefile Data

Switzerland is divided into nine postal districts, numbered from west to east. Each district is subdivided into postal areas. Each area contains a maximum of one hundred units. There are 4116 Postcode in the following data.

Switzerland Postcode Boundaries

Download Switzerland Postcode Boundaries Shapefile

Other Administrative Boundary Data:

For more GIS data visit – IGIS Map GIS Data

For more specific data contact us at support@igismap.com

Download Free Shapefile for the following:

  1. World Countries Shapefile
  2. Australia
  3. Argentina
  4. Austria
  5. Belgium
  6. Brazil
  7. Canada
  8. Denmark
  9. Fiji
  10. Finland
  11. Germany
  12. Greece
  13. India
  14. Indonesia
  15. Ireland
  16. Italy
  17. Japan
  18. Kenya
  19. Lebanon
  20. Madagascar
  21. Malaysia
  22. Mexico
  23. Mongolia
  24. Netherlands
  25. New Zealand
  26. Nigeria
  27. Papua New Guinea
  28. Philippines
  29. Poland
  30. Russia
  31. Singapore
  32. South Africa
  33. South Korea
  34. Spain
  35. Switzerland
  36. Tunisia
  37. United Kingdom Shapefile
  38. United States of America
  39. Vietnam
  40. Croatia
  41. Chile
  42. Norway

Disclaimer : If you find any shapefile data of country provided is in correct do contact us or comment below, so that we will correct the same in our system as well we will try to correct the same in OSM.

Download Ireland Administrative Boundary Shapefiles – Counties, Municipal Districts, Constituencies and more

Hello GIS enthusiasts, IGISMAP has now published the latest GIS vector data of Ireland administrative levels. Links for downloading the shapefiles of the important administrative divisions of Ireland are provided in the following. You can also download these data in KML, GeoJSON or CSV formats.

Note:

  • All data available are in GCS datum EPSG:4326 WGS84 CRS (Coordinate Reference System).
  • You need to login for downloading the shapefile.

Download Free Shapefile Data of Ireland

Ireland also known as the Republic of Ireland is a country in north-western Europe consisting of 26 of the 32 counties of the island of Ireland. The capital and largest city is Dublin, on the eastern side of the island. Around 40% of the country’s population of 5 million people resides in the Greater Dublin Area. The sovereign state shares its only land border with Northern Ireland, which is part of the United Kingdom.

Ireland National Boundary

Download Ireland National Outline Boundary Shapefile

Download Ireland Counties Shapefile Data

The 26 counties of the Republic of Ireland are Carlow, Cavan, Clare, Cork, Donegal, Dublin, Galway, Kerry, Kildare, Kilkenny, Laois, Leitrim, Limerick, Longford, Louth, Mayo, Meath, Monaghan, Offaly, Roscommon, Sligo, Tipperary, Waterford, Westmeath, Wexford and Wicklow.

Ireland County Boundaries

Download Ireland County Boundaries Shapefile

Download Ireland Municipal Districts Shapefile Data

A municipal district is an area of a council area that comprises one or more electoral area. In most cases the electoral area constitutes the municipal district. All counties and cities apart from the local authorities in the areas of Dun Laoghaire, Fingal and South Dublin and the cities of Dublin, Cork and Galway are divided into municipal districts. Councillors represent both the municipal district and the local authority. In total, there are 95 municipal districts in the country.

Ireland Municipal District Boundaries

Download Ireland Municipal District Boundaries Shapefile

Download Ireland Parliamentary Constituencies Shapefile Data

There are 39 multi-member electoral districts, known as Dáil constituencies, that elect 160 TDs (members of parliament), to Dáil Éireann, Ireland’s lower house of the Oireachtas, or parliament, by means of the single transferable vote, to a maximum term of five years.

Ireland Parliamentary Constituency Boundaries

Download Ireland Parliamentary Constituency Boundaries Shapefile

Other Administrative Boundary Data:

Download Free Shapefile for the following:

  1. World Countries Shapefile
  2. Australia
  3. Argentina
  4. Austria
  5. Belgium
  6. Brazil
  7. Canada
  8. Denmark
  9. Fiji
  10. Finland
  11. Germany
  12. Greece
  13. India
  14. Indonesia
  15. Ireland
  16. Italy
  17. Japan
  18. Kenya
  19. Lebanon
  20. Madagascar
  21. Malaysia
  22. Mexico
  23. Mongolia
  24. Netherlands
  25. New Zealand
  26. Nigeria
  27. Papua New Guinea
  28. Philippines
  29. Poland
  30. Russia
  31. Singapore
  32. South Africa
  33. South Korea
  34. Spain
  35. Switzerland
  36. Tunisia
  37. United Kingdom Shapefile
  38. United States of America
  39. Vietnam
  40. Croatia
  41. Chile
  42. Norway

Disclaimer : If you find any shapefile data of country provided is in correct do contact us or comment below, so that we will correct the same in our system as well we will try to correct the same in OSM.

Download Spain Administrative Boundary Shapefiles – Autonomous Communities, Provinces, Municipalities and more

Hello GIS enthusiasts, IGISMAP has now published the latest GIS vector data of Spain administrative levels. Links for downloading the shapefiles of the important administrative divisions of Spain are provided in the following. You can also download these data in KML, GeoJSON or CSV formats.

Note:

  • All data available are in GCS datum EPSG:4326 WGS84 CRS (Coordinate Reference System).
  • You need to login for downloading the shapefile.

Download Free Shapefile Data of Spain

Spain officially known as the Kingdom of Spain is a country in Southwestern Europe with some pockets of territory in the Mediterranean Sea, offshore in the Atlantic Ocean. The country’s mainland is bordered to the south by the British overseas territory of Gibraltar, to the south and east by the Mediterranean Sea to the north by France, Andorra and the Bay of Biscay and to the west by Portugal and the Atlantic Ocean.

Spain National Boundary

Download Spain National Outline Boundary Shapefile

Download Spain Autonomous Communities Shapefile Data

In Spain, an autonomous community is a first level political and administrative division, created in accordance with the Spanish Constitution of 1978, with the aim of guaranteeing limited autonomy of the nationalities and regions that make up Spain. There are 17 autonomous communities and two autonomous cities that are collectively known as autonomies.

  • Andalusia
  • Aragon
  • Asturias
  • Balearic Islands
  • Basque Country
  • Canary Islands
  • Cantabria
  • Castile and León
  • Castilla–La Mancha
  • Catalonia
  • Community of Madrid
  • Extremadura
  • Galicia
  • La Rioja
  • Navarre
  • Region of Murcia
  • Valencian Community
  • Ceuta
  • Melilla
Spain Autonomous Community Boundaries

Download Spain Autonomous Community Boundaries Shapefile

Download Spain Provinces Shapefile Data

Spain and its 17 autonomous communities are subdivided into 50 provinces. Seven of the autonomous communities comprise no more than one province each: Asturias, the Balearic Islands, Cantabria, La Rioja, Madrid, Murcia, and Navarre. These are sometimes referred to as uniprovincial communities.

Spain Province Boundaries

Download Spain Province Boundaries Shapefile

Download Spain Municipalities Shapefile Data

There is a total of 8124 municipalities in Spain, including the autonomous cities of Ceuta and Melilla. Burgos is the province with the most municipalities (371) and Las Palmas the one with the least (34).

Spain Municipality Boundaries

Download Spain Municipality Boundaries Shapefile

Other Administrative Boundary Data:

Download Free Shapefile for the following:

  1. World Countries Shapefile
  2. Australia
  3. Argentina
  4. Austria
  5. Belgium
  6. Brazil
  7. Canada
  8. Denmark
  9. Fiji
  10. Finland
  11. Germany
  12. Greece
  13. India
  14. Indonesia
  15. Ireland
  16. Italy
  17. Japan
  18. Kenya
  19. Lebanon
  20. Madagascar
  21. Malaysia
  22. Mexico
  23. Mongolia
  24. Netherlands
  25. New Zealand
  26. Nigeria
  27. Papua New Guinea
  28. Philippines
  29. Poland
  30. Russia
  31. Singapore
  32. South Africa
  33. South Korea
  34. Spain
  35. Switzerland
  36. Tunisia
  37. United Kingdom Shapefile
  38. United States of America
  39. Vietnam
  40. Croatia
  41. Chile
  42. Norway

Disclaimer : If you find any shapefile data of country provided is in correct do contact us or comment below, so that we will correct the same in our system as well we will try to correct the same in OSM.

Download Greece Administrative Boundary Shapefiles – Regions, Prefectures, Municipalities and more

Hello GIS enthusiasts, IGISMAP has now published the latest GIS vector data of Greece administrative levels. Links for downloading the shapefiles of the important administrative divisions of Greece are provided in the following. You can also download these data in KML, GeoJSON or CSV formats.

Note:

  • All data available are in GCS datum EPSG:4326 WGS84 CRS (Coordinate Reference System).
  • You need to login for downloading the shapefile.

Download Free Shapefile Data of Greece

Greece officially known as the Hellenic Republic, is a country located in Southeastern Europe. Its population is approximately 10.7 million as of 2018. Athens is its largest and capital city, followed by Thessaloniki. Situated on the southern tip of the Balkans, Greece is located at the crossroads of Europe, Asia, and Africa. It shares land borders with Albania to the northwest, North Macedonia and Bulgaria to the north, and Turkey to the northeast.

Greece National Boundary

Download Greece National Outline Boundary Shapefile

Download Greece Region Shapefile Data

Regions are the first level administrative entities of Greece. There are 13 regions each comprising several second-level units known as Regional Units.

  • Attica
  • Central Greece
  • Central Macedonia
  • Crete
  • East Macedonia and Thrace
  • Epirus
  • Ionian Islands
  • North Aegean
  • Peloponnese
  • Southern Aegean
  • Thessaly
  • West Macedonia
  • Western Greece
Greece Region Boundaries

Download Greece Region Boundaries Shapefile

Download Greece Prefectures Shapefile Data

Prefectures are the second level administrative division of Greece after regional division. There are 51 prefectures.

Greece Prefecture Boundaries

Download Greece Prefecture Boundaries Shapefile

Download Greece Municipalities Shapefile Data

Municipalities are the lowest level of government within the organizational structure of the state. There were 1033 municipalities based on the 1997 Kapodistrias reform. Kallikratis reform of 2011 merged certain municipalities. So currently there are 325 municipalities in Greece.

Greece Municipality Boundaries

Download Greece Municipality Boundaries Shapefile

Other Administrative Boundary Data:

Download Free Shapefile for the following:

  1. World Countries Shapefile
  2. Australia
  3. Argentina
  4. Austria
  5. Belgium
  6. Brazil
  7. Canada
  8. Denmark
  9. Fiji
  10. Finland
  11. Germany
  12. Greece
  13. India
  14. Indonesia
  15. Ireland
  16. Italy
  17. Japan
  18. Kenya
  19. Lebanon
  20. Madagascar
  21. Malaysia
  22. Mexico
  23. Mongolia
  24. Netherlands
  25. New Zealand
  26. Nigeria
  27. Papua New Guinea
  28. Philippines
  29. Poland
  30. Russia
  31. Singapore
  32. South Africa
  33. South Korea
  34. Spain
  35. Switzerland
  36. Tunisia
  37. United Kingdom Shapefile
  38. United States of America
  39. Vietnam
  40. Croatia
  41. Chile
  42. Norway

Disclaimer : If you find any shapefile data of country provided is in correct do contact us or comment below, so that we will correct the same in our system as well we will try to correct the same in OSM.

Download Belgium Administrative Boundary Shapefiles – Provinces, Arrondissements, Postal Districts and more

Hello GIS enthusiasts, IGISMAP has now published the latest GIS vector data of Belgium administrative levels. Links for downloading the shapefiles of the important administrative divisions of Belgium are provided in the following. You can also download these data in KML, GeoJSON or CSV formats.

Note:

  • All data available are in GCS datum EPSG:4326 WGS84 CRS (Coordinate Reference System).
  • You need to login for downloading the shapefile.

Download Free Shapefile Data of Belgium

Belgium officially known as the Kingdom of Belgium, is a country in Western Europe. It is bordered by the Netherlands to the north, Germany to the east, Luxembourg to the southeast, France to the southwest, and the North Sea to the northwest. The capital and largest city is Brussels; other major cities are Antwerp, Ghent, Charleroi, Liège, Bruges, Namur, and Leuven.

Belgium National Boundary

Download Belgium National Outline Boundary Shapefile

Download Belgium Provinces Shapefile Data

The country of Belgium is divided into three regions. Two of these regions, Flanders and Wallonia, are each subdivided into five provinces. The third region, Brussels, is not divided into provinces, as it was originally only a small part of a province itself. Thus there are 11 provinces in Belgium.

Belgium Province Boundaries

Download Belgium Province Boundaries Shapefile

Second level NUTS division of Belgium for European Union statistical purposes is same as the province level division of Belgium

Download Belgium Arrondissement Divisions Shapefile Data

Arrondissements of Belgium are subdivisions below the provinces of Belgium. There are administrative, judicial and electoral arrondissements. IGISMAP provides the shapefile data of administrative arrondissements. There are43 administrative arrondissements including the Brussels-Capital as a single arrondissement.

Belgium Arrondissement Boundaries

Download Belgium Arrondissements Boundaries Shapefile

Download Belgium Postal District Divisions Shapefile Data

There are over 1268 postcode district boundaries based on the data provided below

Belgium Postal District Boundaries

Download Belgium Postal District Boundaries Shapefile

Other Administrative Boundary Data:

Download free Shapefile

  1. World Countries Shapefile
  2. Australia
  3. Argentina
  4. Austria
  5. Belgium
  6. Brazil
  7. Canada
  8. Denmark
  9. Fiji
  10. Finland
  11. Germany
  12. Greece
  13. India
  14. Indonesia
  15. Ireland
  16. Italy
  17. Japan
  18. Kenya
  19. Lebanon
  20. Madagascar
  21. Malaysia
  22. Mexico
  23. Mongolia
  24. Netherlands
  25. New Zealand
  26. Nigeria
  27. Papua New Guinea
  28. Philippines
  29. Poland
  30. Russia
  31. Singapore
  32. South Africa
  33. South Korea
  34. Spain
  35. Switzerland
  36. Tunisia
  37. United Kingdom Shapefile
  38. United States of America
  39. Vietnam
  40. Croatia
  41. Chile
  42. Norway

Disclaimer : If you find any shapefile data of country provided is incorrect do contact us or comment below, so that we will correct the same in our system as well we will try to correct the same in OSM.

Download West Virginia State GIS Maps – Boundary, Counties, Rail, highway

GIS Data and Maps of West Virginia State is used by planners and surveyors for visualizing and identifying the patterns that are difficult to examine when data is in table form. Here you can download the GIS data of the state boundary, county division, rail and highway maps in just a few clicks. You can use these data for analysis in MAPOG itself or download them in any suitable GIS format. You can download these data in KML, GeoJSON, CSV or Shapefile formats.

With MAPOG’s versatile toolkit, you can effortlessly upload vector and raster filesadd WMS (Web Map Service) layers, upload Excel or CSV data, incorporate existing files, perform polygon splitting and merging, generate new polygon and polyline data, use the converter for various formats, conduct buffer analysiscreate gridstransform points into polygons, calculate isochrones, and utilize the geocoder for precise location information.

We offer an extensive array of data formats, including KML, SHP, CSV, GeoJSON, Tab, SQL, Tiff, GML, KMZ, GPKZ, SQLITE, Dxf, MIF, TOPOJSON, XLSX, GPX, ODS, MID, and GPS, ensuring compatibility and accessibility for various applications and analyses.

Note:

  • All data available are in GCS datum EPSG:4326 WGS84 CRS (Coordinate Reference System).
  • You need to login for downloading the shapefile.

Download Shapefile Data West Virginia State

West Virginia is a state in the Appalachian, Mid-Atlantic and South-eastern regions of the United States. Charleston city is the capital city of the state. In addition, if you are looking for any other GIS formats then use GIS File Converter.

West Virginia State Boundary

Download West Virginia State Outline Boundary Shapefile

In the above screen boundary map of West Virginia state. This is the map view for the data table switch button from the map to the data. The layer name is provided on the right side of the screen. For download click on the button placed beside the map layer name. You can locate your store/ shop on a map.

Download West Virginia Counties Shapefile Data

There are 55 counties in the U.S. state of West Virginia.

West Virginia County Boundary

Download West Virginia County Boundary Shapefile

Polygon map with county division is visible on the above screen. You can easily download and upload in a tool for free and create a map from GIS data. Edit, format, add attribute column and share it with your colleagues.

Above all Layers cover GIS data of following Counties –

Barbour
Berkeley
Boone
Braxton
Brooke
Cabell
Calhoun
Clay
Doddridge
Fayette
Gilmer
Grant
Greenbrier
Hampshire
Hancock
Hardy
Harrison
Jackson
Jefferson
Kanawha
Lewis
Lincoln
Logan
Marion
Marshall
Mason
McDowell
Mercer
Mineral
Mingo
Monongalia
Monroe
Morgan
Nicholas
Ohio
Pendleton
Pleasants
Pocahontas
Preston
Putnam
Raleigh
Randolph
Ritchie
Roane
Summers
Taylor
Tucker
Tyler
Upshur
Wayne
Webster
Wetzel
Wirt
Wood
Wyoming

Highway Line GIS Data of West Virginia State

West Virginia Highway Lines

Download West Virginia Highway Lines Shapefile

Zoom in view of highway line map is shown shown above. Similarly, you can easily download point based GIS data of airport point, ATM point, parking area, hospital location, etc.

Railways Line GIS Data of West Virginia U.S. State

West Virginia Railway Lines

Download West Virginia Railway Lines Shapefile

On the above screen, the railways line map is shown. Likewise, you can download residential land-use points, polygon, restaurants, business GIS data layers.

Download GIS Data of other states of USA:

  1. Alabama
  2. Alaska
  3. Arizona
  4. Arkansas
  5. California
  6. Colorado
  7. Connecticut
  8. Florida
  9. Georgia
  10. Hawaii
  11. Idaho
  12. Illinois
  13. Indiana
  14. Iowa
  15. Kansas
  16. Massachusetts
  17. Maryland
  18. Michigan
  19. Minnesota
  20. Mississipi
  21. Missouri
  22. Montana
  23. Nevada
  24. Nebraska
  25. Ohio
  26. Oklahoma
  27. Pennsylvania
  28. Utah
  29. Vermont
  30. Washington
  31. Wisconsin
  32. Wyoming
  33. Tennessee
  34. Texas
  35. Kentucky
  36. Louisiana
  37. Maine
  38. North Carolina
  39. Oregon
  40. Virginia
  41. West Virginia

Disclaimer : If you find any shapefile data of country provided is in correct do contact us or comment below, so that we will correct the same in our system.

Exit mobile version