Great news for all GIS admirers. IGISMAP have recently published with GIS data collection for more than 100 new countries. Links for downloading the shapefiles of the important administrative divisions of Finland are provided in the following. You can also download these data in KML, GeoJSON or CSV formats.
Note:
- All data available are in GCS datum EPSG:4326 WGS84 CRS (Coordinate Reference System).
- You need to login for downloading the shapefile.
Download Free Shapefile Data of Finland
Finland, officially the Republic of Finland, is a Nordic country in Northern Europe. It borders Sweden to the northwest, Norway to the north, and Russia to the east, with the Gulf of Bothnia to the west and the Gulf of Finland to the south, across from Estonia. Finland covers an area of 338,455 square kilometres (130,678 sq mi) with a population of 5.6 million. Helsinki is the capital and largest city. The vast majority of the population are ethnic Finns. Finnish and Swedish are the official languages, Swedish is the native language of 5.2% of the population. Finland’s climate varies from humid continental in the south to the boreal in the north. The land cover is primarily a boreal forest biome, with more than 180,000 recorded lakes.
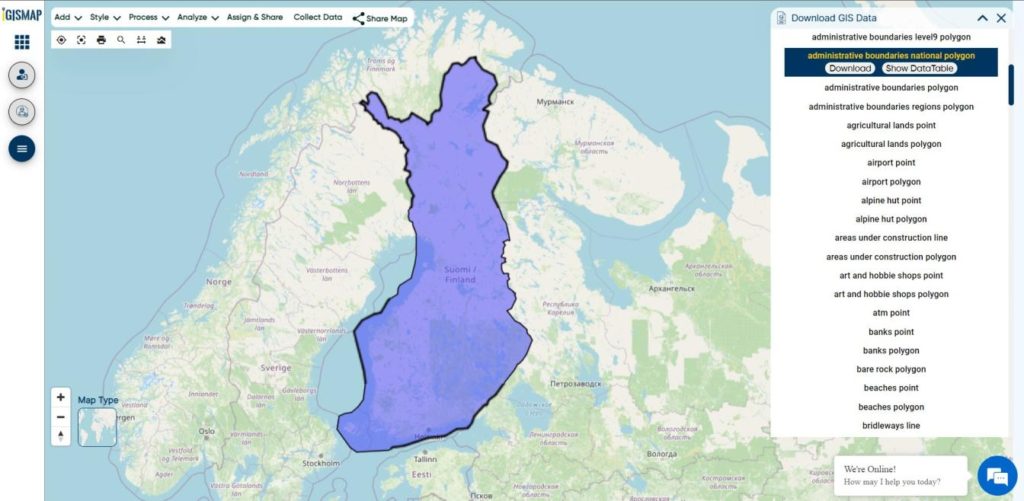
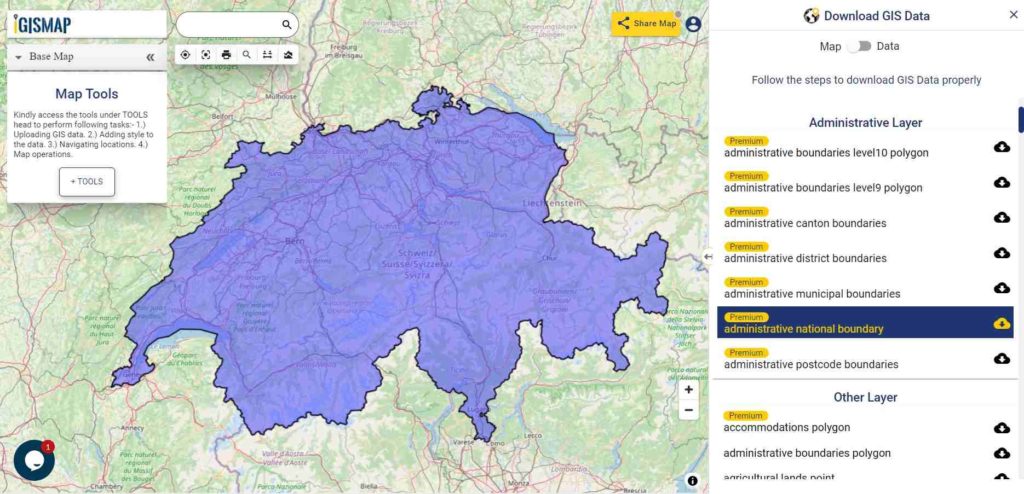
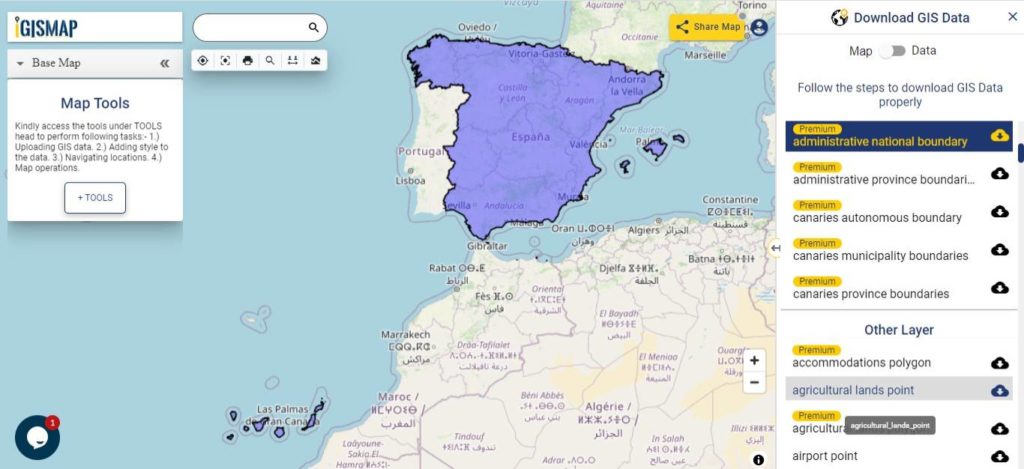
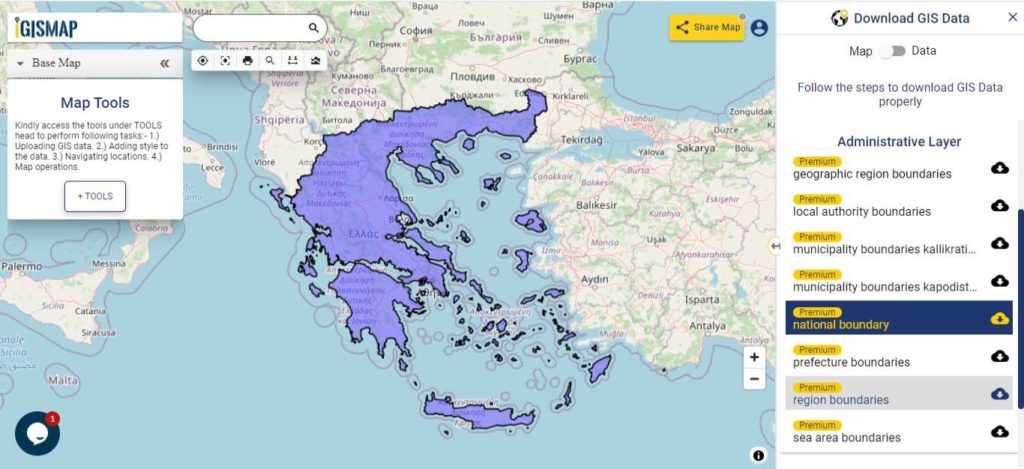
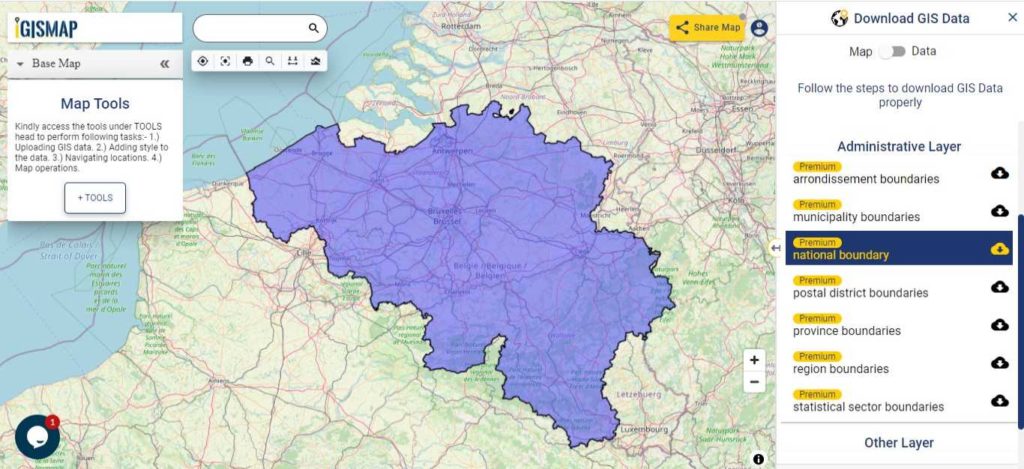
Download Finland National Boundary Shapefile
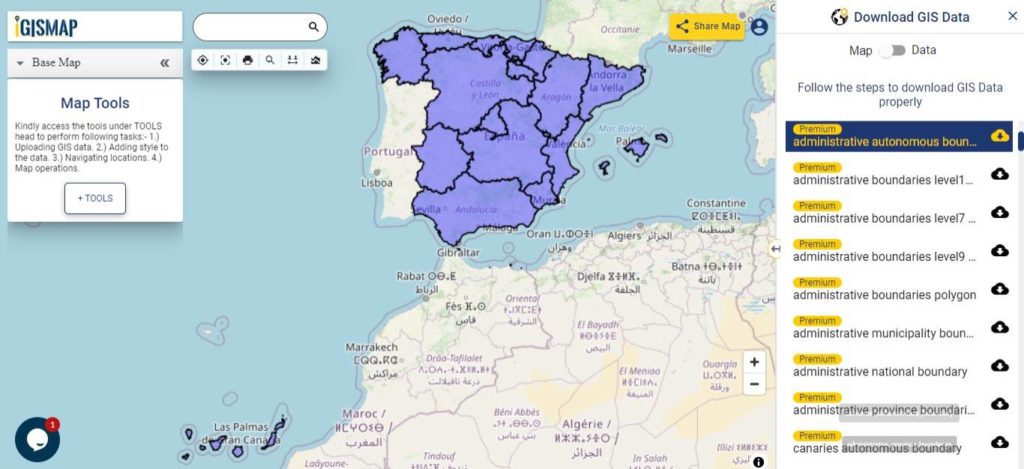
Download Finland Regional State Administrative Agencies Shapefile Data
The Regional State Administrative Agencies are a set of top-level regional organs of the state of Finland, mainly in charge of basic public services and legal permits. Six agencies took over some of the tasks of the earlier provinces of Finland, which were abolished at the end of 2009. A seventh agency in the autonomous area Åland is named the State Department of Åland.
The agencies themselves do not constitute a subdivision of Finland instead, the first-level subdivisions are the regions of Finland. The other important set of top-level regional state agencies are the Centres for Economic Development, Transport and the Environment
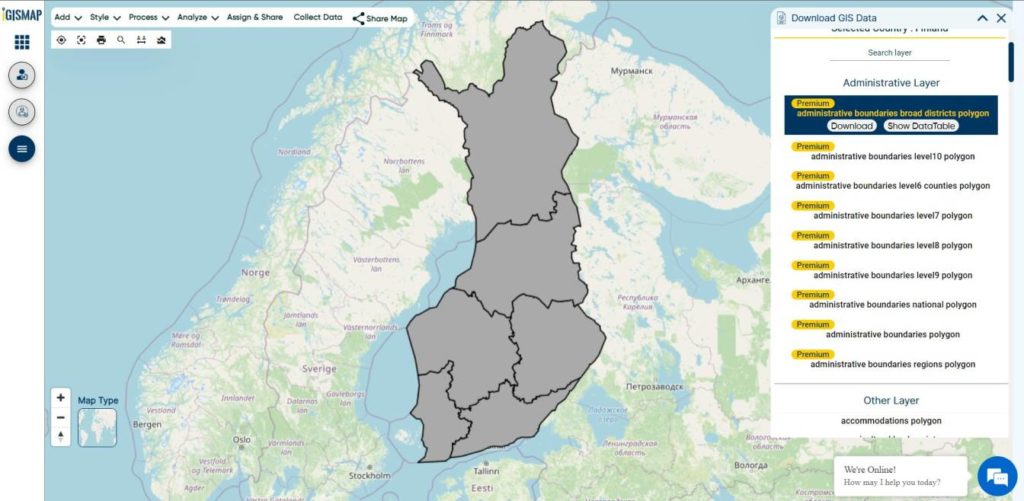
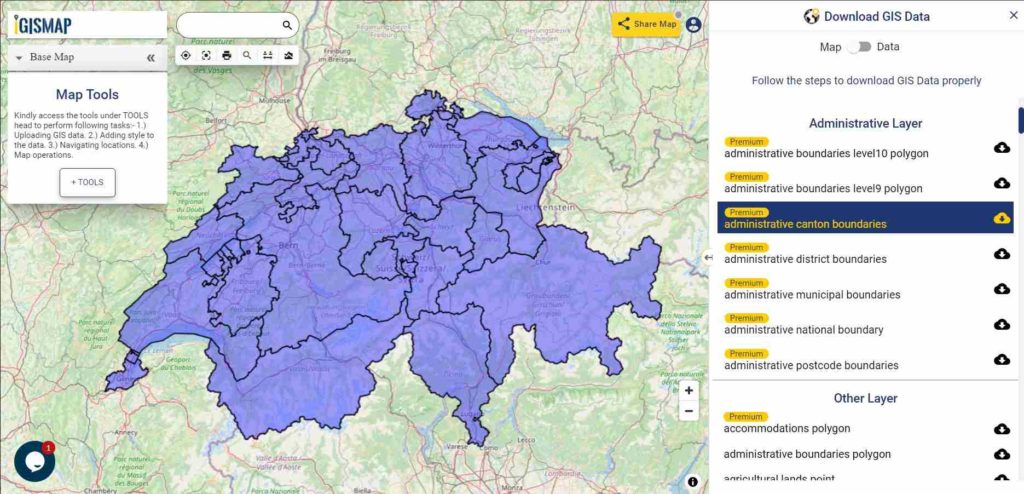
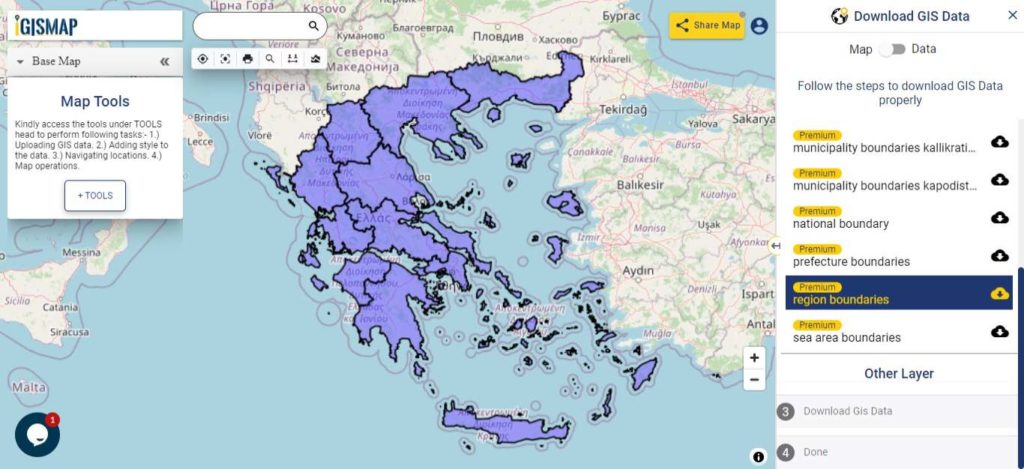
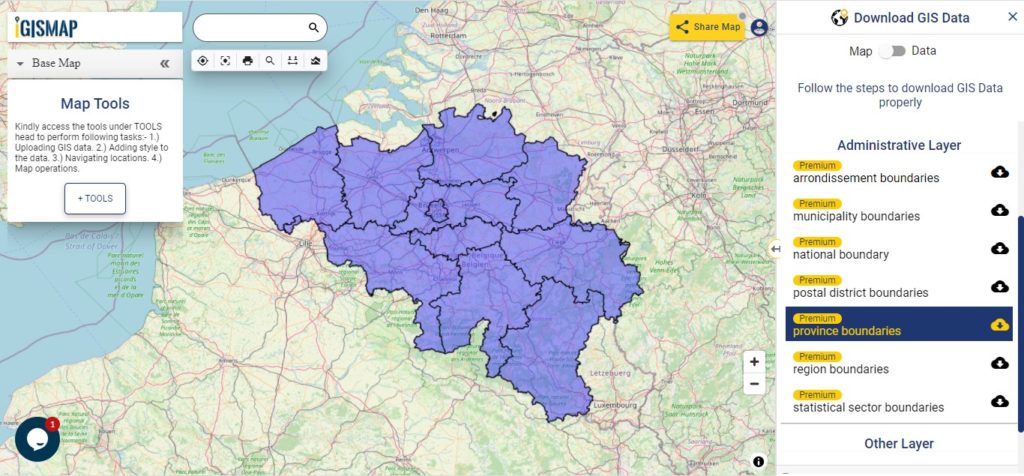
Download Finland Region Boundaries Shapefile
This shapefile covers following administrative agencies listed below:
- Regional State Administrative Agency for Southern Finland
- Regional State Administrative Agency for Southwestern Finland
- Regional State Administrative Agency for Western and Inland Finland
- Regional State Administrative Agency for Eastern Finland
- Regional State Administrative Agency for Northern Finland
- Regional State Administrative Agency for Lapland
- State Department of Åland
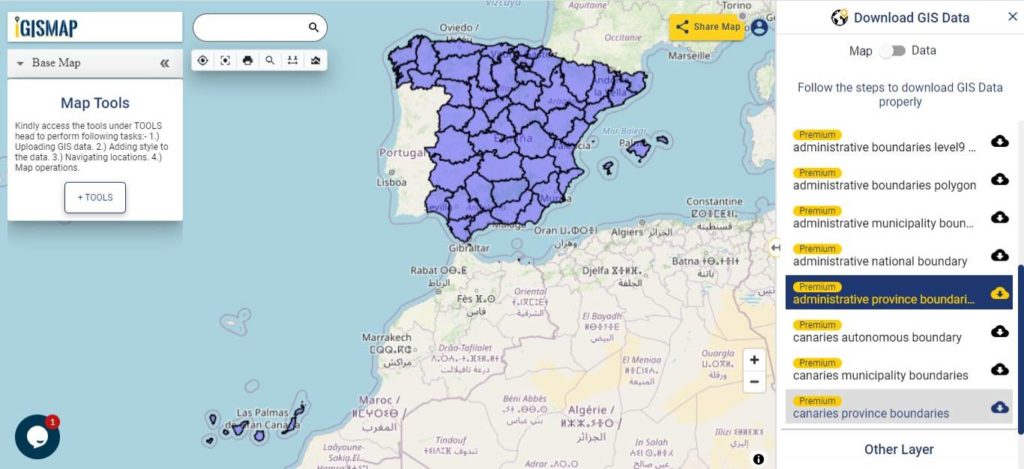
Download Finland Regions Shapefile Data
Finland is divided into 19 regions. The regions are governed by regional councils that serve as forums of cooperation for the municipalities of each region. The councils are composed of delegates from the municipal councils. The main tasks of regional councils are regional planning, the development of enterprises, and education. Between 2004 and 2012, the regional council of Kainuu was elected via popular elections as part of an experimental regional administration.
Download Finland Region Boundaries Shapefile
This shapefile covers following regions of Finland listed below:
- Lapland
- North Ostrobothnia
- Kainuu
- North Karelia
- North Savo
- South Savo
- South Karelia
- Central Finland
- South Ostrobothnia
- Ostrobothnia
- Central Ostrobothnia
- Pirkanmaa
- Satakunta
- Päijät-Häme
- Kanta-Häme
- Kymenlaakso
- Uusimaa
- Southwest Finland
- Åland
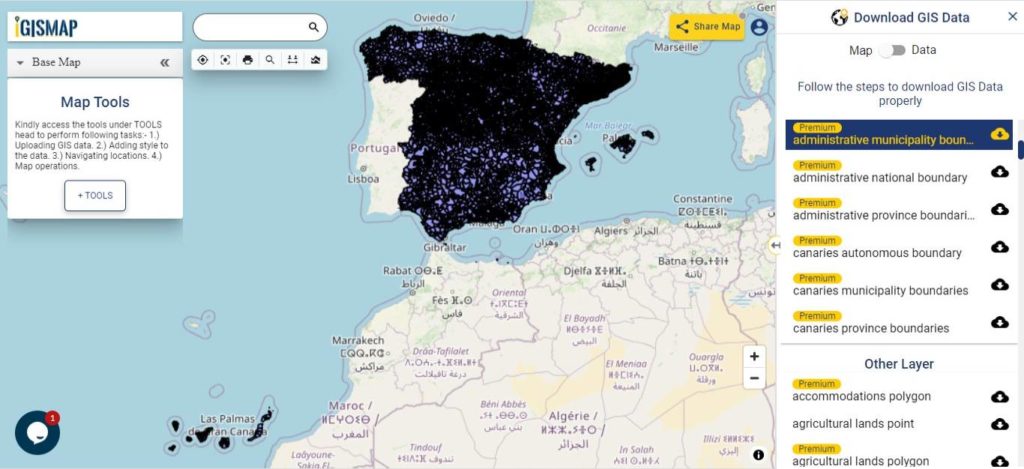
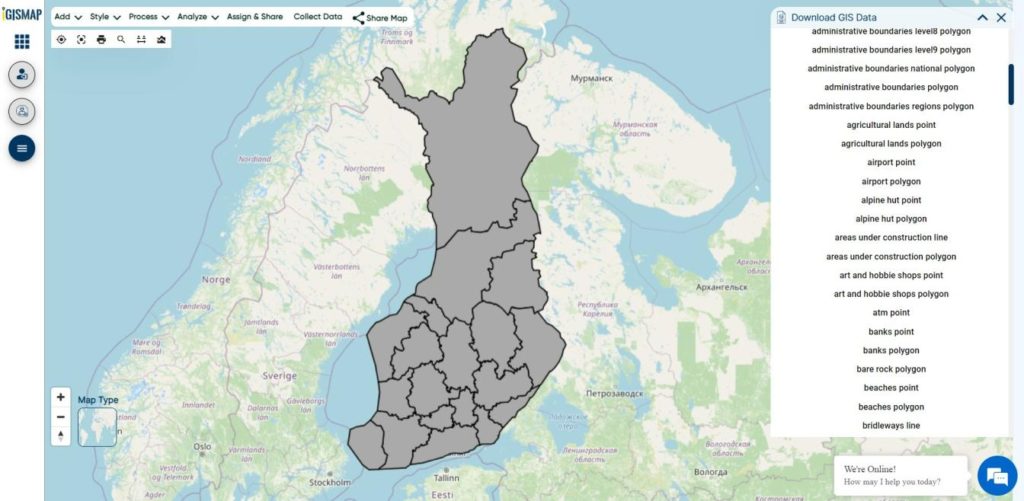
Download Finland Municipalities Shapefile Data
The municipalities represent the local level of administration in Finland and act as the fundamental, self-governing administrative units of the country. The entire country is incorporated into municipalities and legally, all municipalities are equal, although certain municipalities are called cities or towns. Municipalities have the right to levy a flat percentual income tax, which is between 16 and 22 percent, and they provide two thirds of public services. Municipalities control many community services, such as schools, health care and the water supply, and local streets. They do not maintain highways, set laws or keep police forces, which are responsibilities of the central government.
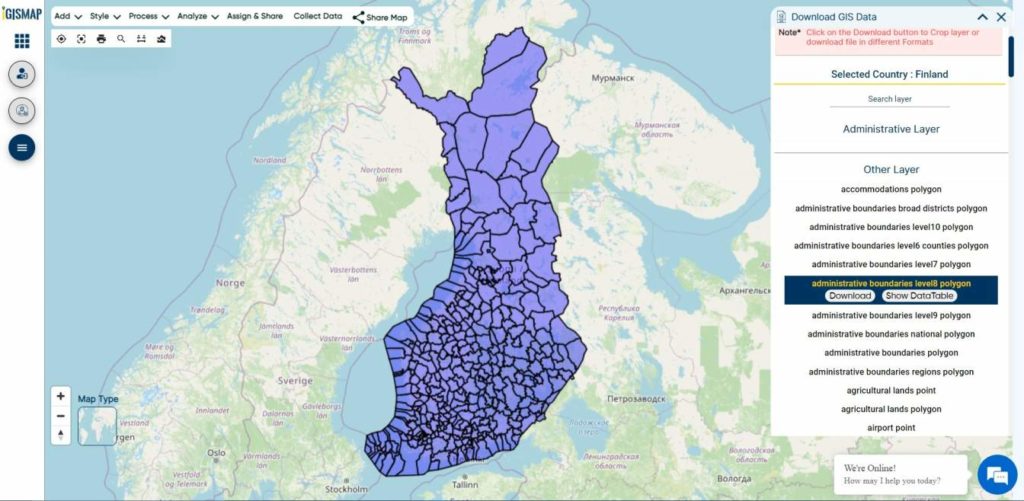
Download Finland Municipality Boundaries Shapefile
Other Administrative Boundary Data:
- Download Finland Sub Regions Boundaries Shapefile
- Download Finland Administrative Boundaries Level 10 Shapefile
- Download Finland Administrative Boundaries Level 9 Shapefile
- Download Finland Geographic Boundaries Shapefile
Download Free Shapefile for the following:
- World Country Shapefile
- Australia Shapefile download
- Argentina
- Brazil
- Download Shapefile of Canada
- Denmark
- Germany
- India
- Indonesia
- Japan
- Kenya
- Lebanon
- Madagascar
- Malaysia Shapefile
- Mexico Shapefile
- Mongolia
- New Zealand
- Nigeria
- Papua New Guinea
- Philippines
- Poland
- Singapore
- South Africa Province Shapefile
- South Korea
- Tunisia
- United Kingdom Shapefile
- Download Shapefile of United States of America
- Vietnam
Disclaimer : If you find any shapefile data of country provided is incorrect do contact us or comment below, so that we will correct the same in our system as well we will try to correct the same in openstreetmap.