This guide outlines an easy-to-follow process for converting GeoJSON files into PNG format using the Converter Tool within MAPOG. Whether you’re a newcomer to MAPOG or already have experience with the platform, this tutorial will guide you through the conversion process smoothly.
What is GeoJSON Data Format:
GeoJSON is a geospatial data format based on JSON (JavaScript Object Notation) used to represent geographic features such as points, lines, and polygons. It stores both spatial data (coordinates) and attribute information, making it widely used for web mapping and data exchange in GIS applications due to its simplicity and compatibility with various platforms.
Converting GeoJSON to PNG Data Format:
MAPOG’s Converter Tool simplifies the process of converting data between formats. Whether you’re converting GeoJSON to PNG or any other format, this tool helps streamline workflows and makes GIS data more accessible for diverse projects.
Steps to Convert GeoJSON to PNG
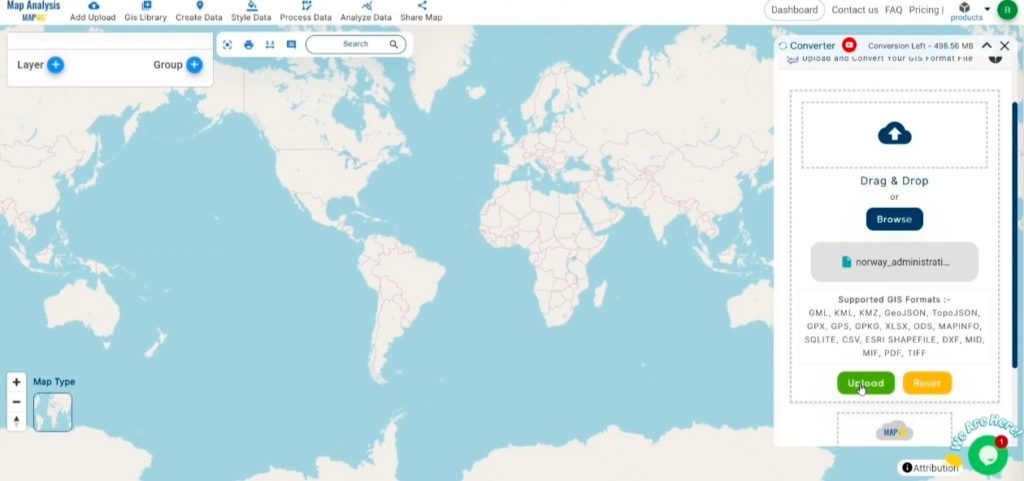
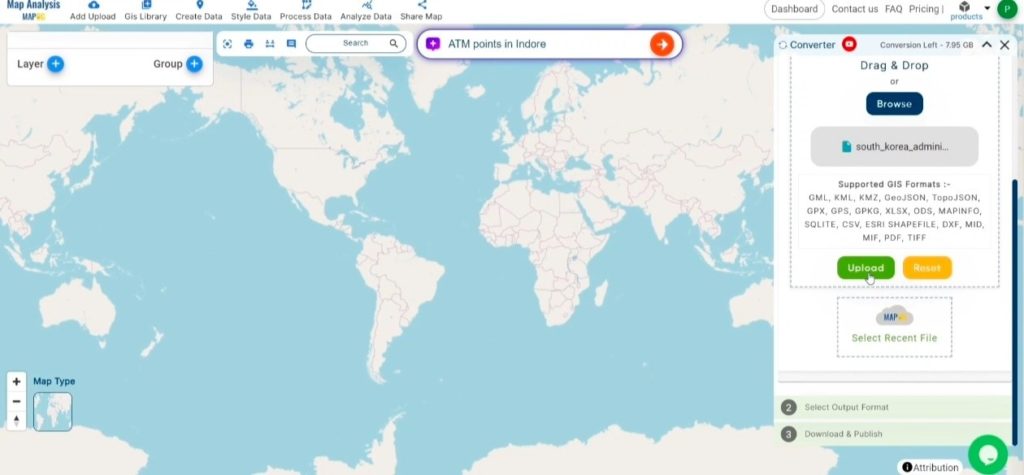
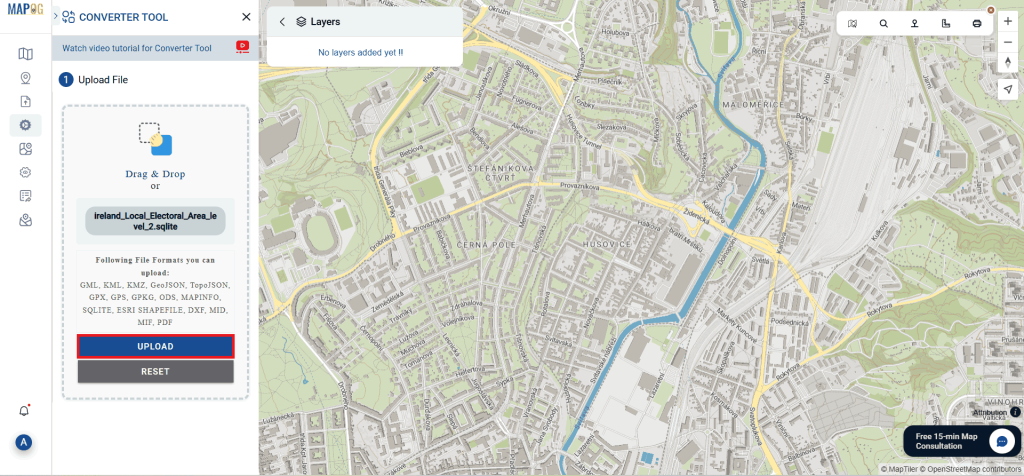
Step 1: Upload Your Data:
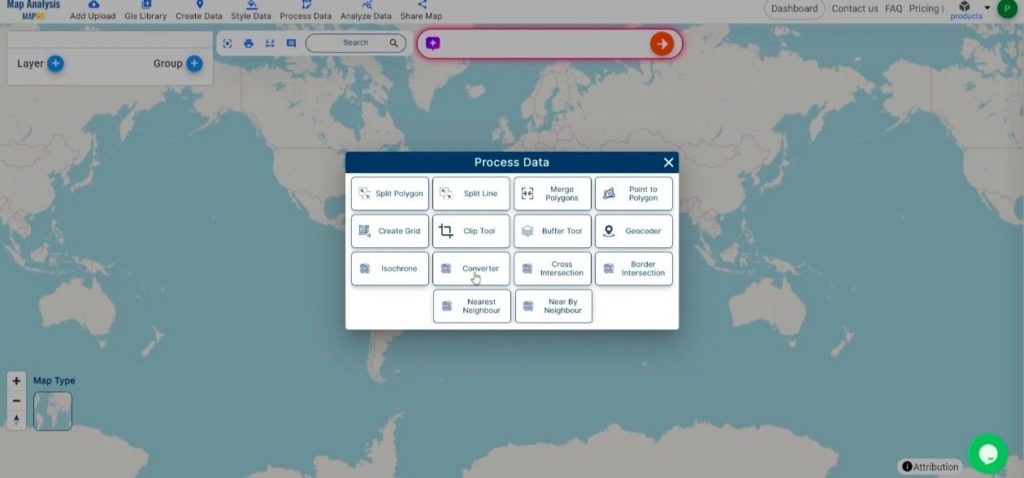
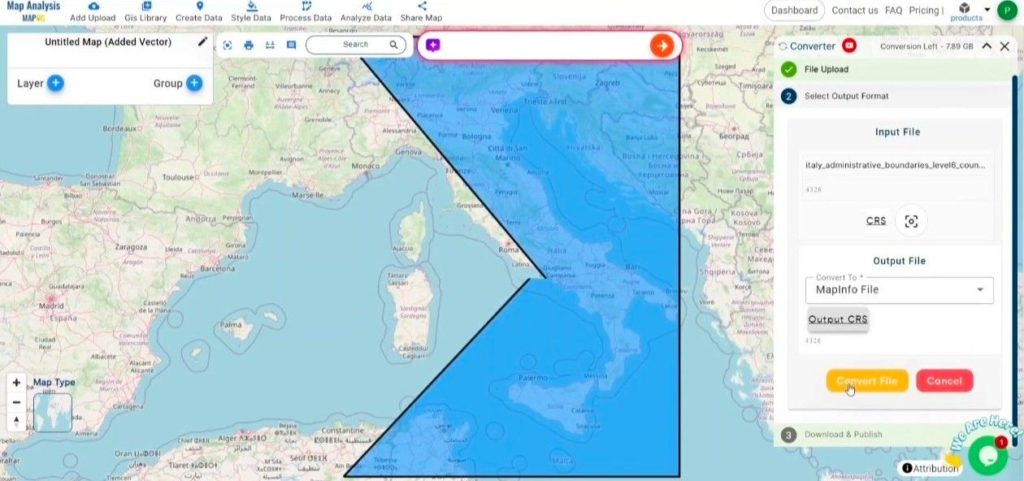
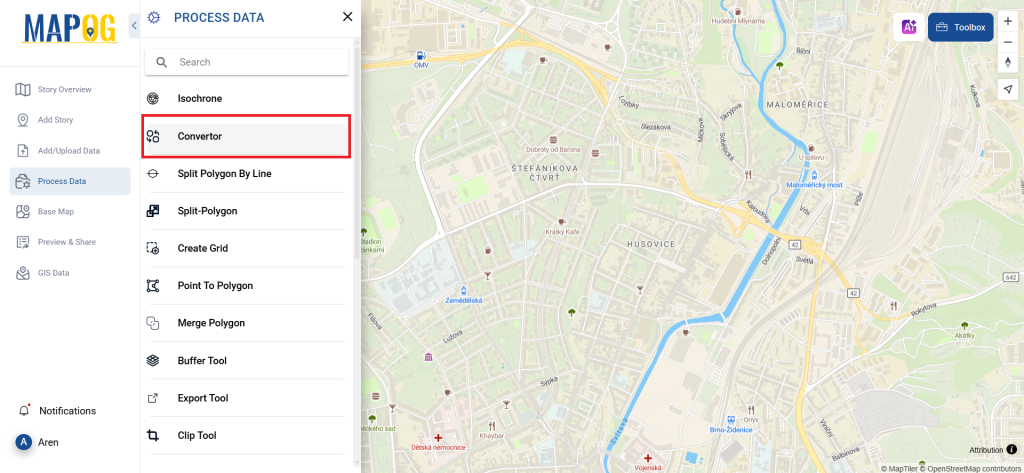
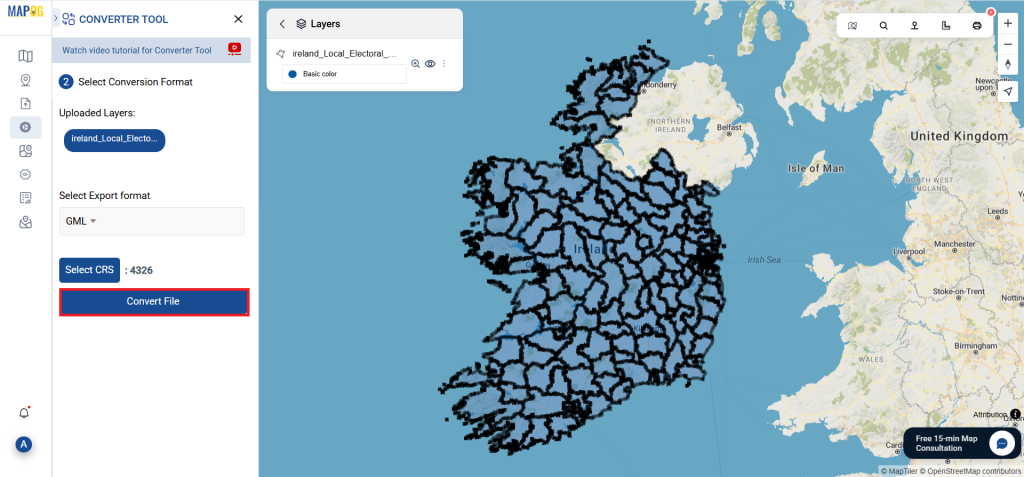
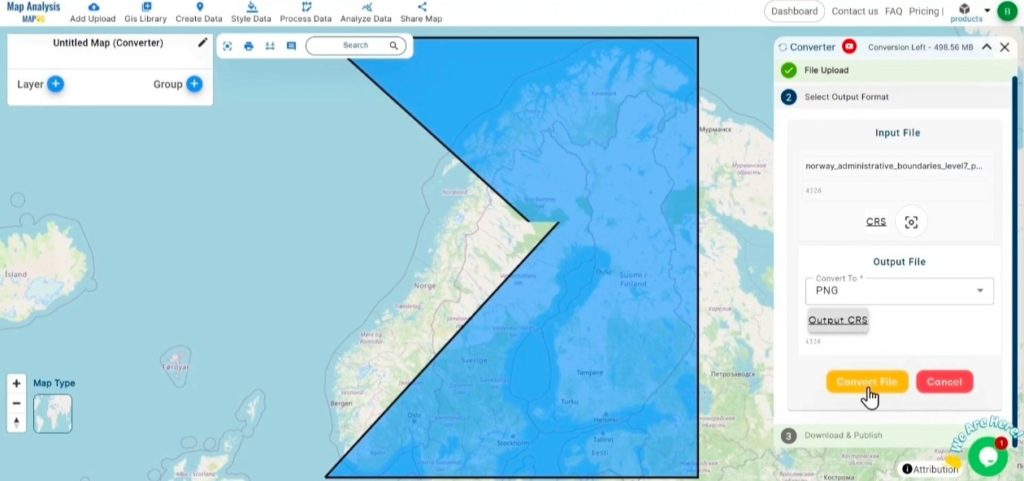
- Begin by navigating to the top menu, selecting “Process Data,” and then choosing the “Converter Tool” to initiate the conversion process.

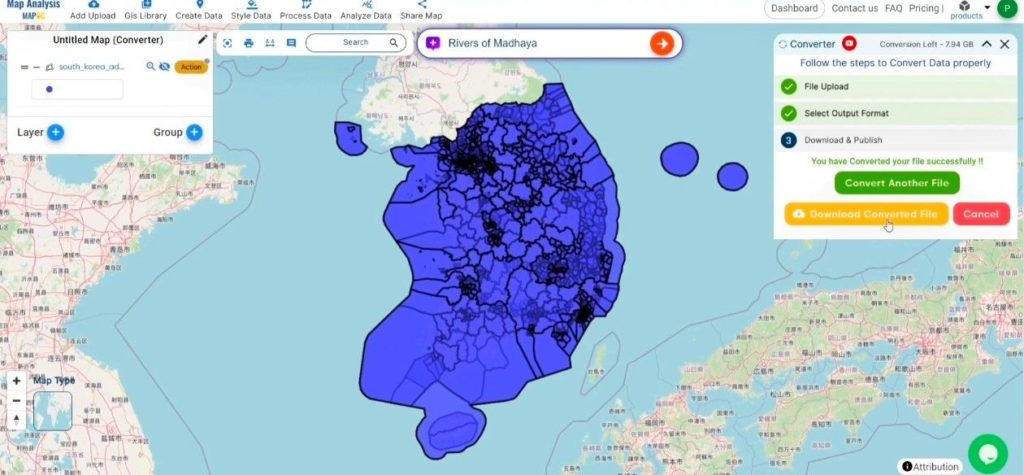
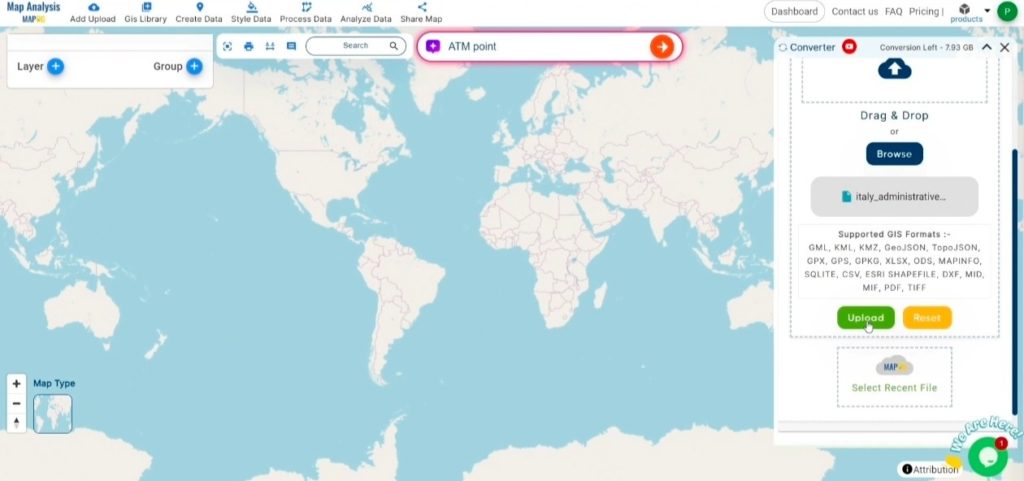
2. To start the conversion, upload your GeoJSON file by selecting the data you want to convert.

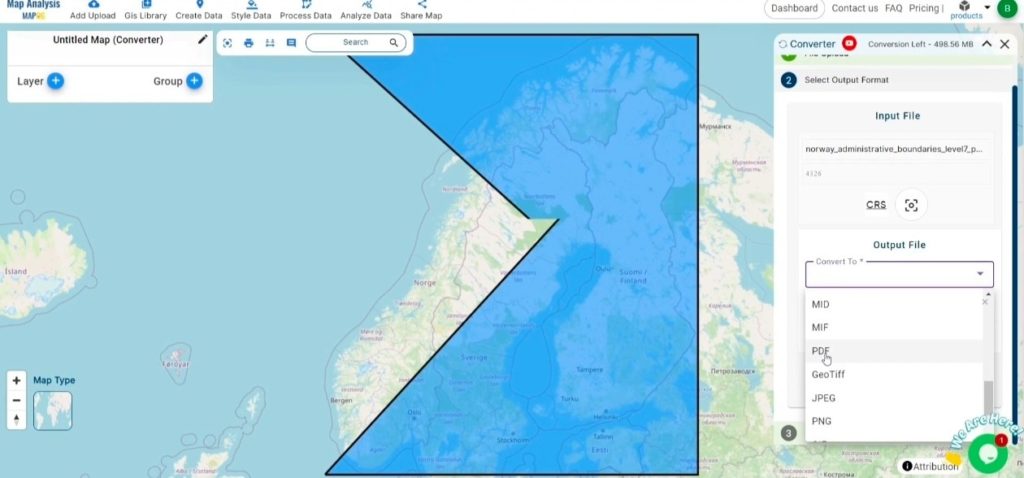
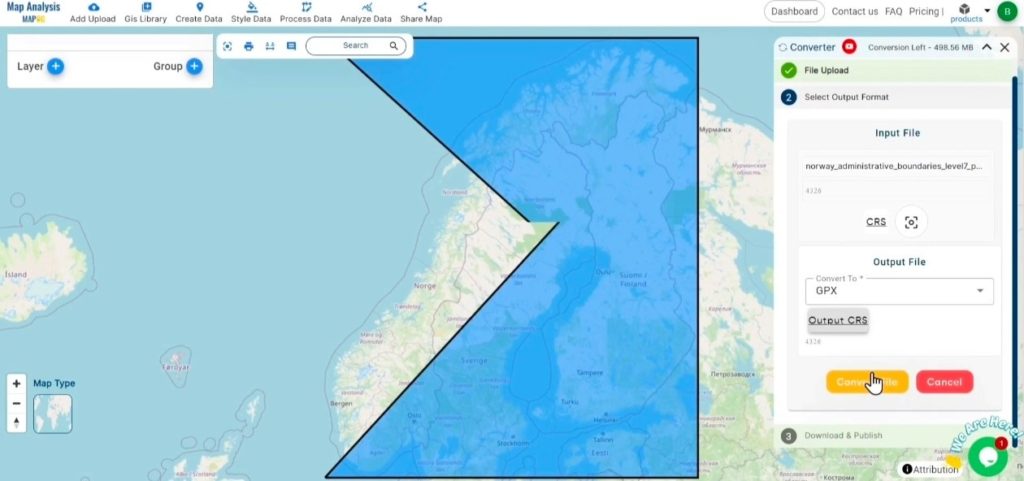
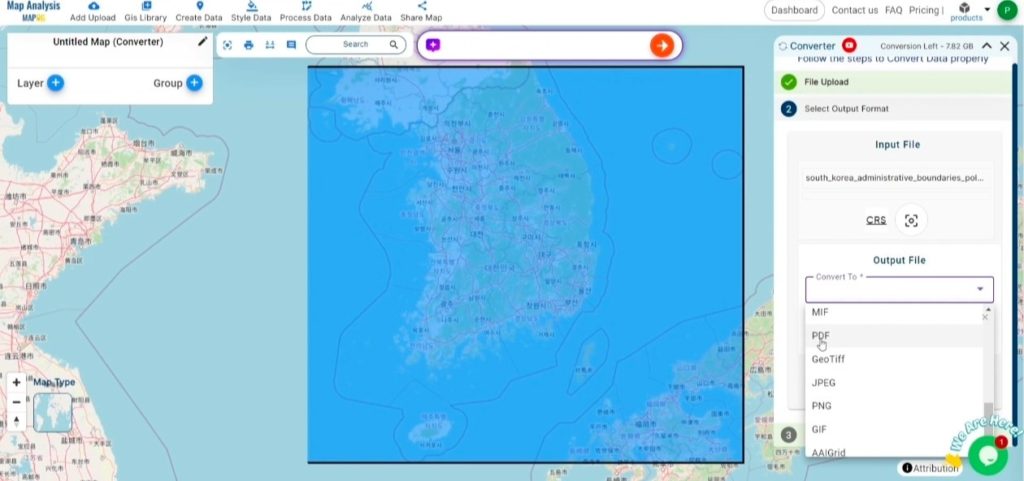
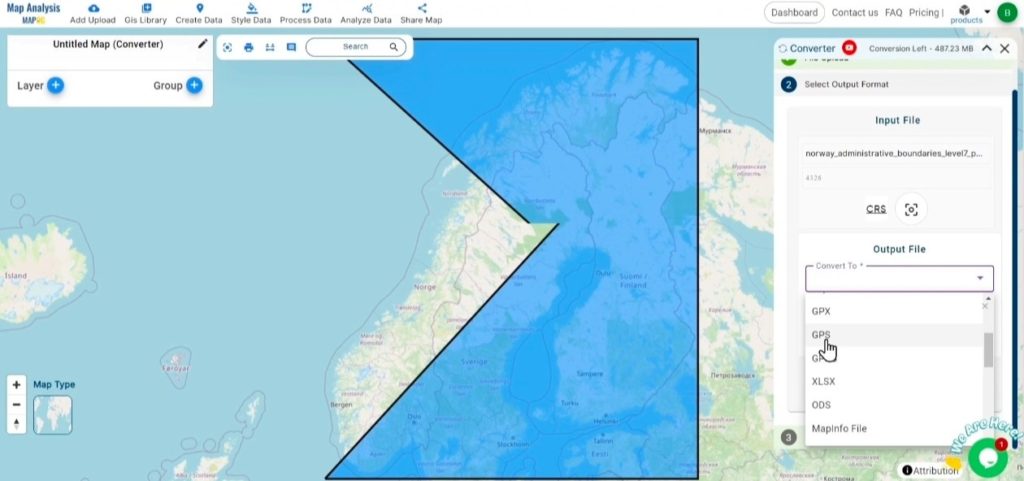
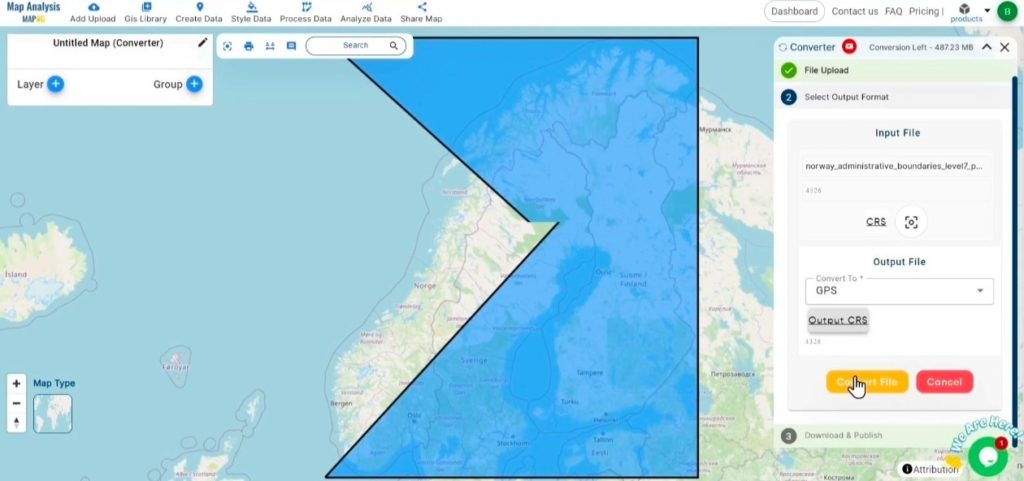
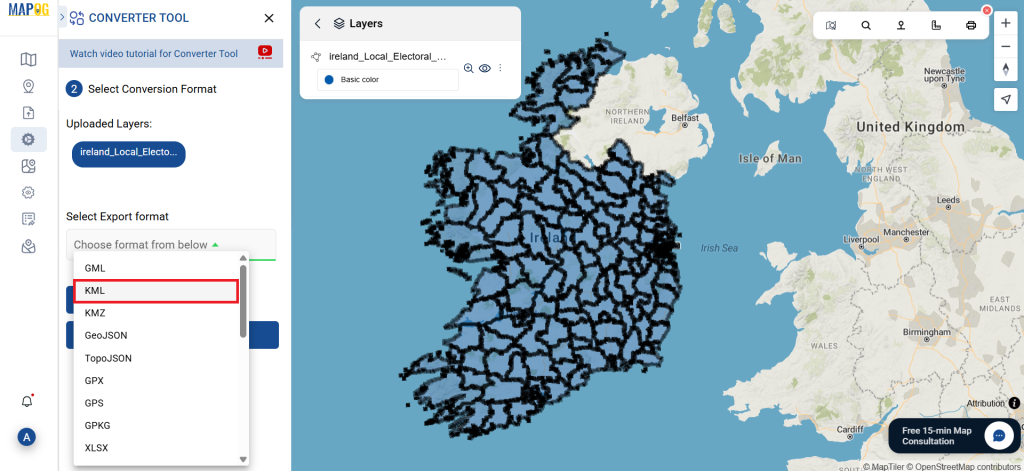
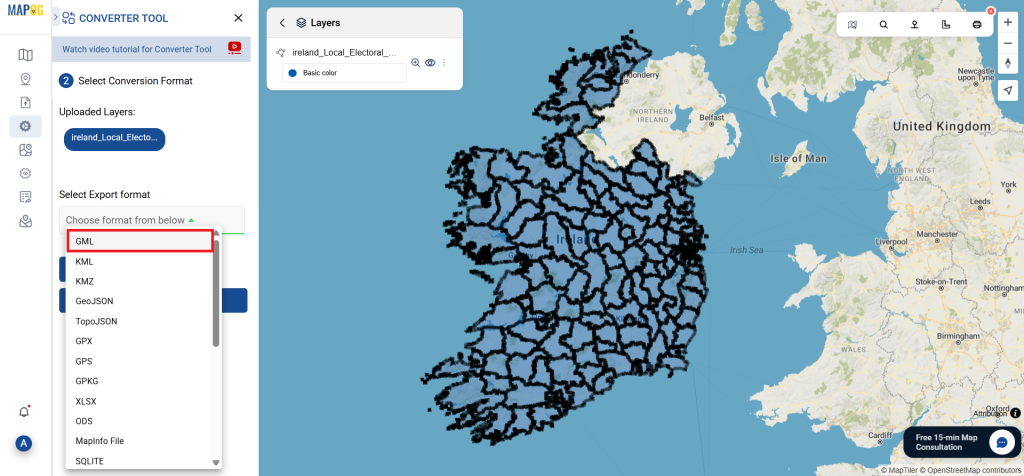
Step 2: Select the Output Format:
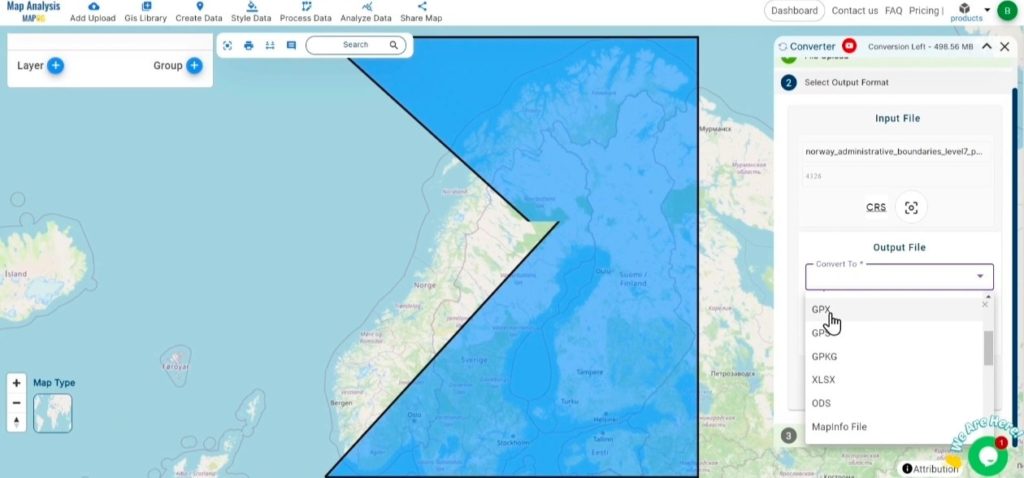
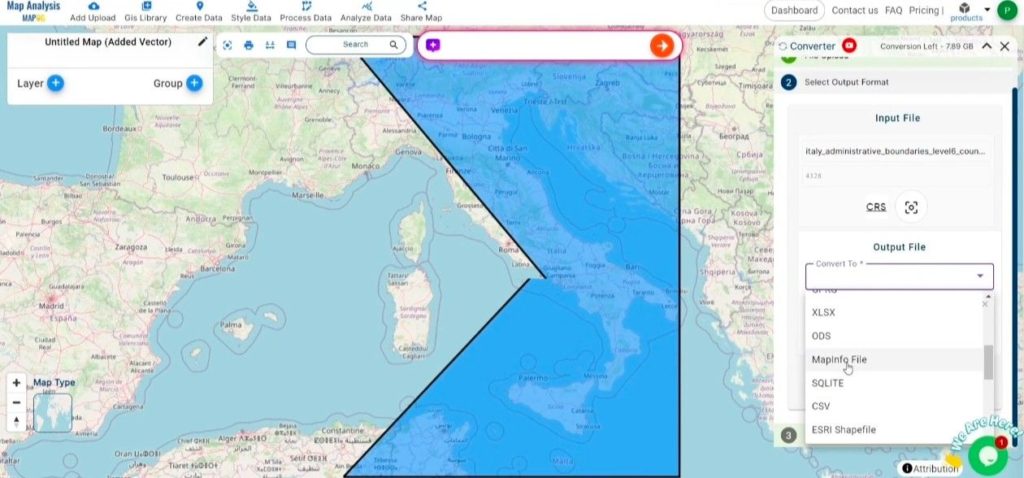
- In the Converter Tool, you’ll see a range of output format options. Choose PNG as the format you wish to export your data to. Although the tool offers multiple formats for conversion, this guide is specifically designed to help you convert your GeoJSON file into PNG format.

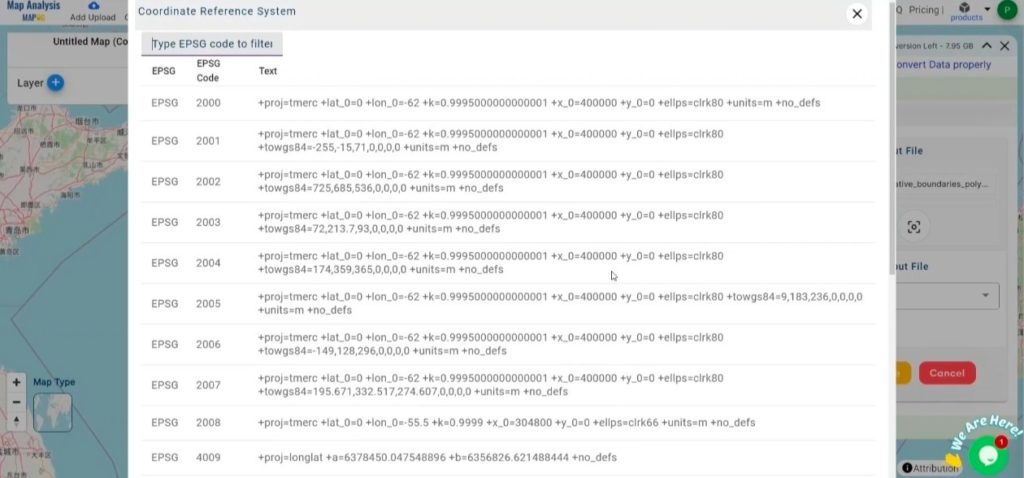
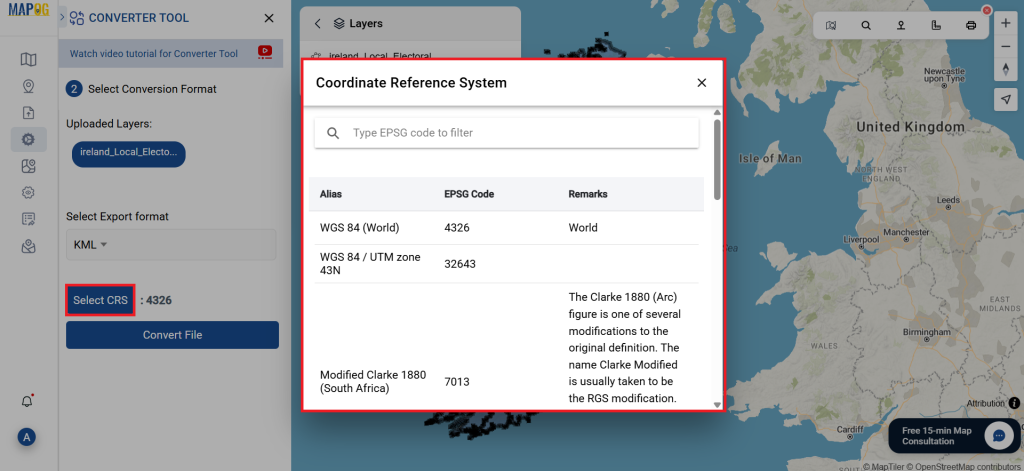
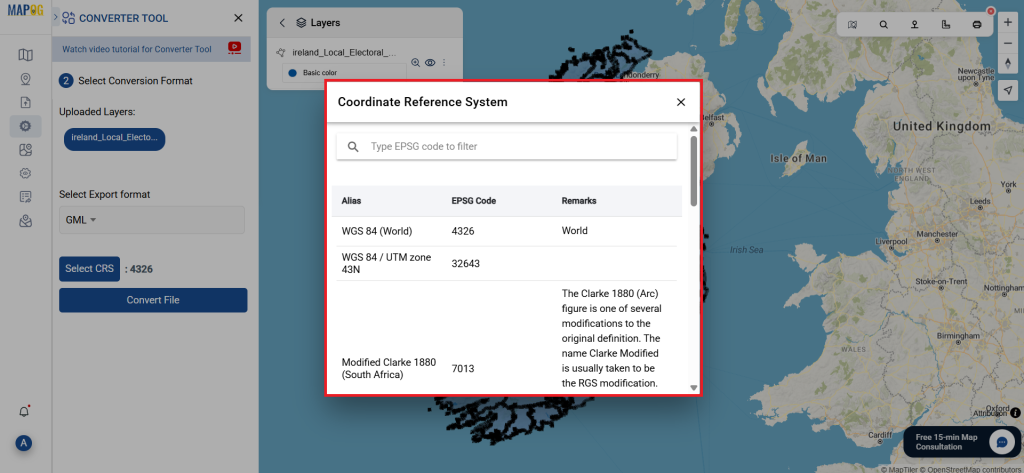
2. You can also Choose the Output Coordinate Reference System (CRS) according to your spatial analysis requirement.

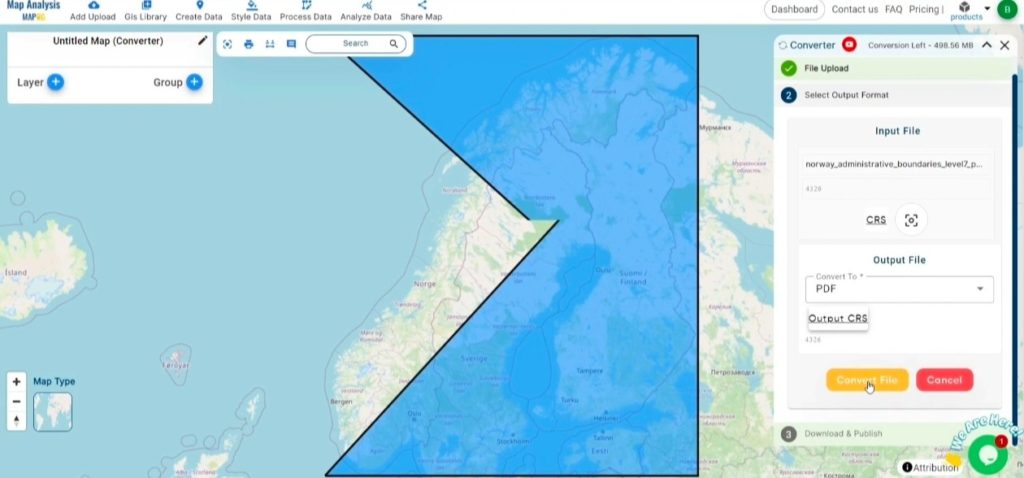
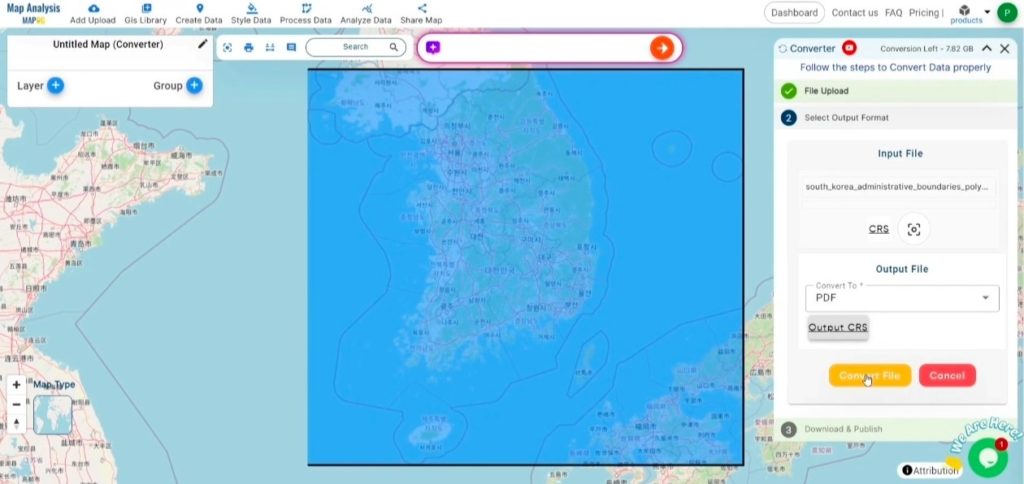
Step 3: Execute the Conversion:
Head to the “Convert Files” section within the Converter Tool. Upload your GeoJSON file, and the tool will handle the conversion. It will efficiently transform your GeoJSON file into PNG format, ensuring the process is quick and easy.
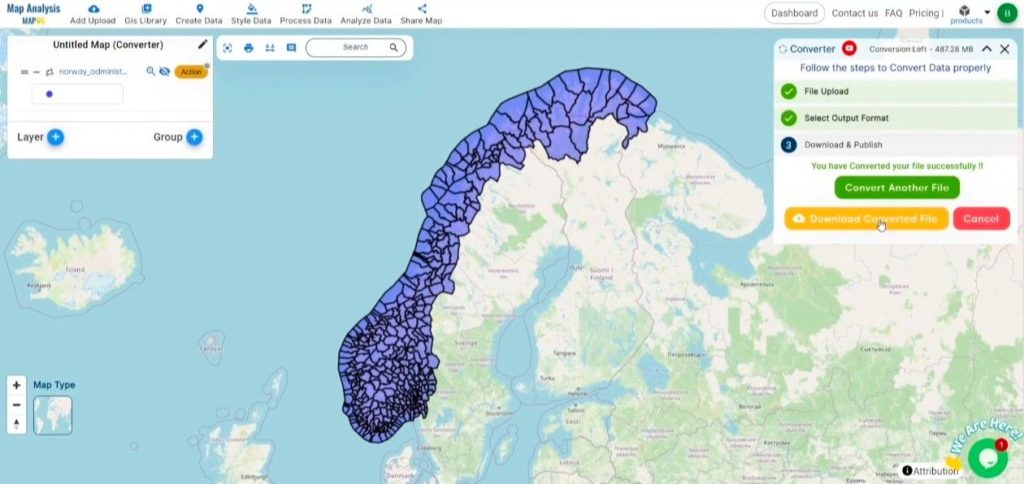
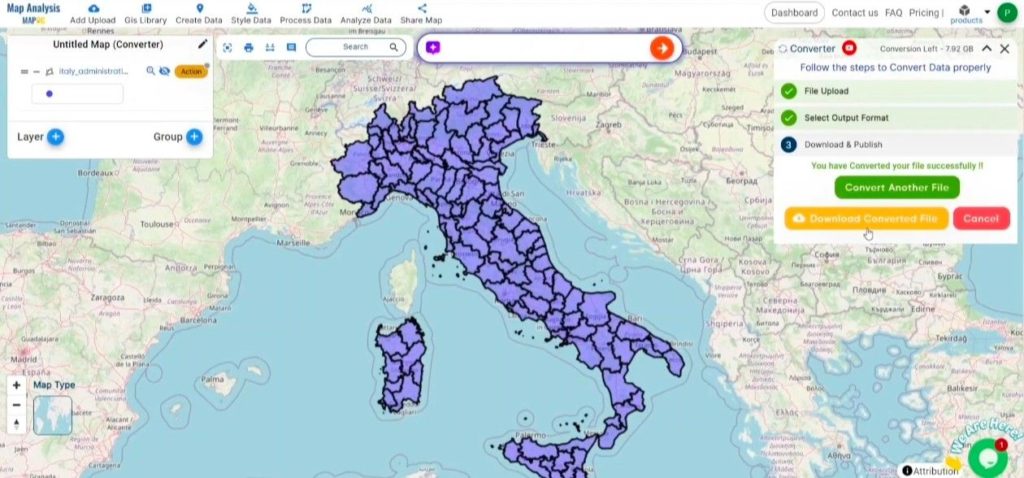
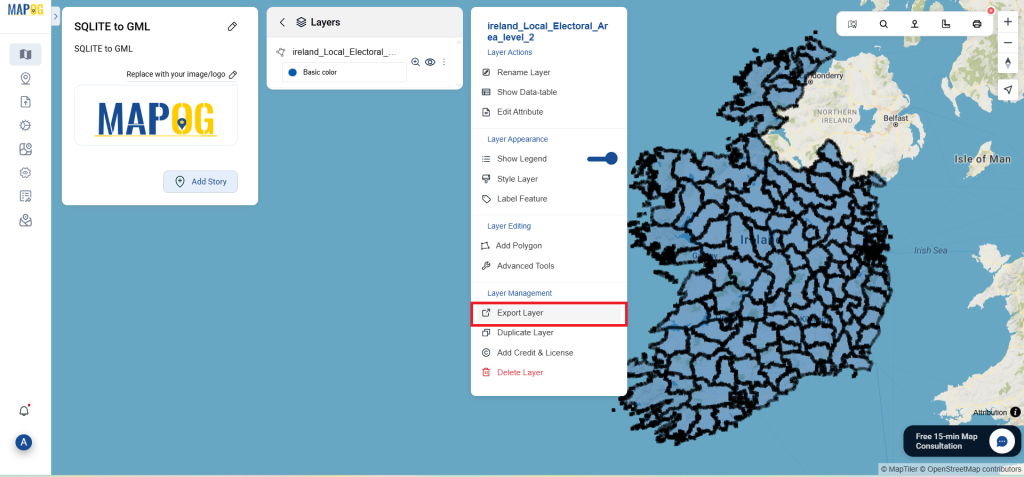
Step 4: Review and Download:
Once the conversion is finished, take a moment to examine your PNG file to confirm that the data has been accurately converted and preserved. Verify that the spatial details and layout are as expected. After ensuring the output meets your standards, go ahead and download the file. This final step ensures the conversion was successful and meets your project requirements.

Conclusion:
MAPOG Map Analysis provides a variety of powerful tools to enhance your workflow. These tools include the Clip Tool for refining datasets, the Basic Style Tool for styling numerical data, and the Create Point Tool for adding point features to your maps. Additionally, the Create Grid Tool offers the capability to generate grids using different data types, adding flexibility and functionality to your GIS projects.
Story by MAPOG:
MAPOG’s Story Map feature empowers users to create engaging, map-based narratives by combining geospatial data with text, images, and multimedia. This versatile tool can be applied in fields such as urban planning, tourism, education, and environmental conservation. With its customizable and interactive features, MAPOG offers unique insights into locations or themes, making complex spatial data easier to understand and share. Whether for professionals, educators, or students, this tool provides a user-friendly platform for exploring and presenting geographic information in a visually compelling way.
Other Feature Tools contain:
- Clip Tool
- Isochrones Tool
- Create Polygon Data
- Spatial Join
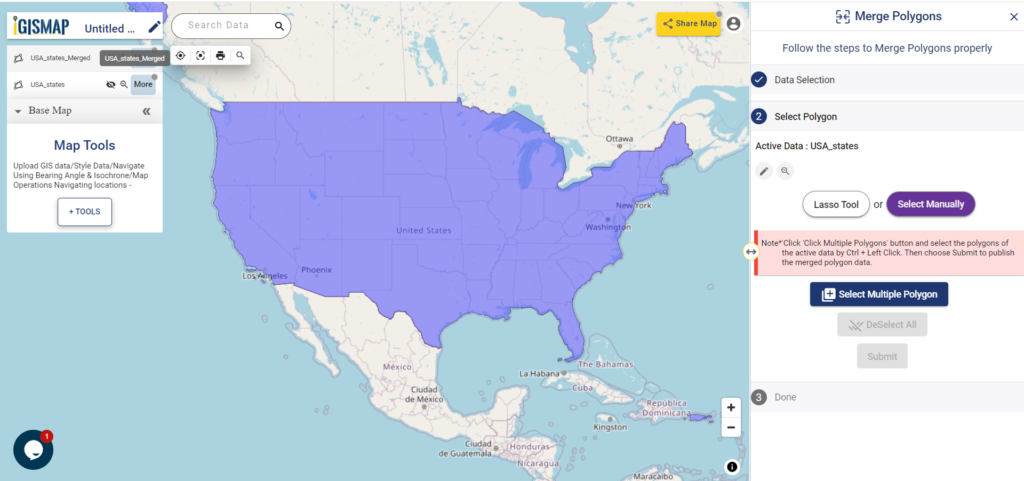
- Merge Polygon Tool
- Cross Intersection
- Nearest Neighbour
- Create Point Data
These blogs may also be useful for you:
- Convert Online Gis data : KML to PDF file
- Converting KML to GeoTIFF , Online Gis Data Converter
- Converting KMZ to SHP : Online GIS Data Conversion
- Converting TopoJSON to SHP Online : GIS Data Converter
- Converting GeoJSON to TopoJSON with MAPOG
- Converting GeoJSON to CSV with MAPOG
- Converting KMZ to KML with MAPOG
- Converting GML to KML with MAPOG