Owner and Director of a Private Limited company which serves individual to large scale industries in the field of Maps and GIS. He is a Gold Medalist in M.Tech(Spatial Information Technology) and owns some famous Technology blogs and website... Know more
In this guide, we’ll walk you through how to efficiently convert your KMZ files to GPX using the powerful Converter Tool in MAPOG. Whether you’re a beginner or an experienced user, Converting KMZ to GPX with MAPOG, this tutorial will help you understand the process in easy steps.
Key Concept of Converting files
The Converter Tool is a feature in MAPOG Map Analysis that helps you change your data from one format to another. It’s like magic! You give it your data in one form, and it transforms it into another form that you need for your analysis. Additionally, with GIS Data, you can download data in any format, making it versatile and adaptable for various applications.
Online KMZ to GPX GIS Converter
Now, let’s walk through the simple steps of using the Converter Tool to Converting KMZ to GPX with MAPOG.
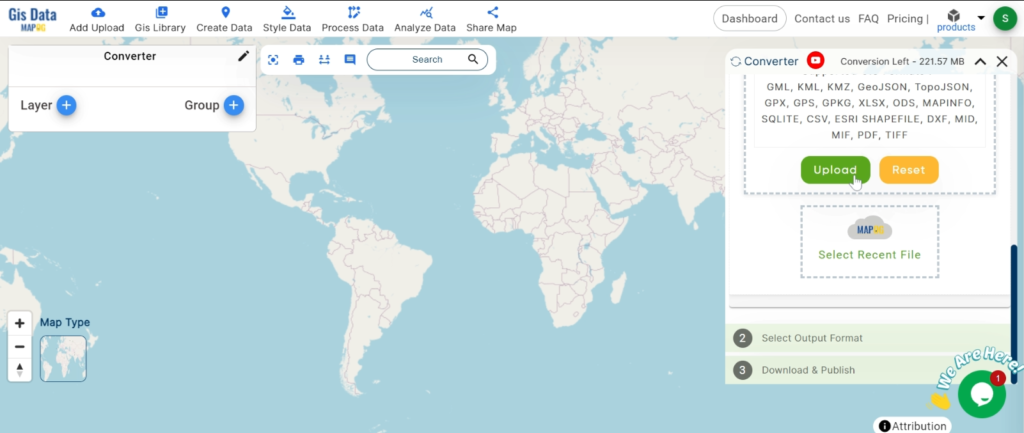
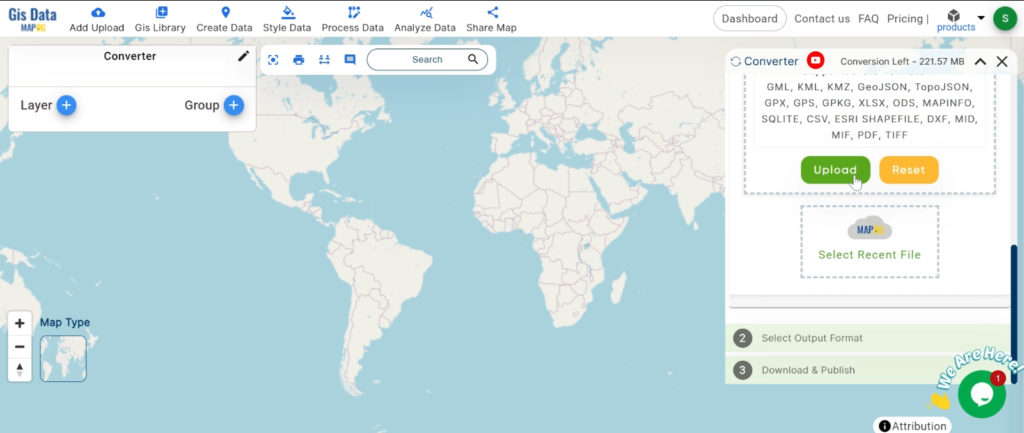
Step 1: Upload the Data
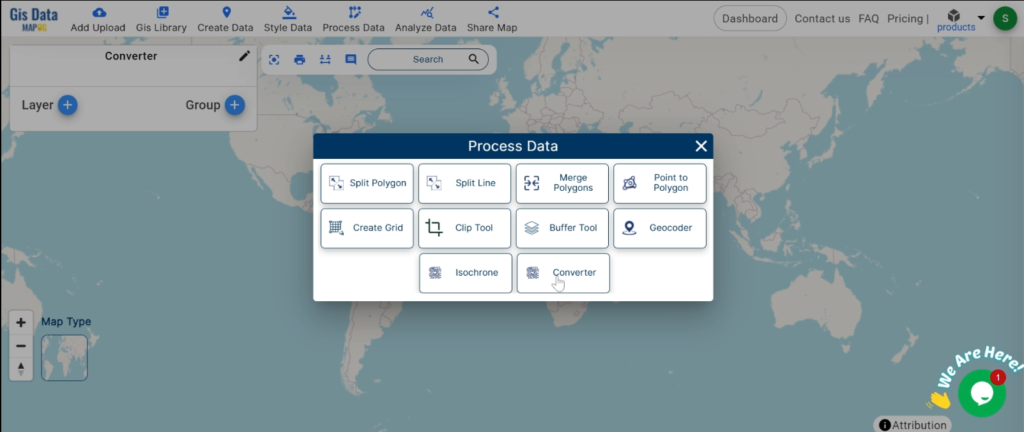
1. Click on the “Process Data” menu and choose the “Converter Tool” option.
2.Upload your KMZ file. This is your starting point where you provide the data that needs conversion.
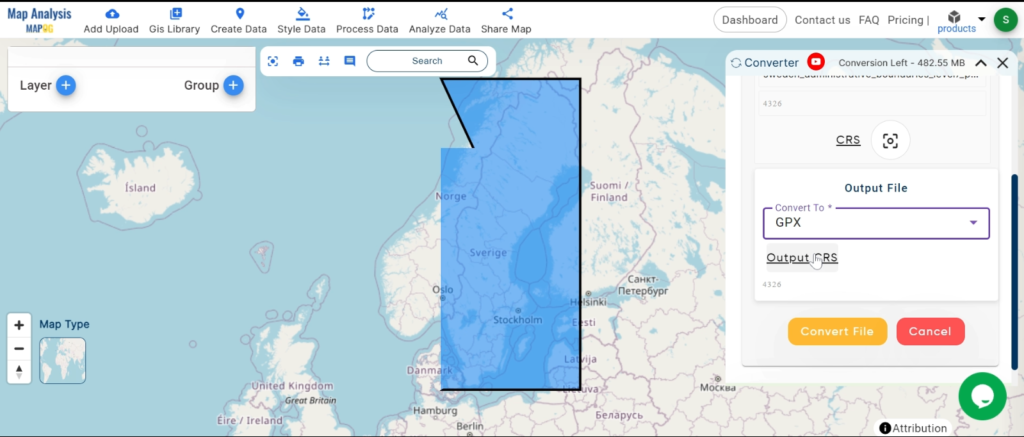
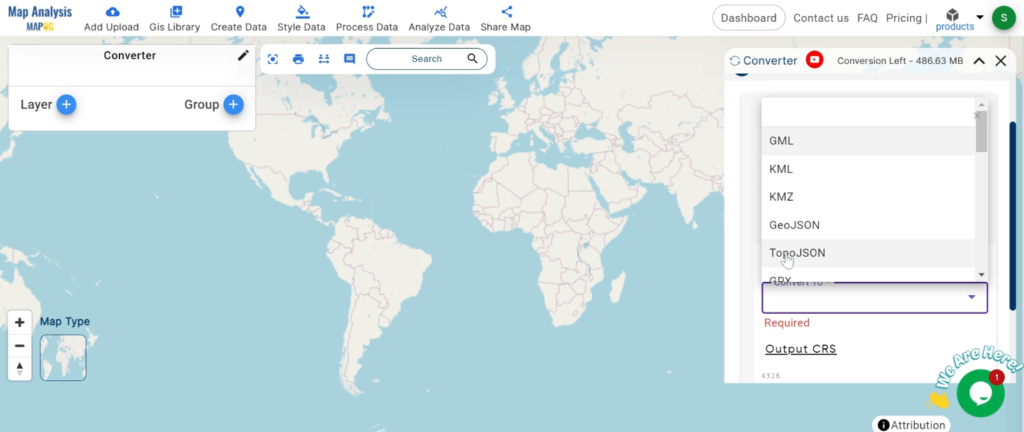
Step 2: Select the Format for Conversion
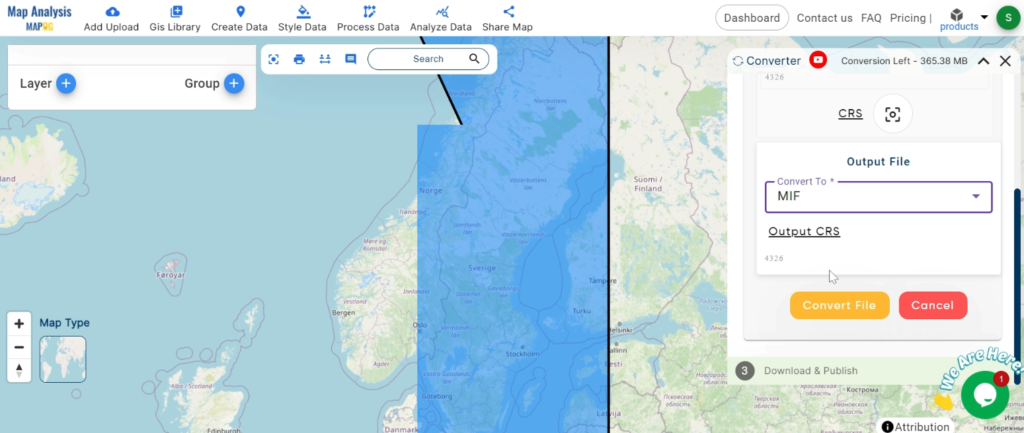
1.Choose the output file format as GPX. The tool offers various formats, but for this guide, we are focusing on converting to GPX.
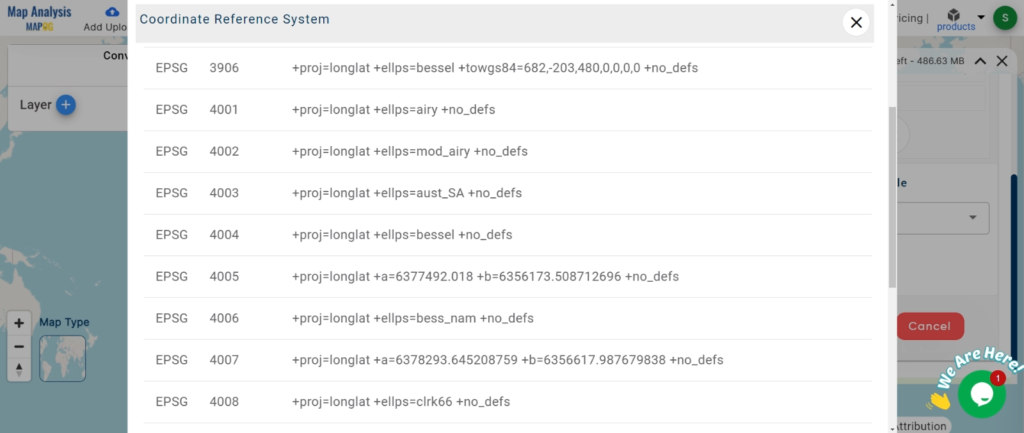
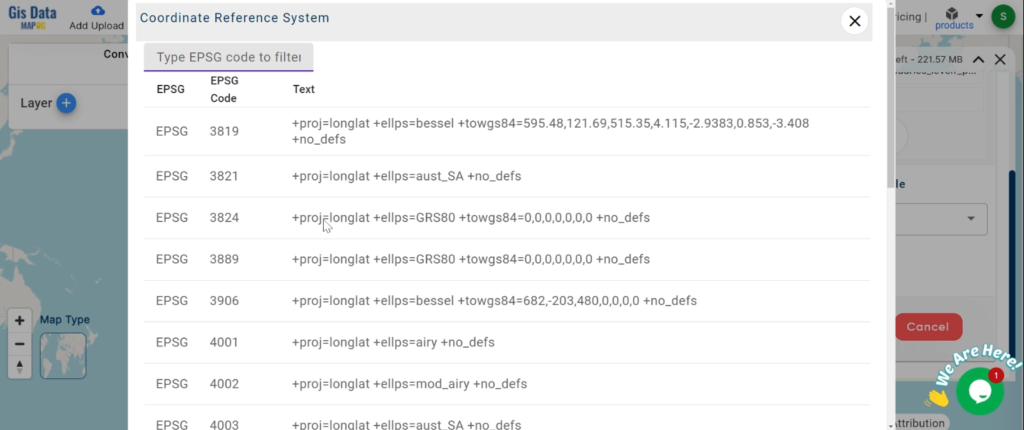
2.You can also set the CRS at this stage.
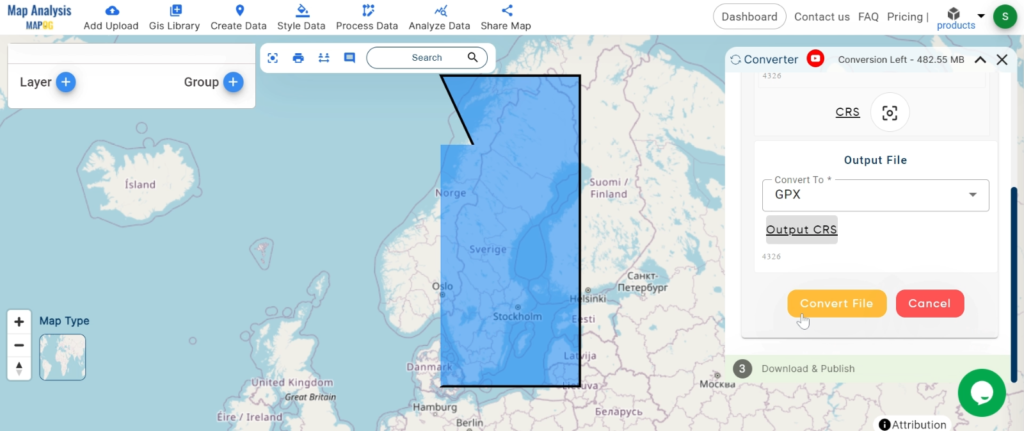
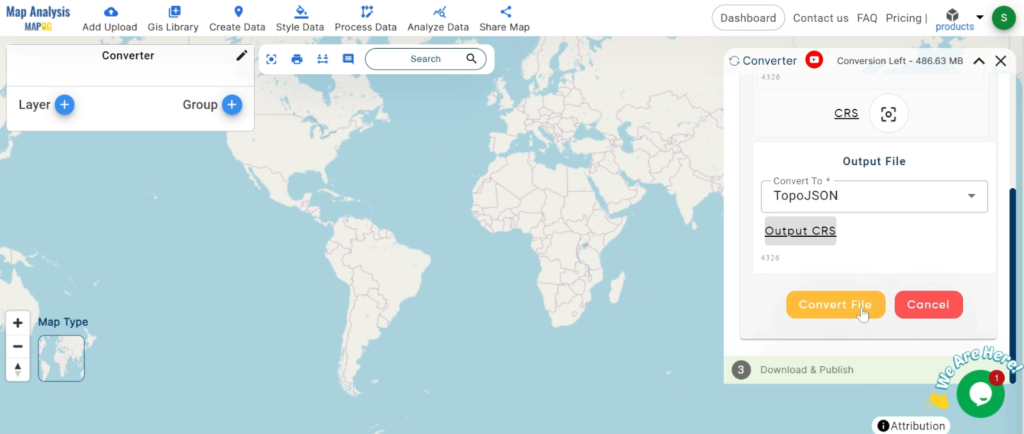
Step 3: Run the Conversion
Click ‘Convert’ and let the tool work its magic. The Converter Tool processes your data, transforming it from KMZ to GPX format.
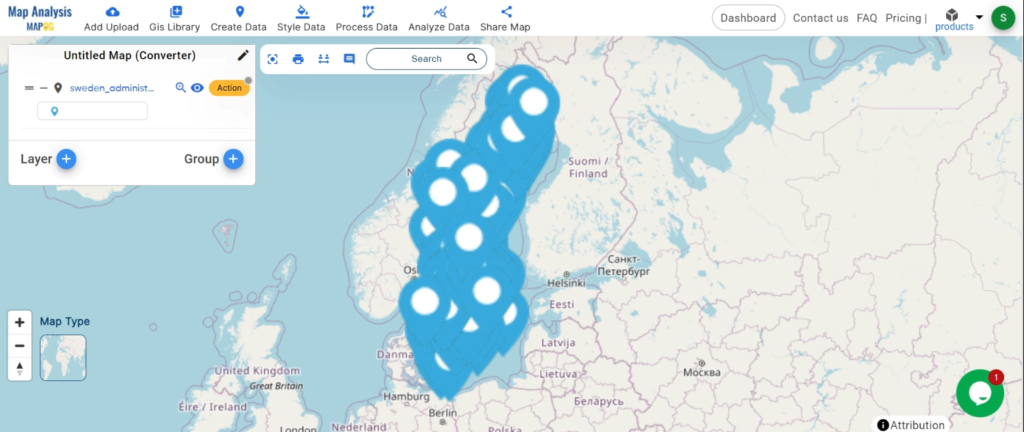
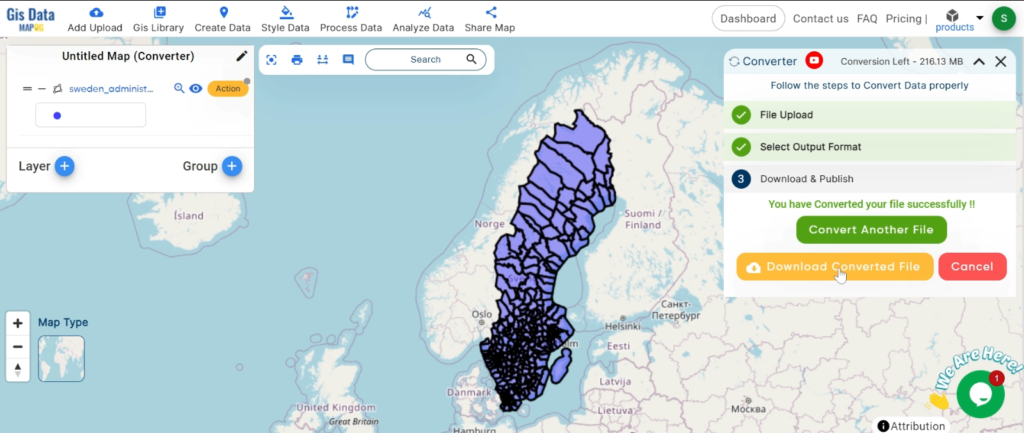
Step 4: Review and Download
Finally, review your converted GPX data to ensure it looks right. Once satisfied, download the converted file. This step is crucial to verify that the conversion has been successful and the data integrity is maintained.
And there you have it! You’ve successfully used the Converter Tool in MAPOG Map Analysis to convert your KMZ files to GPX. Now you can easily convert your data for all your analysis needs. This feature simplifies the process of handling different data formats, making your workflow more efficient and effective.
In this guide, we’ll walk you through how to efficiently convert your KMZ files to TopoJSON using the powerful Converter Tool in MAPOG. Whether you’re a beginner or an experienced user, Converting KMZ to TopoJSON with MAPOG, this tutorial will help you understand the process in easy steps.
Key Concept of Converting files
The Converter Tool is a feature in MAPOG Map Analysis that helps you change your data from one format to another. It’s like magic! You give it your data in one form, and it transforms it into another form that you need for your analysis. Additionally, with GIS Data, you can download data in any format, making it versatile and adaptable for various applications.
Online KMZ to TopoJSON GIS Converter
Now, let’s walk through the simple steps of using the Converter Tool to Converting KMZ to TopoJSON with MAPOG.
Step 1: Upload the Data
1. Click on the “Process Data” menu and choose the “Converter Tool” option.
2.Upload your KMZ file. This is your starting point where you provide the data that needs conversion.
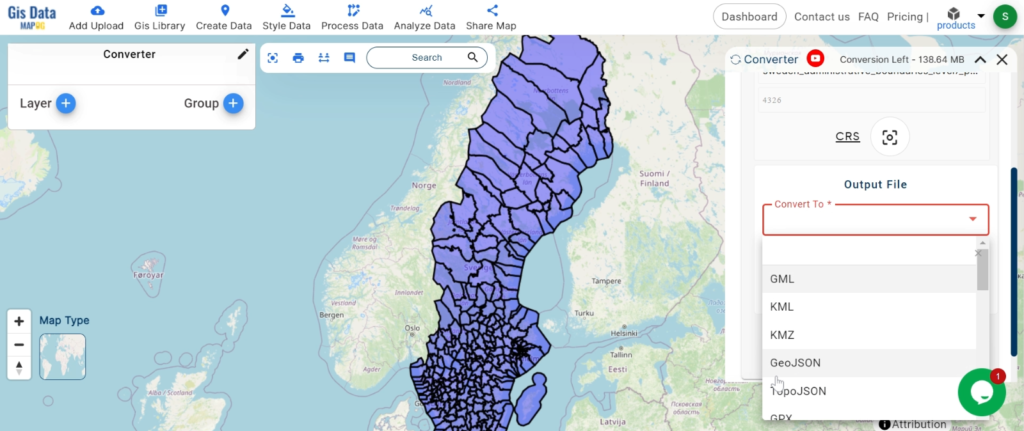
Step 2: Select the Format for Conversion
1.Choose the output file format as TopoJSON. The tool offers various formats, but for this guide, we are focusing on converting to TopoJSON.
2.You can also set the CRS at this stage.
Step 3: Run the Conversion
Click ‘Convert’ and let the tool work its magic. The Converter Tool processes your data, transforming it from KMZ to TopoJSON format.
Step 4: Review and Download
Finally, review your converted TopoJSON data to ensure it looks right. Once satisfied, download the converted file. This step is crucial to verify that the conversion has been successful and the data integrity is maintained.
And there you have it! You’ve successfully used the Converter Tool in MAPOG Map Analysis to convert your KMZ files to TopoJSON. Now you can easily convert your data for all your analysis needs. This feature simplifies the process of handling different data formats, making your workflow more efficient and effective.
KMZ to GeoJSON using MAPOG, you can transform your gis data, making it easier to analyze, share, and integrate into various GIS applications.
In this guide, we’ll walk you through how to efficiently convert your KMZ files to GeoJSON using the powerful Converter Tool in MAPOG . Whether you’re a beginner or an experienced user, Converting KMZ to GeoJSON with MAPOG, this tutorial will help you understand the process in easy steps.
Key Concept of Converting GIS format files
The Converter Tool is a feature in MAPOG Map Analysis that helps you change your data from one format to another. It’s like magic! You give it your data in one form, and it transforms it into another form that you need for your analysis. Additionally, with GIS Data, you can download data in any format, making it versatile and adaptable for various applications.
Online KMZ to GeoJSON GIS Converter
Now, let’s walk through the simple steps of using the Converter Tool to Converting KMZ to GeoJSON with MAPOG.
Step 1: Upload the Data
1. Click on the “Process Data” menu and choose the “Converter Tool” option.
2.Upload your KMZ file. This is your starting point where you provide the data that needs conversion.
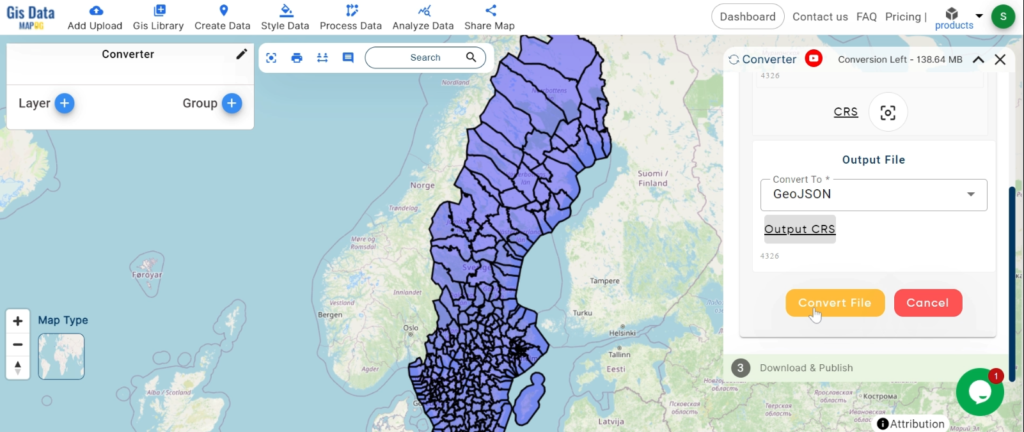
Step 2: Select the Format for Conversion
1.Choose the output file format as GeoJSON. The tool offers various formats, but for this guide, we are focusing on converting to GeoJSON.
2.You can also set the CRS at this stage.
Step 3: Run the Conversion
Click ‘Convert’ and let the tool work its magic. The Converter Tool processes your data, transforming it from KMZ to GeoJSON format.
Step 4: Review and Download
Finally, review your converted GeoJSON data to ensure it looks right. Once satisfied, download the converted file. This step is crucial to verify that the conversion has been successful and the data integrity is maintained.
And there you have it! You’ve successfully used the Converter Tool in MAPOG Map Analysis to convert your KMZ files to GeoJSON. Now you can easily convert your data for all your analysis needs. This feature simplifies the process of handling different data formats, making your workflow more efficient and effective.
KMZ to SHP using MAPOG, you can transform gis data, making it easier to analyze, share, and integrate into various GIS applications.
In this guide, we’ll walk you through how to efficiently convert your KMZ files to SHP using the powerful Converter Tool in MAPOG. Whether you’re a beginner or an experienced user, Converting KMZ to SHP with MAPOG, this tutorial will help you understand the process in easy steps.
Key Concept of Converting files
The Converter Tool is a feature in MAPOG Map Analysis that helps you change your data from one format to another. It’s like magic! You give it your data in one form, and it transforms it into another form that you need for your analysis. Additionally, with GIS Data, you can download data in any format, making it versatile and adaptable for various applications.
Online KMZ to SHP GIS Converter
Now, let’s walk through the simple steps of using the Converter Tool to Converting KMZ to SHP with MAPOG.
Step 1: Upload the Data
1. Click on the “Process Data” menu and choose the “Converter Tool” option.
2.Upload your KMZ file. This is your starting point where you provide the data that needs conversion.
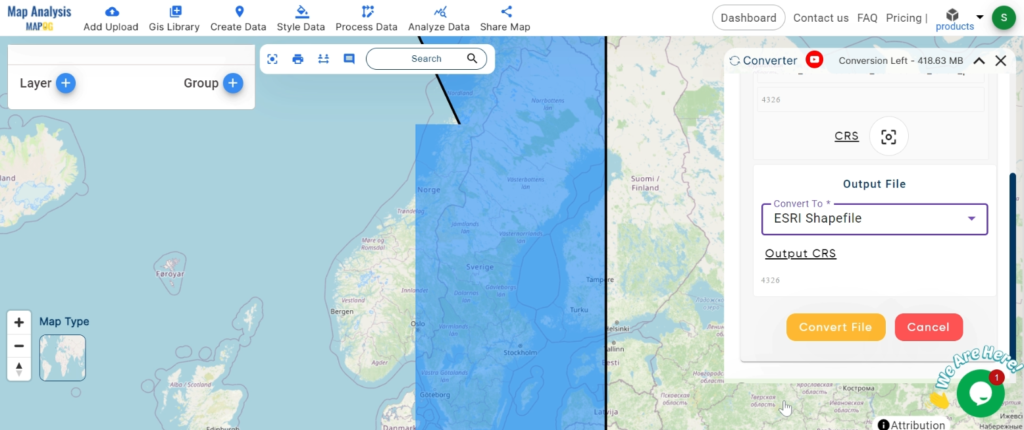
Step 2: Select the Format for Conversion
1.Choose the output file format as SHP. The tool offers various formats, but for this guide, we are focusing on converting to SHP.
2.You can also set the CRS at this stage.
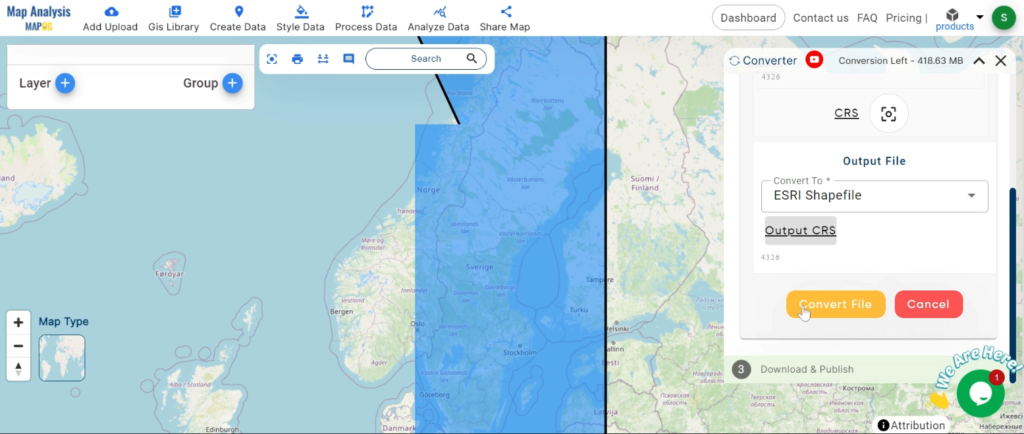
Step 3: Run the Conversion
Click ‘Convert’ and let the tool work its magic. The Converter Tool processes your data, transforming it from KMZ to SHP format.
Step 4: Review and Download
Finally, review your converted SHP data to ensure it looks right. Once satisfied, download the converted file. This step is crucial to verify that the conversion has been successful and the data integrity is maintained.
And there you have it! You’ve successfully used the Converter Tool in MAPOG Map Analysis to convert your KMZ files to SHP. Now you can easily convert your data for all your analysis needs. This feature simplifies the process of handling different data formats, making your workflow more efficient and effective.
In this guide, we’ll walk you through how to efficiently convert your KMZ files to MIF using the powerful Converter Tool in MAPOG. Whether you’re a beginner or an experienced user, Converting KMZ to MIF with MAPOG, this tutorial will help you understand the process in easy steps.
Key Concept of Converting files
The Converter Tool is a feature in MAPOG Map Analysis that helps you change your data from one format to another. It’s like magic! You give it your data in one form, and it transforms it into another form that you need for your analysis. Additionally, with GIS Data, you can download data in any format, making it versatile and adaptable for various applications.
Online KMZ to MID GIS Converter
Now, let’s walk through the simple steps of using the Converter Tool to Converting KMZ to MIF with MAPOG.
Step 1: Upload the Data
1. Click on the “Process Data” menu and choose the “Converter Tool” option.
2.Upload your KMZ file. This is your starting point where you provide the data that needs conversion.
Step 2: Select the Format for Conversion
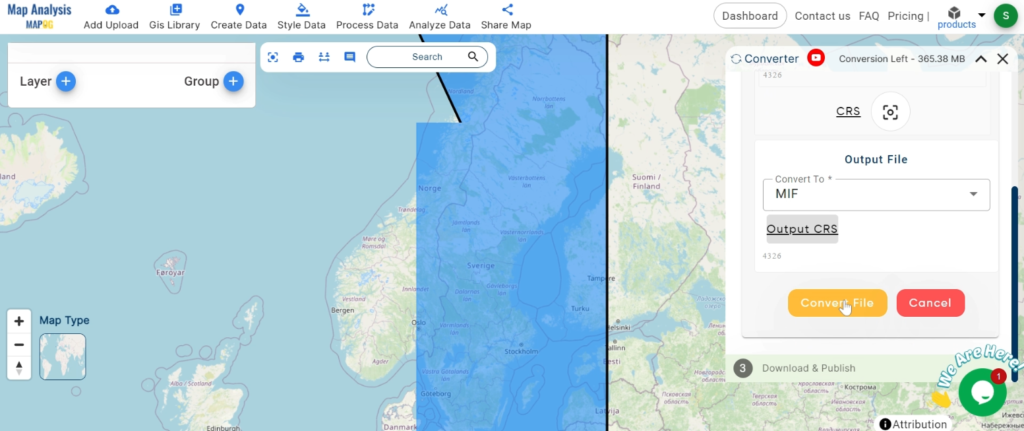
1.Choose the output file format as MIF. The tool offers various formats, but for this guide, we are focusing on converting to MIF.
2.You can also set the CRS at this stage.
Step 3: Run the Conversion
Click ‘Convert’ and let the tool work its magic. The Converter Tool processes your data, transforming it from KMZ to MIF format.
Step 4: Review and Download
Finally, review your converted MIF data to ensure it looks right. Once satisfied, download the converted file. This step is crucial to verify that the conversion has been successful and the data integrity is maintained.
And there you have it! You’ve successfully used the Converter Tool in MAPOG Map Analysis to convert your KMZ files to MIF. Now you can easily convert your data for all your analysis needs. This feature simplifies the process of handling different data formats, making your workflow more efficient and effective.
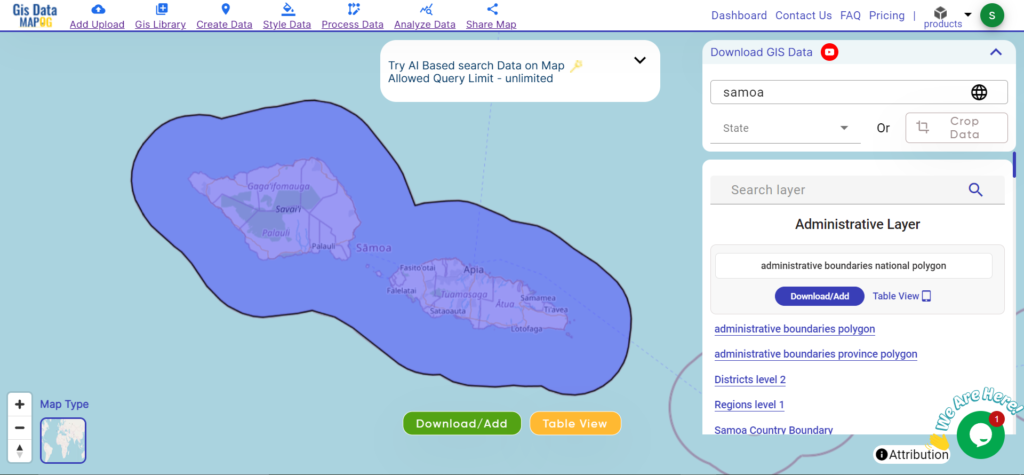
Unlock a world of geospatial insights with MAPOG, your gateway to Download Samoa Administrative Boundary GIS Data. Dive into a treasure trove of datasets covering national, administrative divisions, and more.
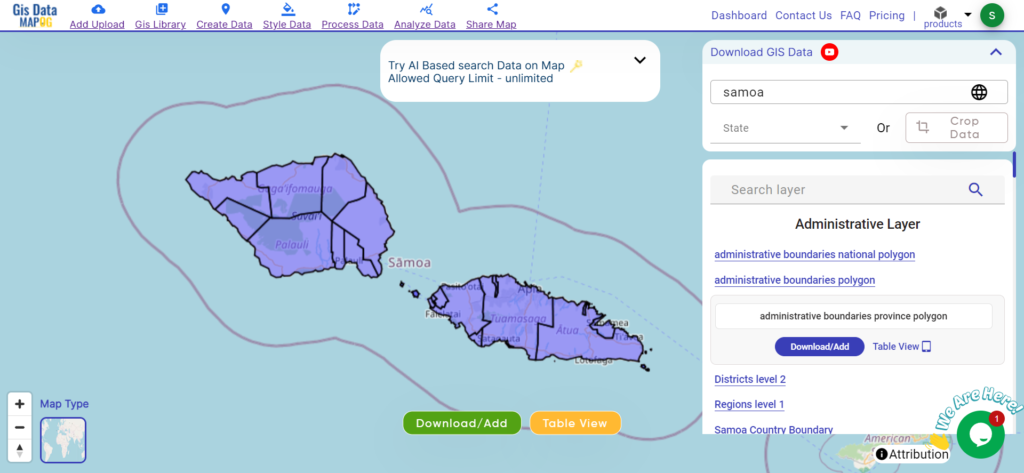
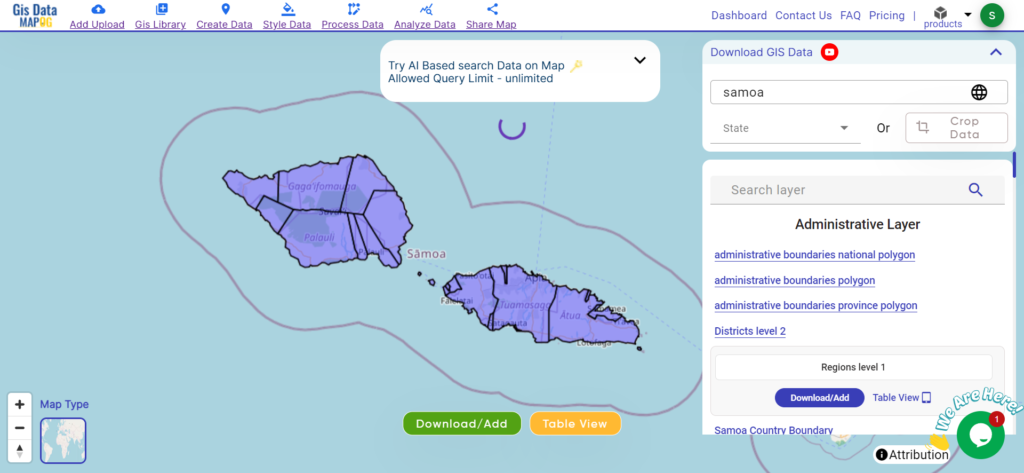
Navigating and Download Samoa Administrative Boundary GIS Data is seamless with MAPOG. Access over 150 meticulously curated datasets detailing administrative boundaries and geographic features such as coastlines, roads, and conservation areas. Our platform offers intuitive tools for effortless exploration: Download GIS Data and Add GIS Data. With the Download GIS Data tool, choose from a variety of formats like Shapefile, KML, GeoJSON, or CSV to obtain the precise data you need. Need guidance on using the Add GIS Data tool? Consult our comprehensive guide for step-by-step instructions. Let MAPOG be your trusted companion on an enriching geospatial journey through the breathtaking landscapes of Samoa.
Our platform supports an extensive range of data formats, including KML, SHP, CSV, GeoJSON, Tab, SQL, Tiff, GML, KMZ, GPKZ, SQLITE, Dxf, MIF, TOPOJSON, XLSX, GPX, ODS, MID, and GPS, ensuring seamless compatibility and accessibility across different analyses.
Note:
all data provided by MAPOG are in GCS datum EPSG:4326 WGS84 CRS (Coordinate Reference System).
access to shapefile downloads requires logging in to the platform.
Download Data of Samoa
Samoa, nestled in the heart of the South Pacific Ocean, offers a captivating blend of natural beauty and cultural heritage. Known for its lush landscapes, vibrant culture, and friendly people, Samoa is a paradise for nature lovers and adventurers.
Samoa is divided into distinct administrative areas, each with its own unique characteristics and governance structures. Delve into the administrative boundaries and geographic features of these divisions to gain a deeper understanding of their diversity and importance.
Explore the administrative boundaries, road networks, and key geographic features of Samoa, renowned for its stunning beaches, volcanic mountains, and rich marine life.
Disclaimer : If you find any shapefile data of country provided is incorrect do contact us or comment below, so that we will correct the same in our system as well we will try to correct the same in openstreetmap.
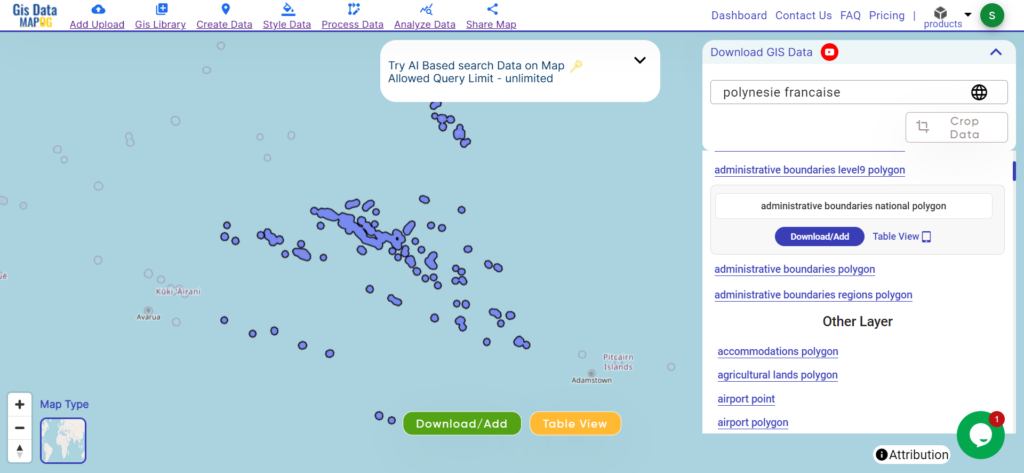
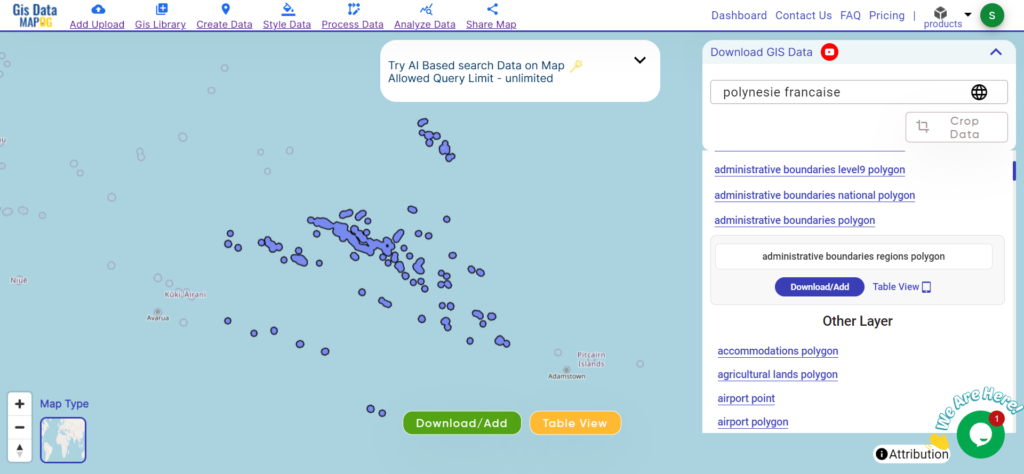
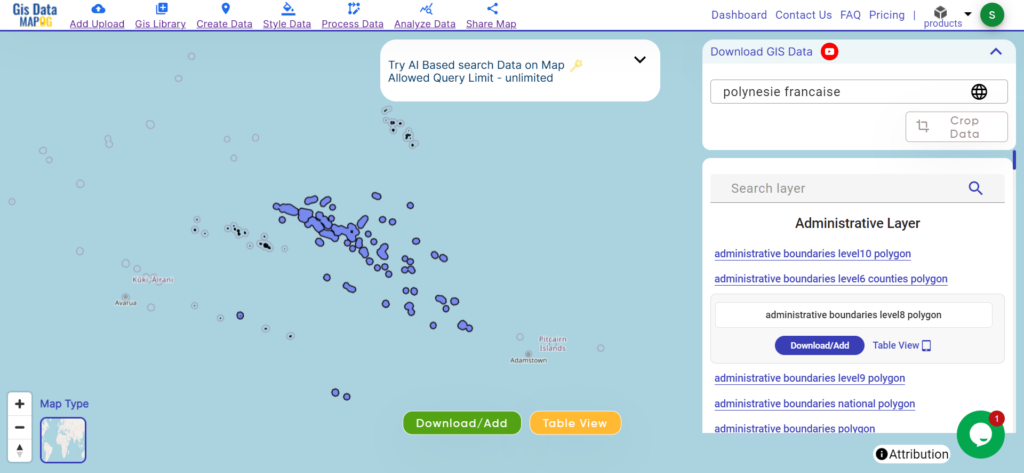
Unlock a world of geospatial insights with MAPOG, your gateway to Download Polynesie Francaise Administrative Boundary GIS Data. Dive into a treasure trove of datasets covering national boundaries, regions, villages, and more.
Navigating French Polynesia’s GIS data is seamless with MAPOG. Access over 150 meticulously curated datasets detailing Download Polynesie Francaise Administrative Boundary GIS Data and geographic features such as rivers, roads, and national parks.
Our platform supports an extensive range of data formats, including KML, SHP, CSV, GeoJSON, Tab, SQL, Tiff, GML, KMZ, GPKZ, SQLITE, Dxf, MIF, TOPOJSON, XLSX, GPX, ODS, MID, and GPS, ensuring seamless compatibility and accessibility across different analyses.
Note:
all data provided by MAPOG are in GCS datum EPSG:4326 WGS84 CRS (Coordinate Reference System).
Additionally, access to shapefile downloads requires logging in to the platform.
Download Data of French Polynesia
French Polynesia, a collection of over 100 islands in the South Pacific, offers a captivating blend of natural beauty and cultural heritage. Known for its crystal-clear lagoons, volcanic mountains, and vibrant marine life, French Polynesia includes renowned islands such as Tahiti, Bora Bora, and Moorea. The region is celebrated for its rich Polynesian culture, stunning landscapes, and unique biodiversity.
Download Polynesie Francaise Administrative Boundary Islands Data
French Polynesia is divided into several islands, each with its own unique cultural, geographical, and historical significance. These islands play a vital role in decentralized governance and regional development efforts. Delve into the administrative boundaries and geographic features of French Polynesia’s islands to gain a deeper understanding of their diversity and importance.
Download Polynesie Francaise Administrative Boundary Villages Shapefile Data
French Polynesia is composed of numerous villages, each encapsulating a unique blend of cultural heritage, geographical features, and administrative significance. These villages serve as fundamental units of local governance and are essential for regional development efforts. Delve into the administrative boundaries and geographic features of French Polynesia’s villages to gain a deeper understanding of their diversity and importance.
Disclaimer : If you find any shapefile data of country provided is incorrect do contact us or comment below, so that we will correct the same in our system as well we will try to correct the same in openstreetmap.
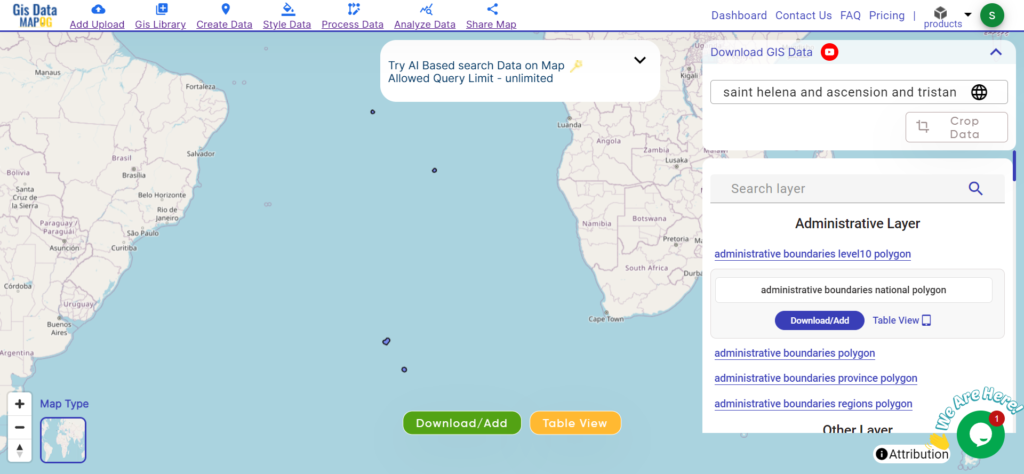
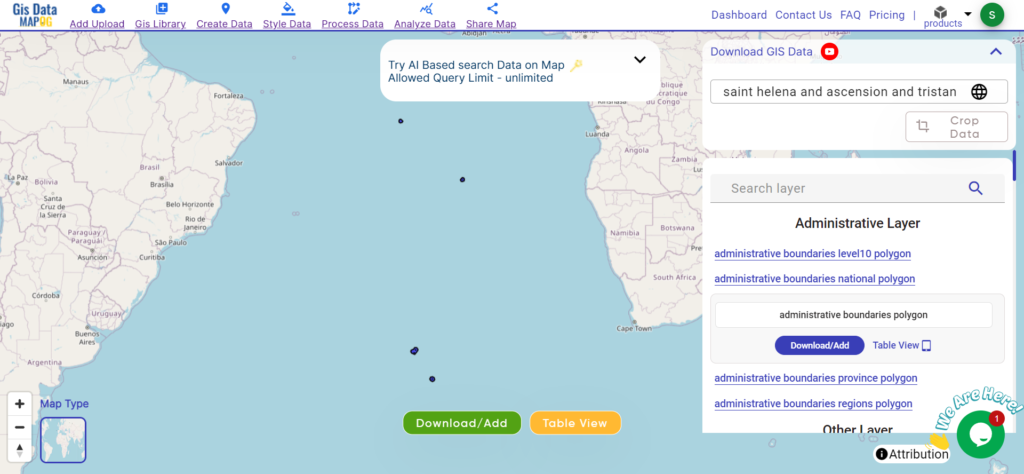
Unlock a world of geospatial insights with MAPOG, your gateway to Saint Helena And Ascension And Tristan Da Cunha Administrative Boundary GIS Data. Dive into a treasure trove of datasets covering national, administrative divisions, and more.
Navigating the Saint Helena And Ascension And Tristan Da Cunha’s Administrative Boundary GIS Data is seamless with MAPOG. Access over 150 meticulously curated datasets detailing administrative boundaries. The geographic features such as coastlines, roads and conservation areas. Our platform offers intuitive tools for effortless exploration: Download GIS Data and Add GIS Data. With the Download GIS Data tool, choose from a variety of formats like Shapefile, KML, GeoJSON, or CSV to obtain the precise data you need. Need guidance on using the Add GIS Data tool? Consult our comprehensive guide for step-by-step instructions. Let MAPOG be your trusted companion on an enriching geospatial journey through the breathtaking landscapes of Saint Helena, Ascension, and Tristan da Cunha’s Data.
Our platform supports an extensive range of data formats, including KML, SHP, CSV, GeoJSON, Tab, SQL, Tiff, GML, KMZ, GPKZ, SQLITE, Dxf, MIF, TOPOJSON, XLSX, GPX, ODS, MID, and GPS, ensuring seamless compatibility and accessibility across different analyses.
Note:
all data provided by MAPOG are in GCS datum EPSG:4326 WGS84 CRS (Coordinate Reference System).
access to shapefile downloads requires logging in to the platform.
Download Data of Saint Helena, Ascension, and Tristan da Cunha’s GIS Data
000Saint Helena, Ascension, and Tristan da Cunha, nestled in the South Atlantic Ocean, offer a captivating blend of natural beauty and historical significance. These remote territories are known for their rugged landscapes, unique flora and fauna, and rich maritime heritage.
Saint Helena, Ascension, and Tristan da Cunha are divided into distinct administrative areas, each with its own unique characteristics and governance structures. Delve into the administrative boundaries and geographic features of these divisions to gain a deeper understanding of their diversity and importance.
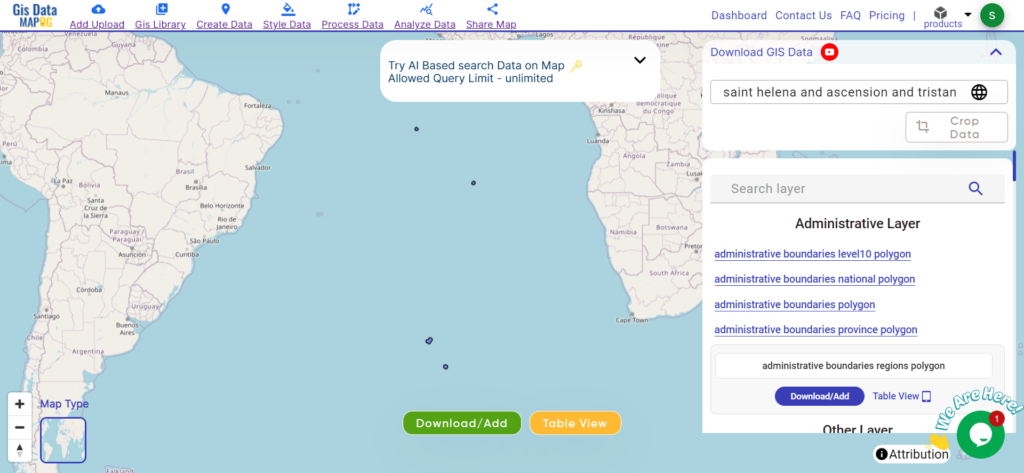
Saint Helena Saint Helena And Ascension And Tristan Da Cunha regions Shapefile
Access detailed GIS data of Ascension Island, known for its strategic military installations and diverse wildlife, including significant bird populations
Saint Helena Saint Helena And Ascension And Tristan Da Cunha regions Shapefile
Above all links are provided for GIS data of Saint Helena, Ascension And Tristan Da Cunha if you are looking for any specific data please write us on support@mapog.com
Disclaimer : If you find any shapefile data of country provided is incorrect do contact us or comment below, so that we will correct the same in our system as well we will try to correct the same in openstreetmap.
Access North Korea’s GIS data: national, provincial, district boundaries, and more. Download in formats like Shapefile, KML, GeoJSON, CSV via MAPOG.
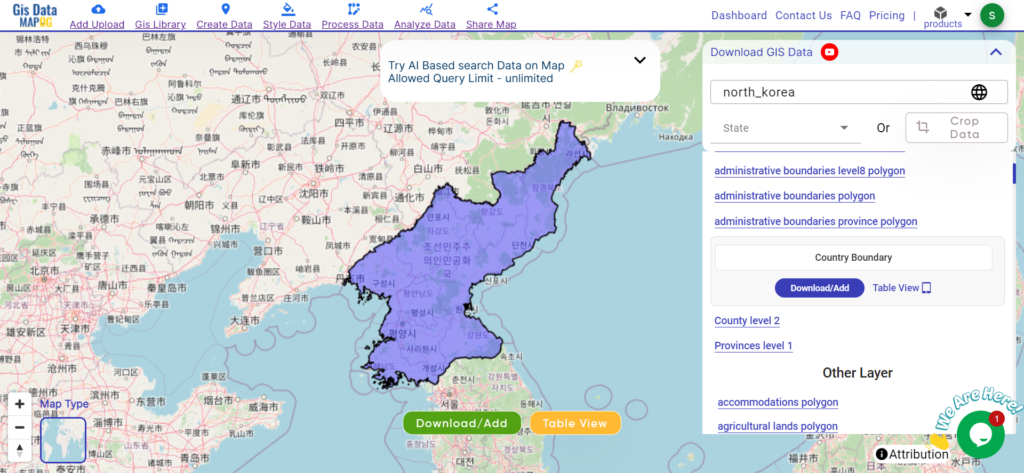
Unlock a wealth of geospatial insights with MAPOG, your gateway to Download North Korea Administrative Boundary GIS Data. Embark on a journey through the secretive landscapes of North Korea with access to a diverse range of datasets covering national, provincial, district boundaries, and more.
Navigating North Korea’s GIS data is effortless with MAPOG. Explore over 200 meticulously curated datasets detailing administrative boundaries and geographic features such as rivers, roads, and national landmarks. Our platform offers intuitive tools for seamless exploration: Download North Korea Administrative Boundary GIS Data and Add GIS Data. With the Download GIS Data tool, choose from a variety of formats like Shapefile, KML, GeoJSON, or CSV to obtain the precise data you need. Need guidance on using the Add GIS Data tool? Consult our comprehensive guide for step-by-step instructions. Let MAPOG be your trusted companion on an enriching geospatial journey through North Korea’s enigmatic terrain.
Our platform supports an extensive range of data formats, including KML, SHP, CSV, GeoJSON, Tab, SQL, Tiff, GML, KMZ, GPKZ, SQLITE, Dxf, MIF, TOPOJSON, XLSX, GPX, ODS, MID, and GPS, ensuring seamless compatibility and accessibility across different analyses.
Note:
all data provided by MAPOG are in GCS datum EPSG:4326 WGS84 CRS (Coordinate Reference System).
Additionally, access to shapefile downloads requires logging in to the platform.
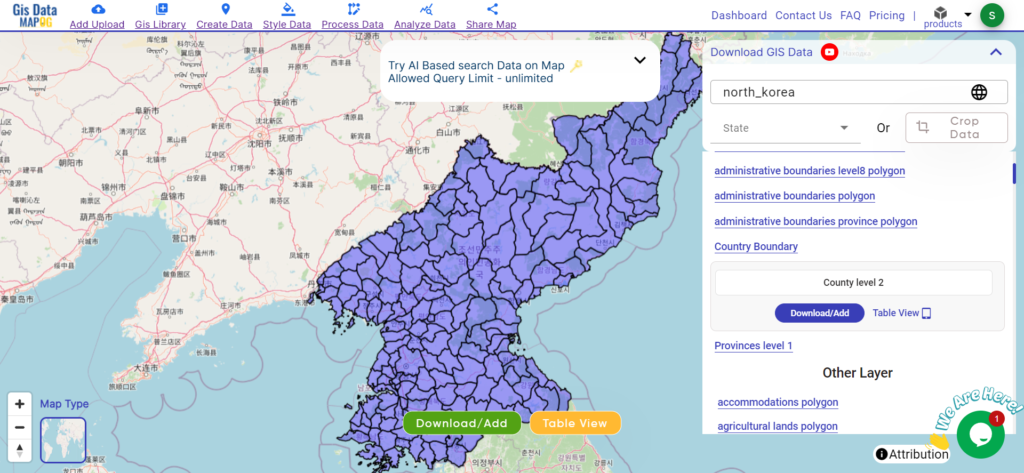
Download Data of North Korea
North Korea, shrouded in mystery, offers a fascinating blend of rugged landscapes and unique cultural heritage. Bordered by China, Russia, and South Korea, it boasts diverse terrain, from mountainous regions to coastal plains. Explore North Korea’s rich geography, including iconic landmarks such as Mount Paektu, the birthplace of Kim Il-sung in Mangyongdae, and the capital city of Pyongyang.
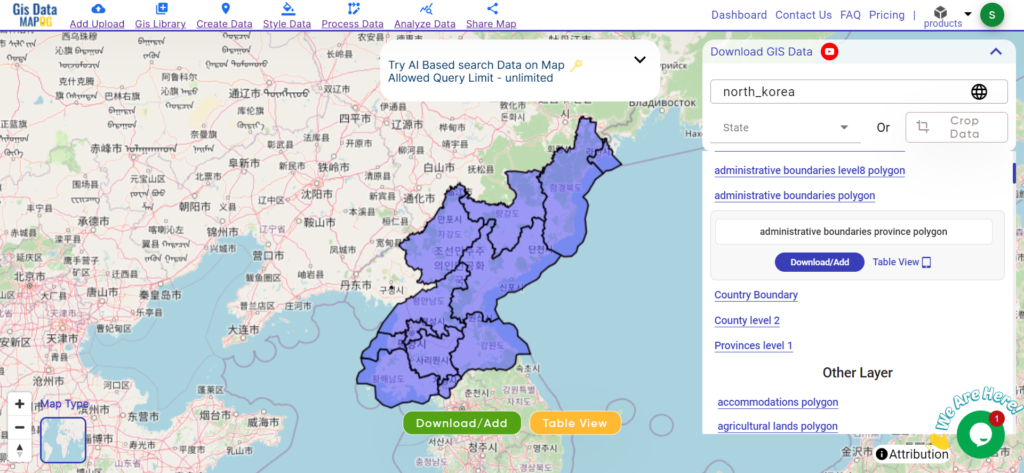
North Korea is divided into nine provinces, each with its distinct cultural, geographical, and historical significance. These provinces play a crucial role in the country’s governance and regional development efforts. Delve into the administrative boundaries and geographic features of North Korea’s provinces to gain a deeper understanding of their diversity and importance. Here are North Korea’s nine provinces:
North Korea comprises multiple districts, each encapsulating a unique blend of cultural heritage, geographical features, and administrative significance. These districts serve as fundamental units of governance and are essential for regional development efforts. Delve into the administrative boundaries and geographic features of North Korea’s districts to gain a deeper understanding of their diversity and importance.
Disclaimer : If you find any shapefile data of country provided is incorrect do contact us or comment below, so that we will correct the same in our system as well we will try to correct the same in openstreetmap.
Unlock Sao Tome and Principe’s GIS data: national boundaries, provincial, and district divisions in various formats with MAPOG.
Unlock a world of geospatial insights with MAPOG, your gateway to Download Sao Tome And Principe Administrative Boundary GIS Data. Dive into a treasure trove of datasets covering national, administrative divisions, and more.
Navigating and Download Sao Tome And Principe Administrative Boundary GIS Data is seamless with MAPOG. Access over 150 meticulously curated datasets detailing administrative boundaries and geographic features such as coastlines, roads, and conservation areas. Our platform offers intuitive tools for effortless exploration: Download GIS Data and Add GIS Data. With the Download GIS Data tool, choose from a variety of formats like Shapefile, KML, GeoJSON, or CSV to obtain the precise data you need. Need guidance on using the Add GIS Data tool? Consult our comprehensive guide for step-by-step instructions. Let MAPOG be your trusted companion on an enriching geospatial journey through the breathtaking landscapes of Sao Tome and Principe.
Our platform supports an extensive range of data formats, including KML, SHP, CSV, GeoJSON, Tab, SQL, Tiff, GML, KMZ, GPKZ, SQLITE, Dxf, MIF, TOPOJSON, XLSX, GPX, ODS, MID, and GPS, ensuring seamless compatibility and accessibility across different analyses.
Note:
all data provided by MAPOG are in GCS datum EPSG:4326 WGS84 CRS (Coordinate Reference System).
access to shapefile downloads requires logging in to the platform.
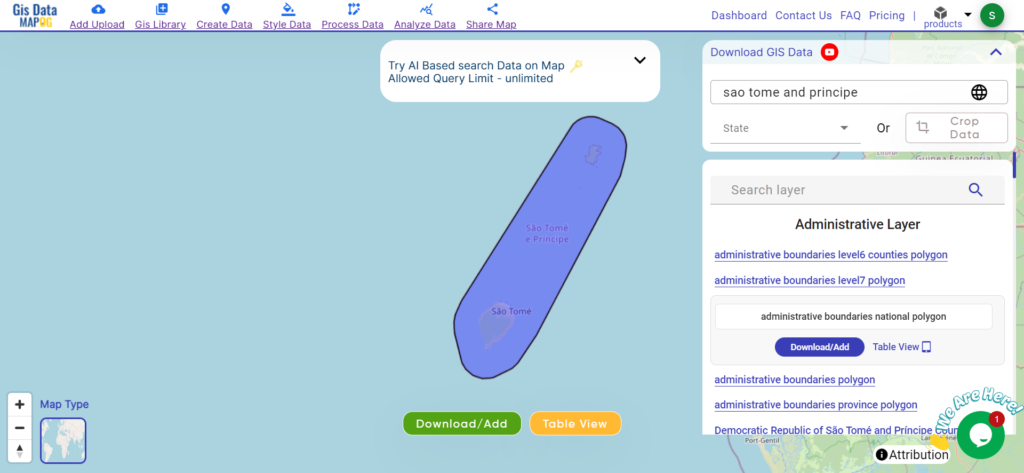
Download Data of Sao Tome and Principe
Sao Tome and Principe, nestled in the Gulf of Guinea, offer a captivating blend of natural beauty and cultural heritage. Known for their lush rainforests, pristine beaches, and colonial architecture, these islands are a paradise for nature lovers and adventurers.
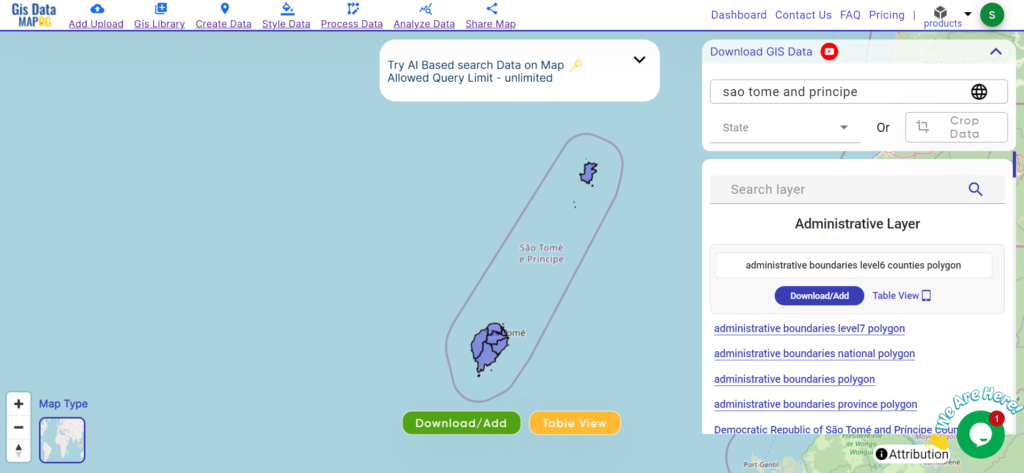
Explore Sao Tome and Principe’s provincial divisions, each encapsulating unique cultural and geographical features. Delve into the administrative boundaries and geographic features of these provinces to gain a deeper understanding of their diversity and importance.
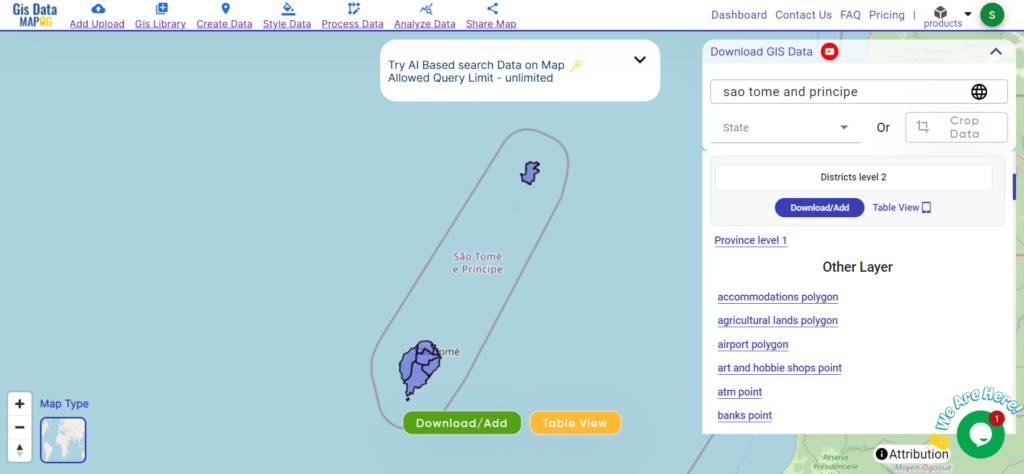
Discover the district boundaries of Sao Tome and Principe, fundamental units of governance and essential for regional development efforts. Delve into the administrative boundaries and geographic features of these districts to gain insights into their significance and diversity.
Disclaimer : If you find any shapefile data of country provided is incorrect do contact us or comment below, so that we will correct the same in our system as well we will try to correct the same in openstreetmap.
Loading Comments...
We use cookies to ensure that we give you the best experience on our website. If you continue to use this site we will assume that you are happy with it.