Geospatial data conversion is essential for ensuring that your data is usable across different platforms and devices. TOPOJSON is a compact and efficient format for encoding geographic features, while GPS-compatible formats, such as GPX, are widely used for navigation, tracking, and geolocation. Converting TOPOJSON to a GPS-compatible format allows for easy integration with GPS devices and applications.
What is TOPOJSON?
TopoJSON is a compact format for encoding geographic data, similar to GeoJSON, but with one key difference—it efficiently represents shared boundaries between features. Instead of storing duplicate geometry, TopoJSON stores topological relationships, making files smaller and ideal for visualizing complex maps. It’s commonly used for creating high-performance, web-based maps.
Key Concept for Conversion TOPOJSON to GPS:
MAPOG ‘s Converter Tool provides a user-friendly platform for converting geospatial data between various formats. Here’s a step-by-step guide to converting TOPOJSON files to GPS-compatible formats like GPX using the MAPOG tool.
Step-by-Step Guide to Converting TOPOJSON to GPS Format
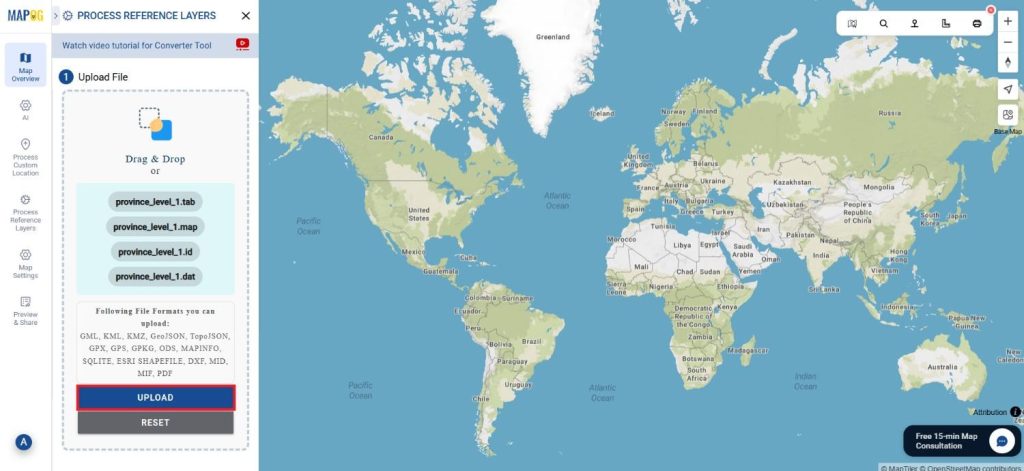
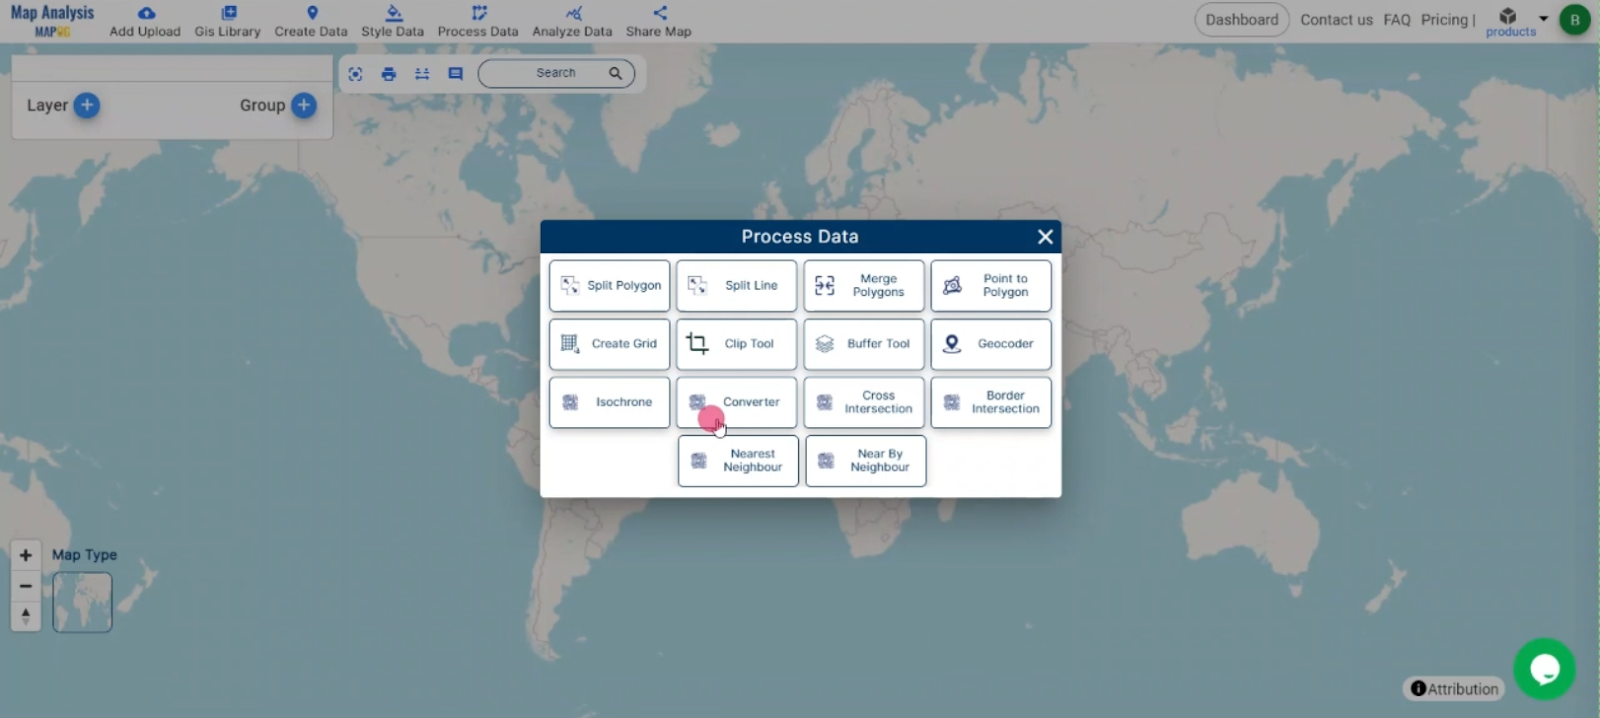
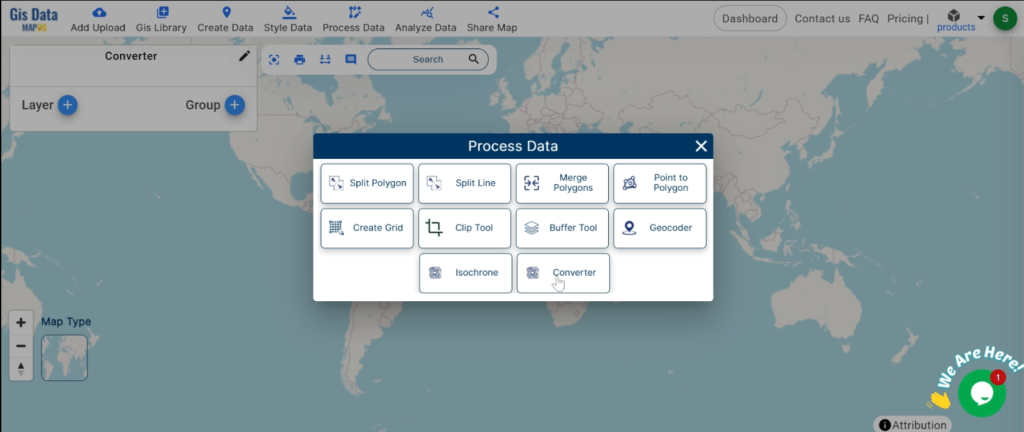
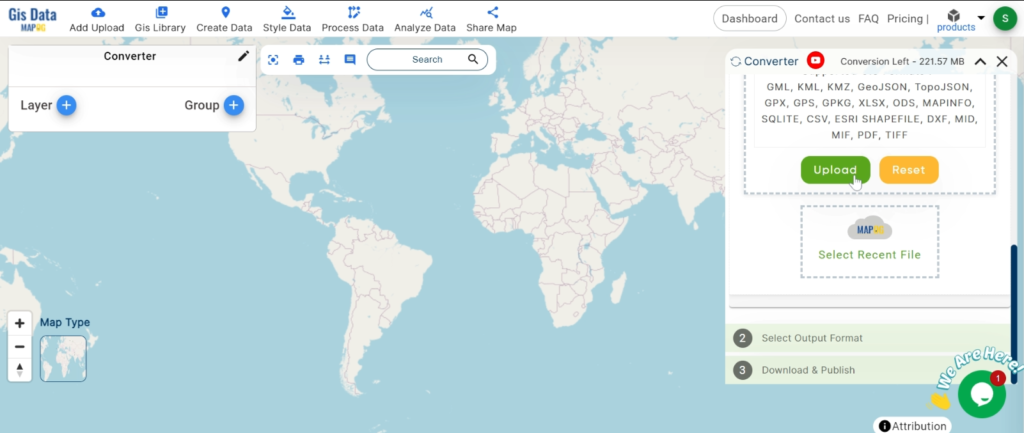
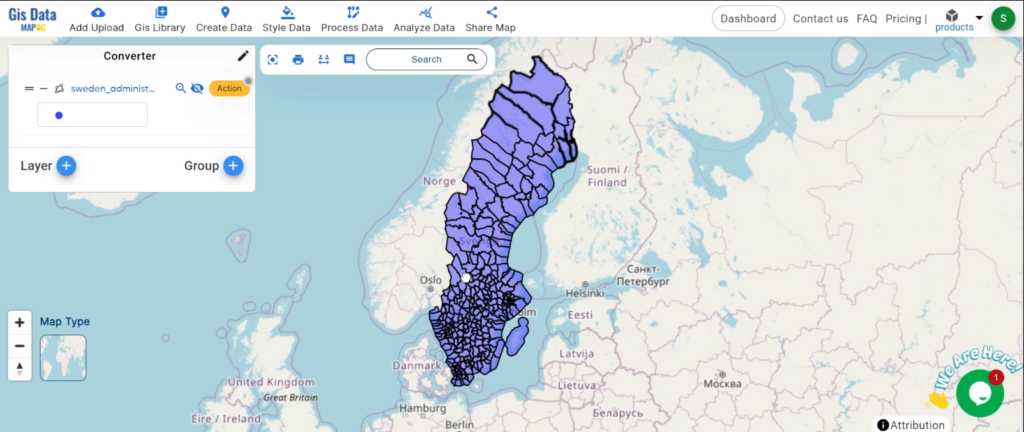
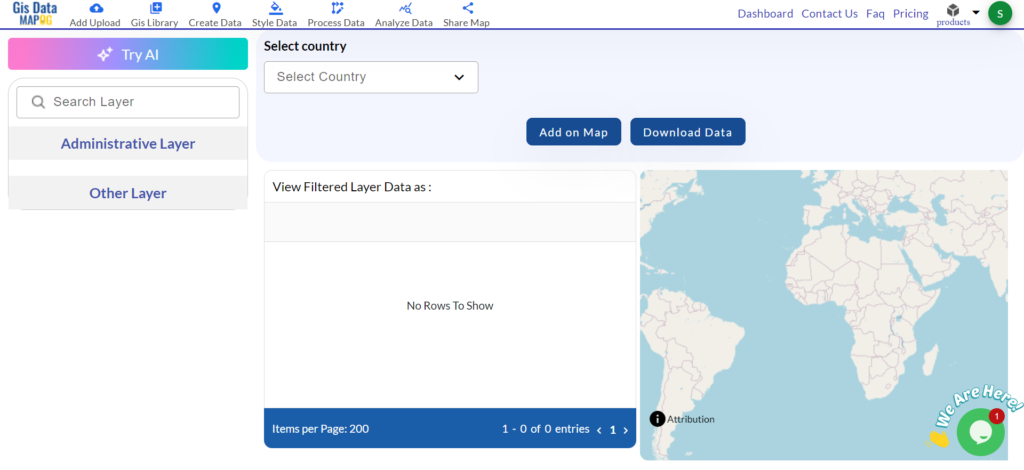
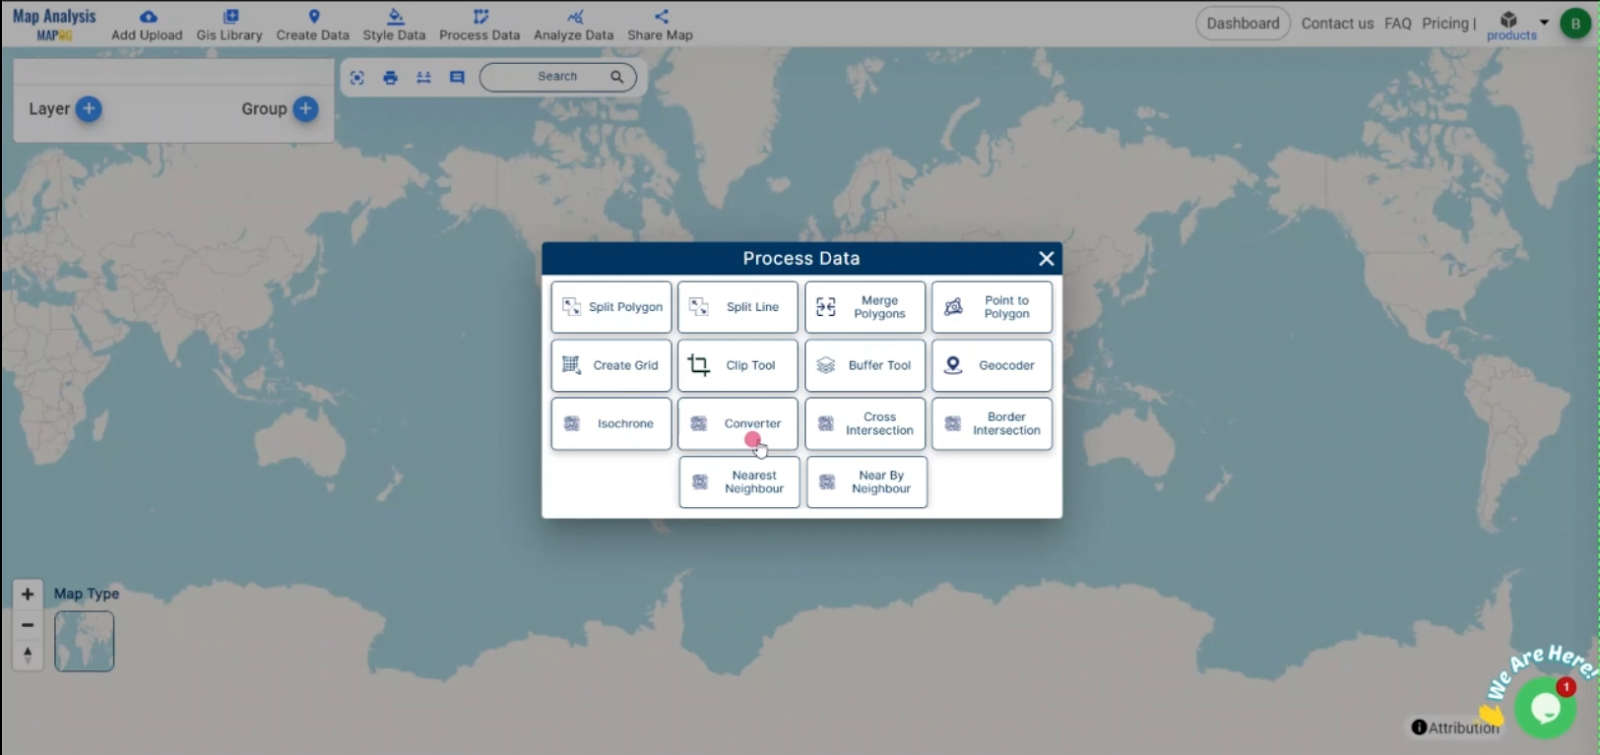
Step 1: Upload the TOPOJSON File
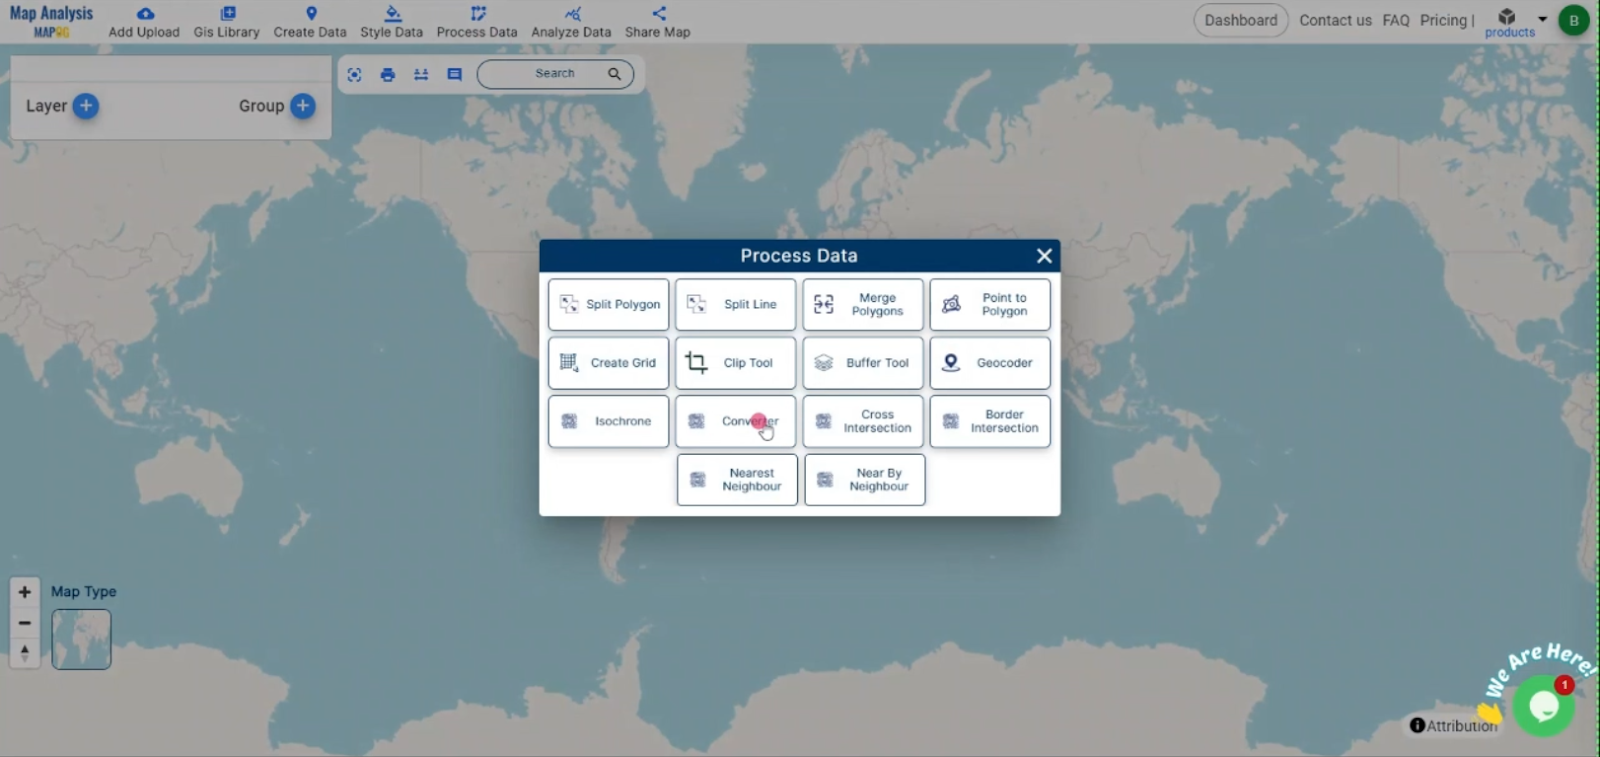
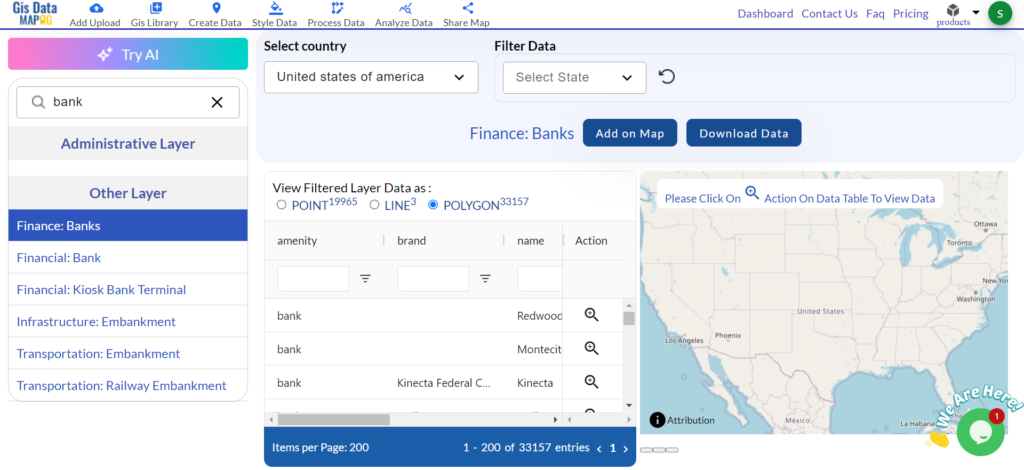
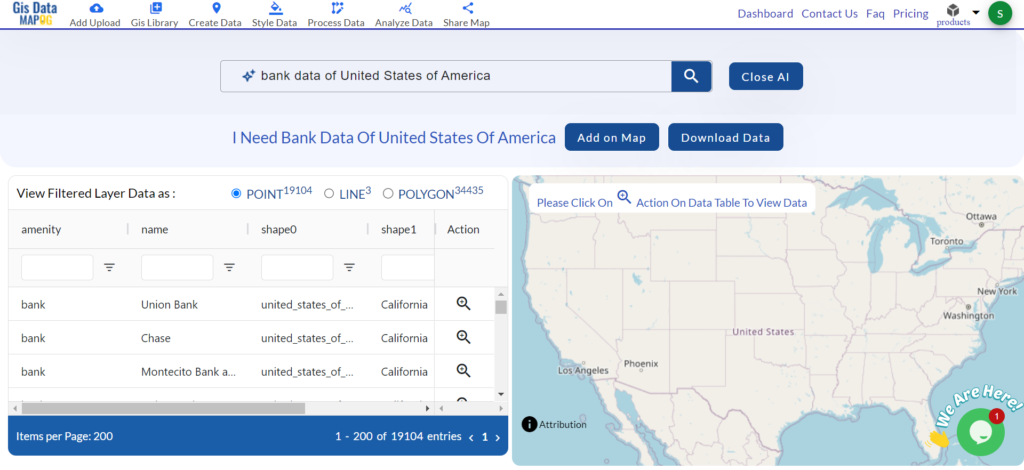
Start by navigating to the “Process Data” section in MAPOG MapAnalysis. Select the “Converter Tool” option. Upload your TOPOJSON file by selecting it from your local storage.
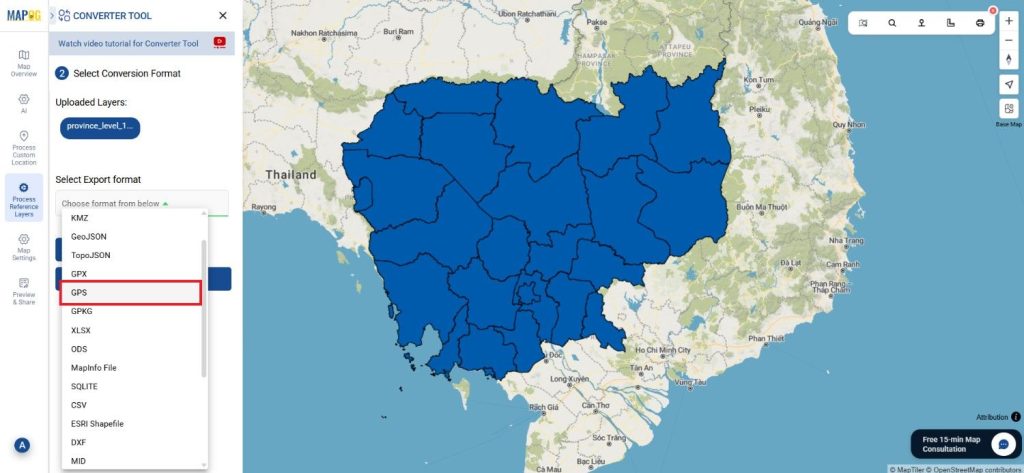
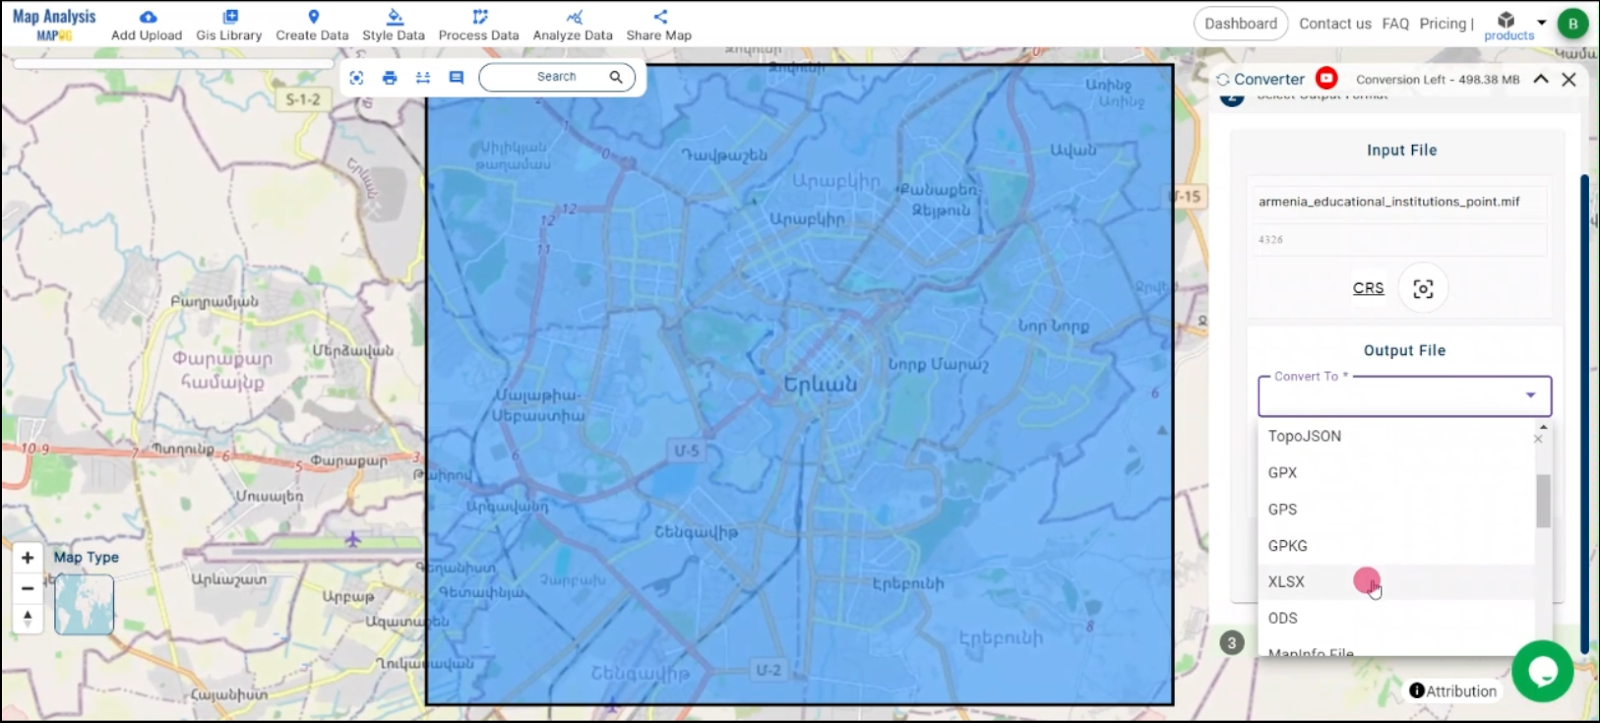
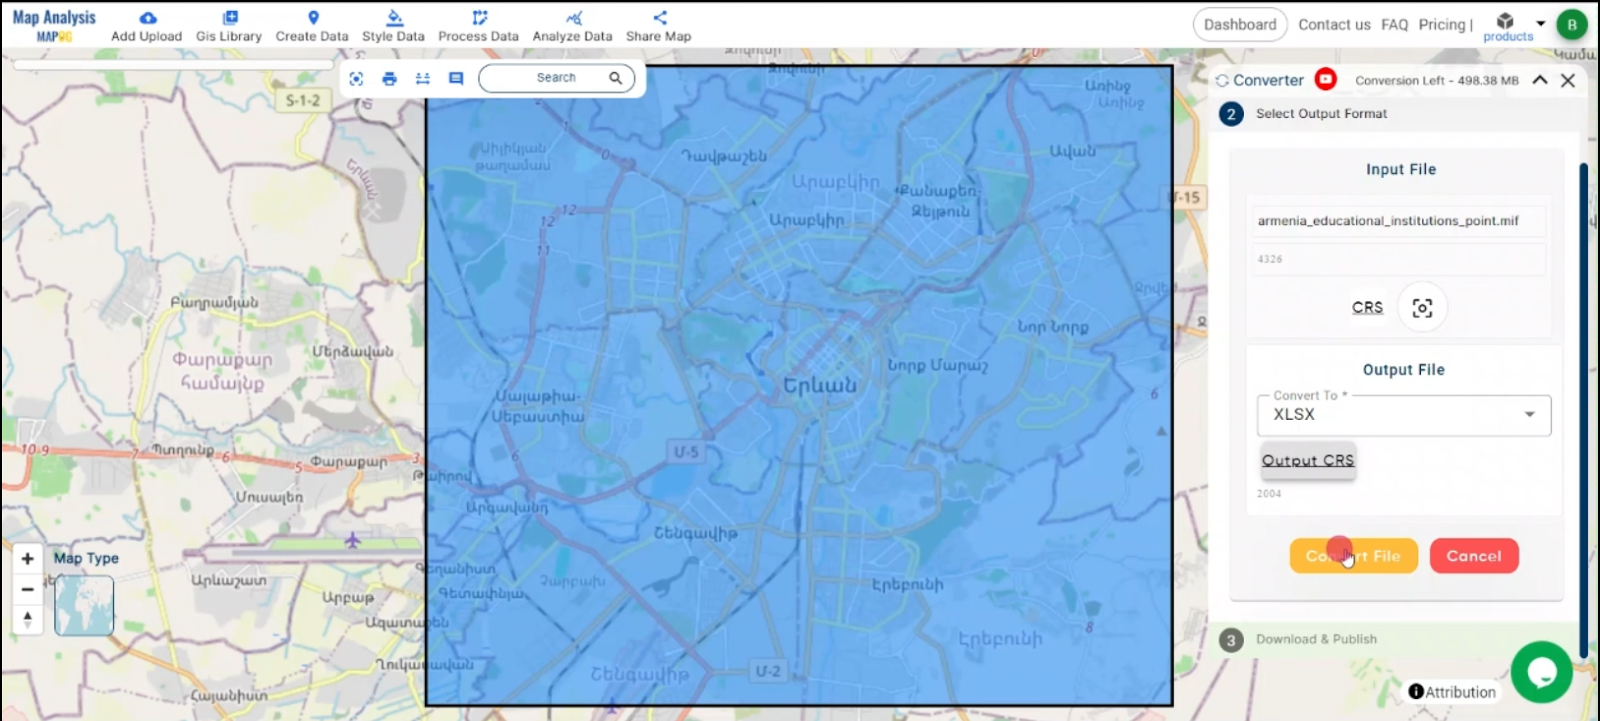
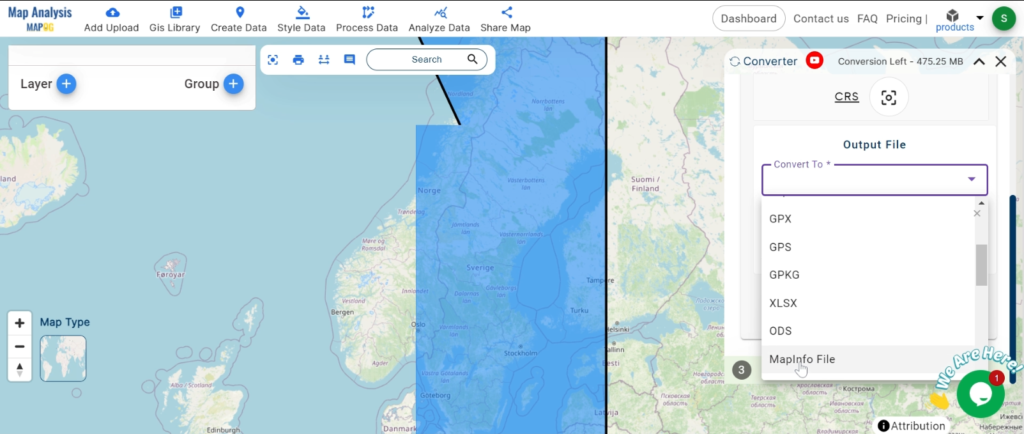
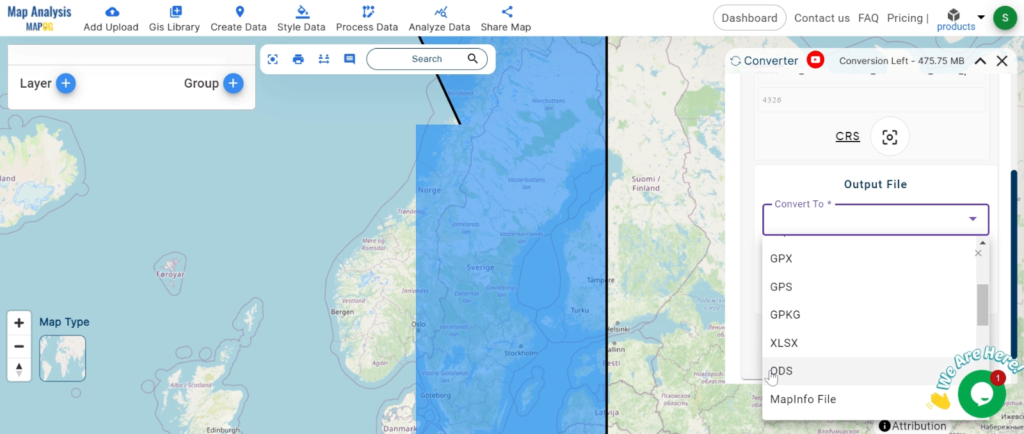
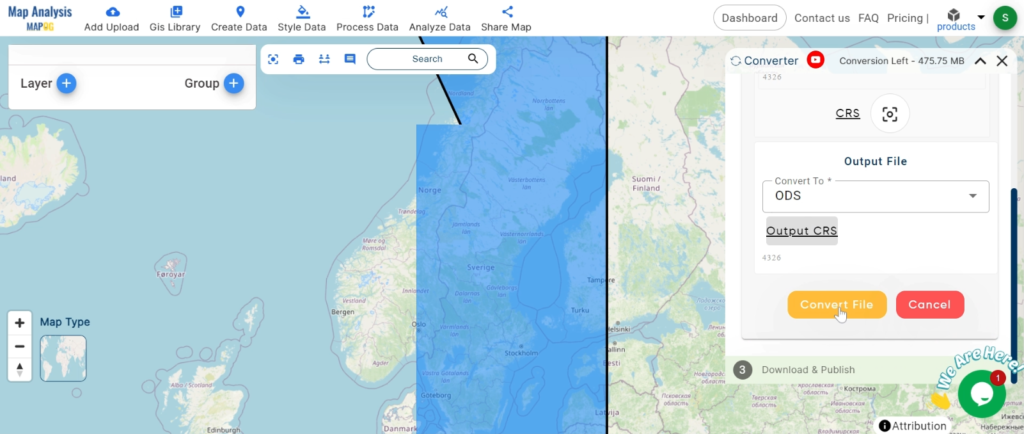
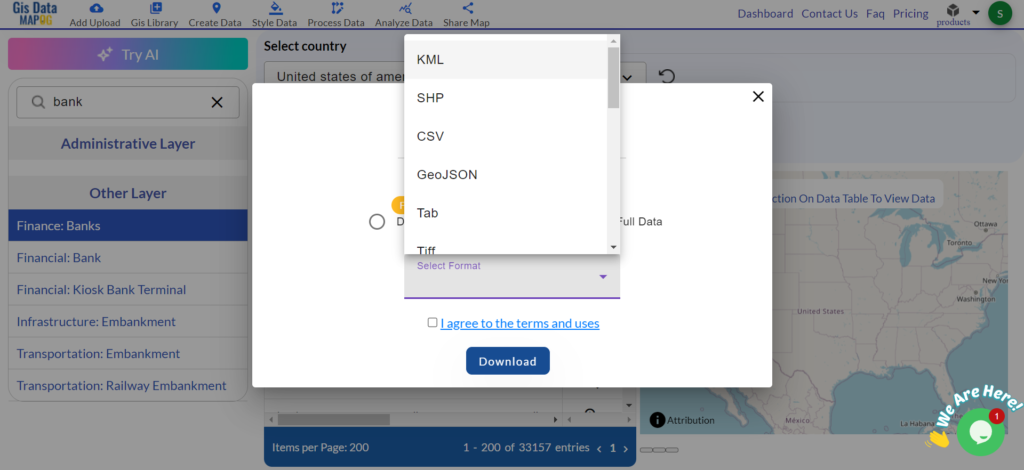
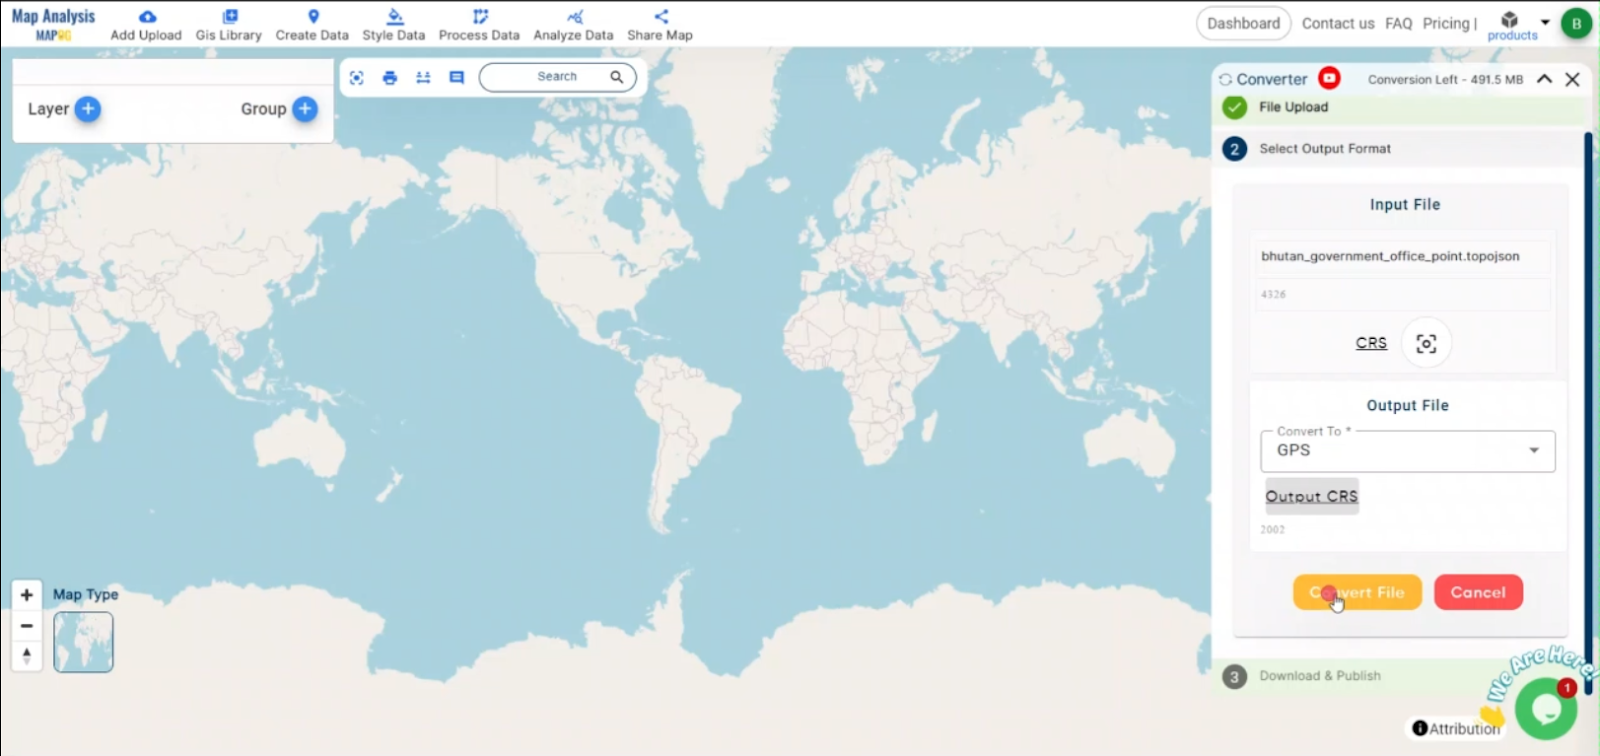
Step 2: Select GPS Format
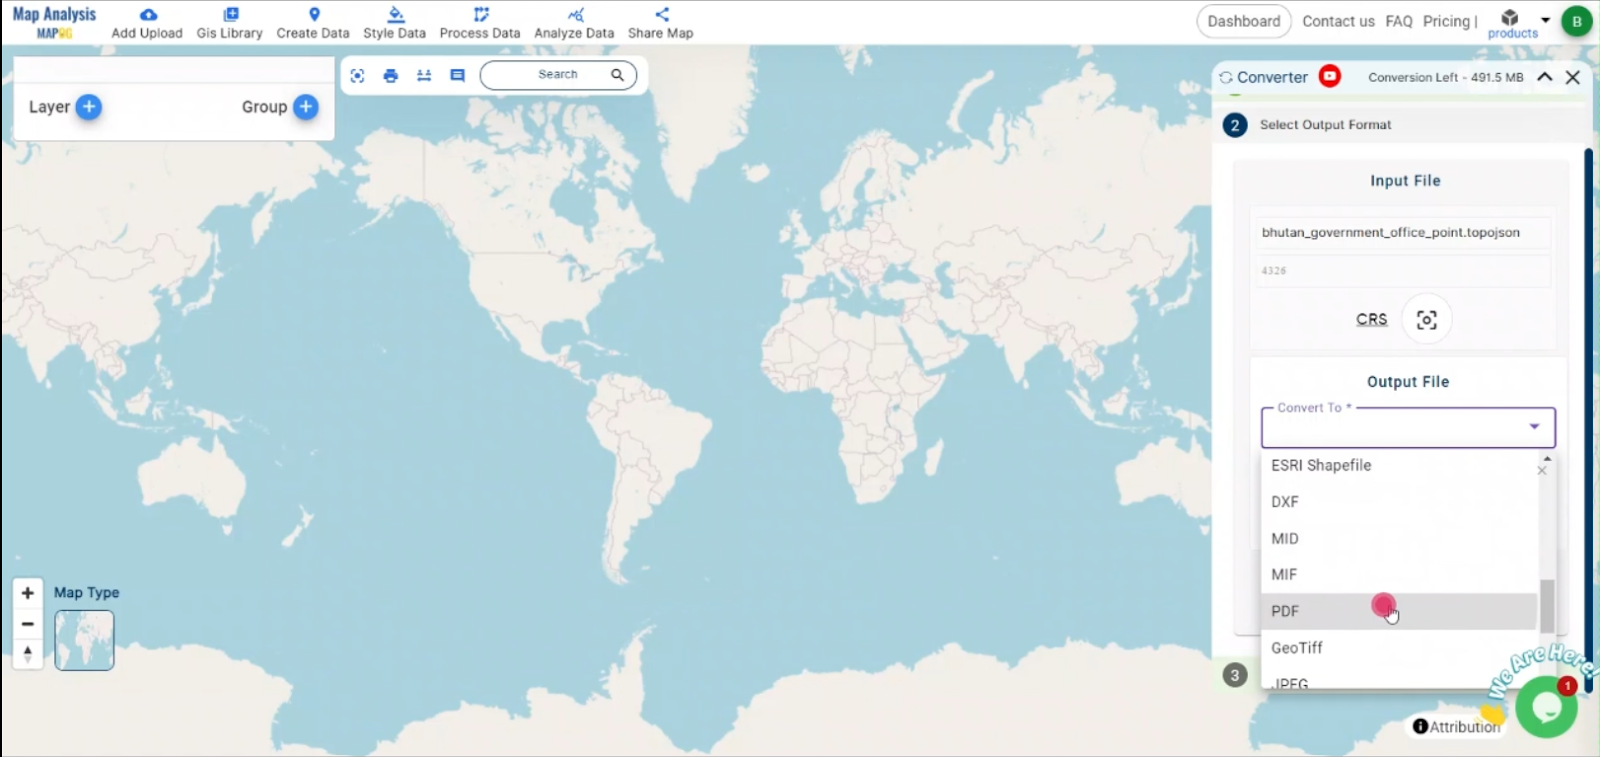
Once your TOPOJSON file is uploaded, choose the GPS-compatible format, typically GPX, as the output. GPX is widely supported by GPS devices and is ideal for storing waypoints, routes, and tracks.
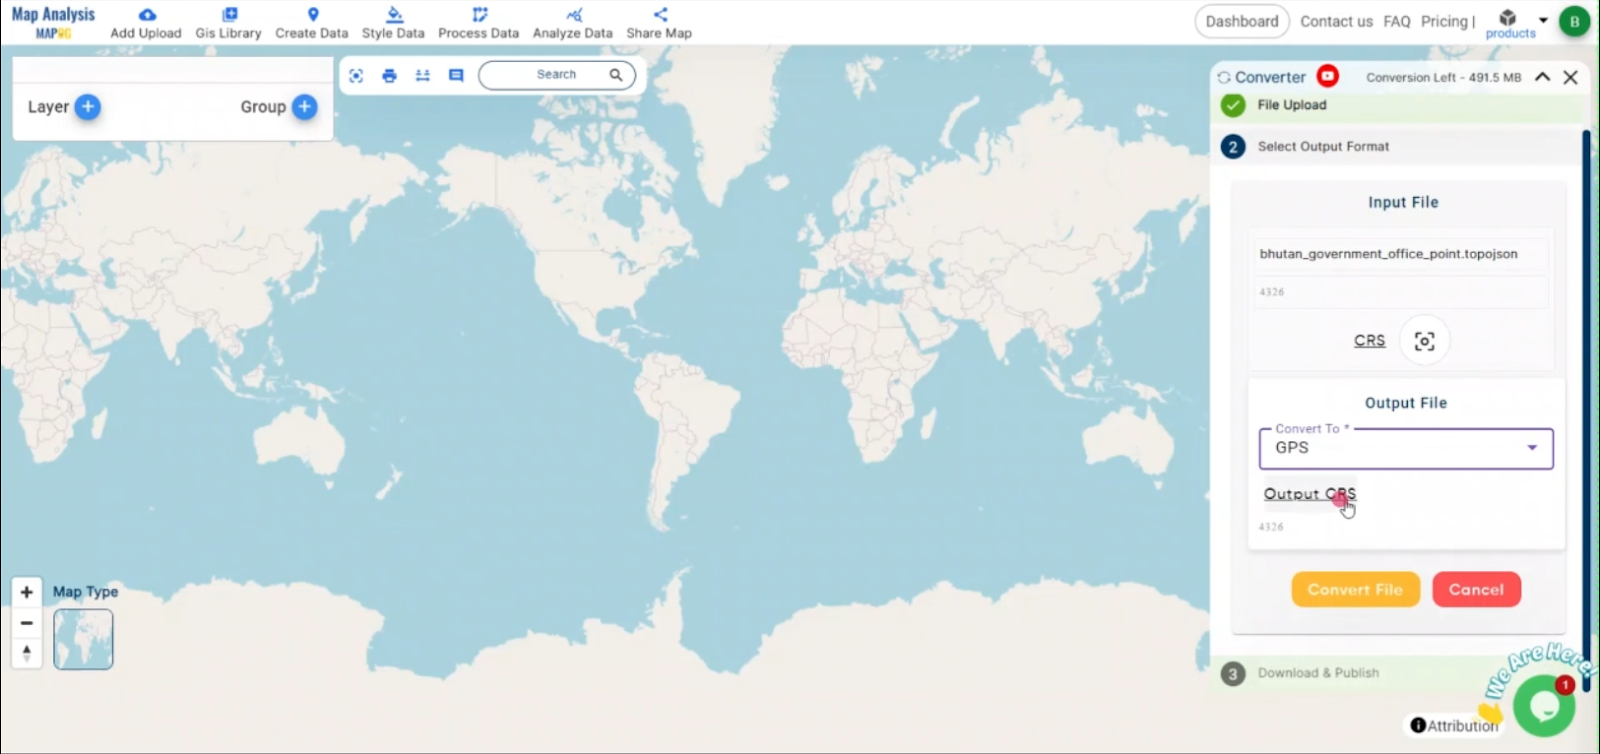
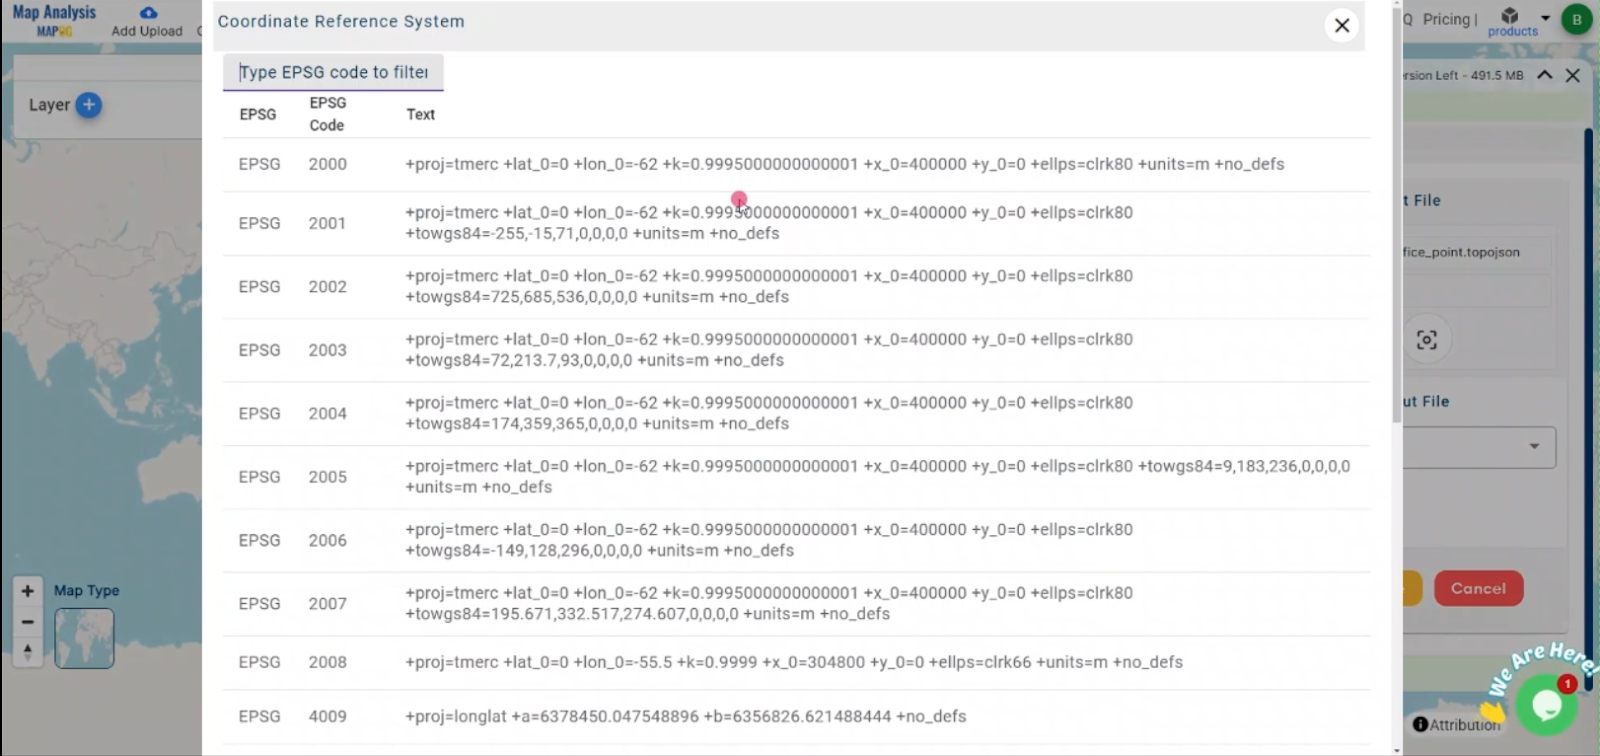
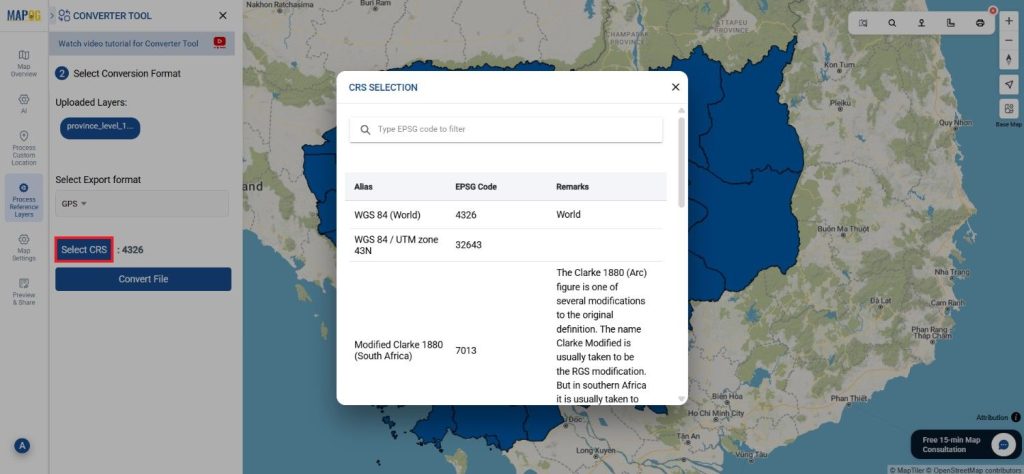
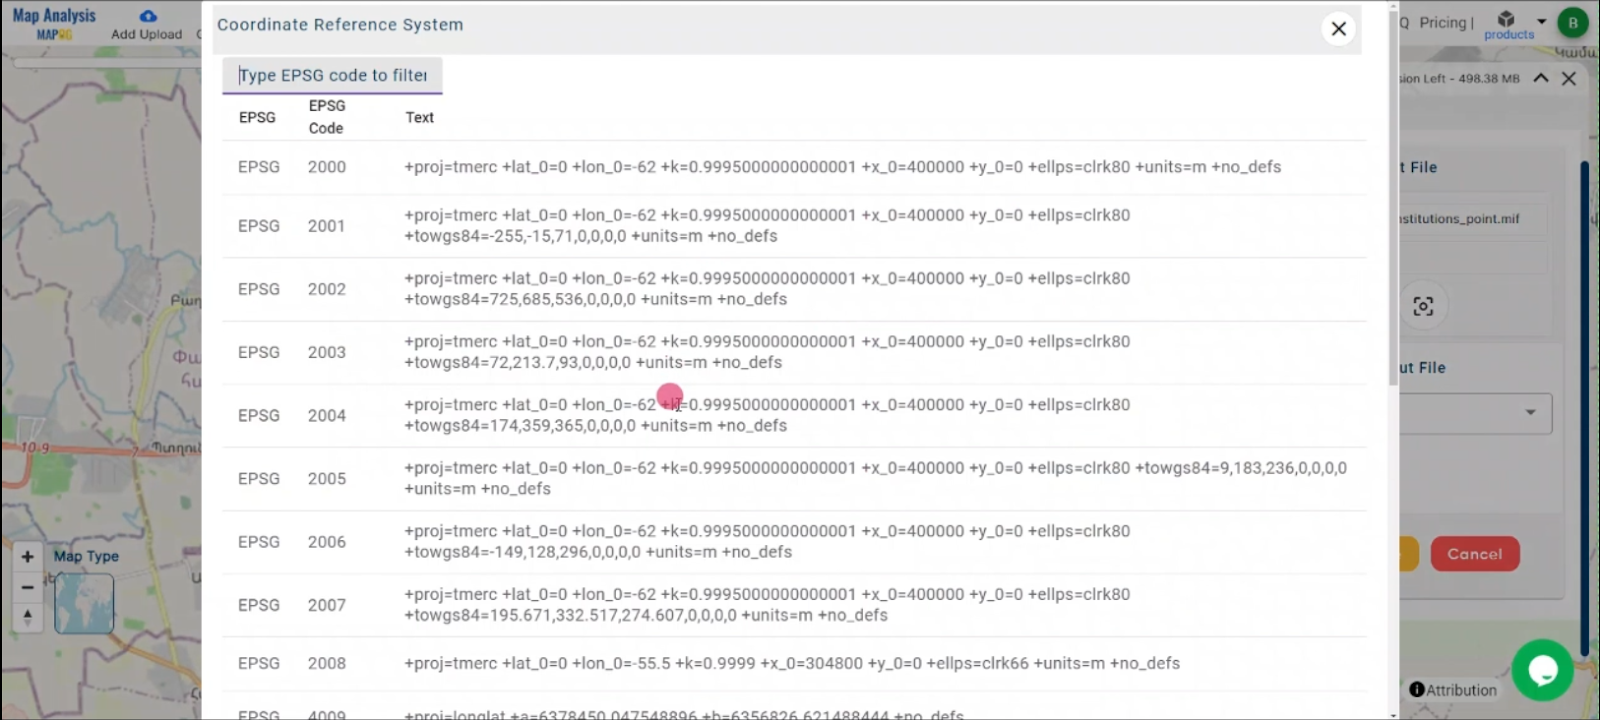
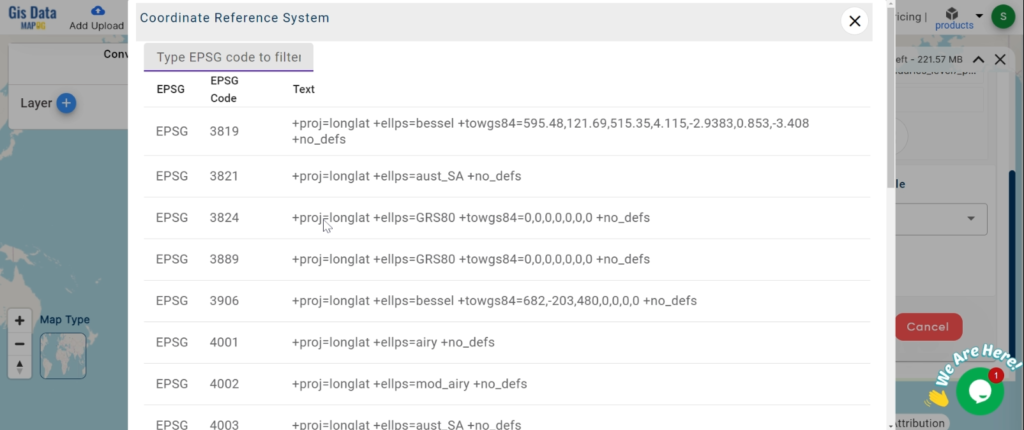
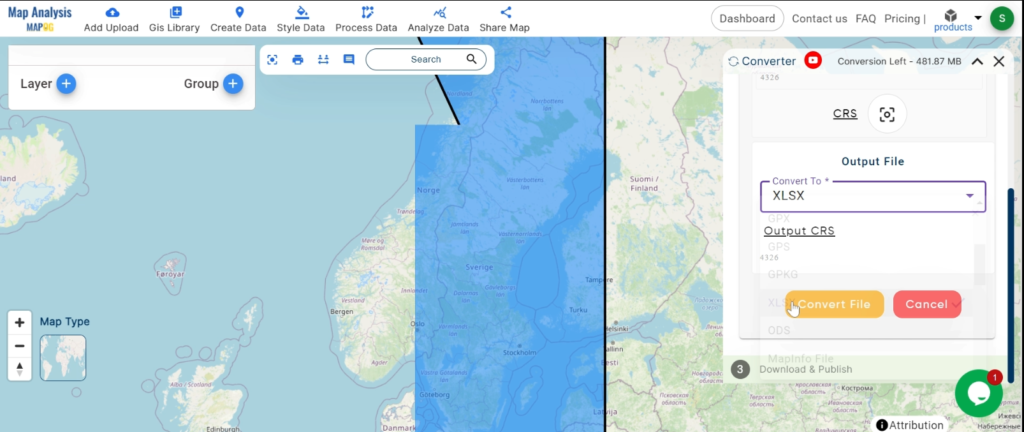
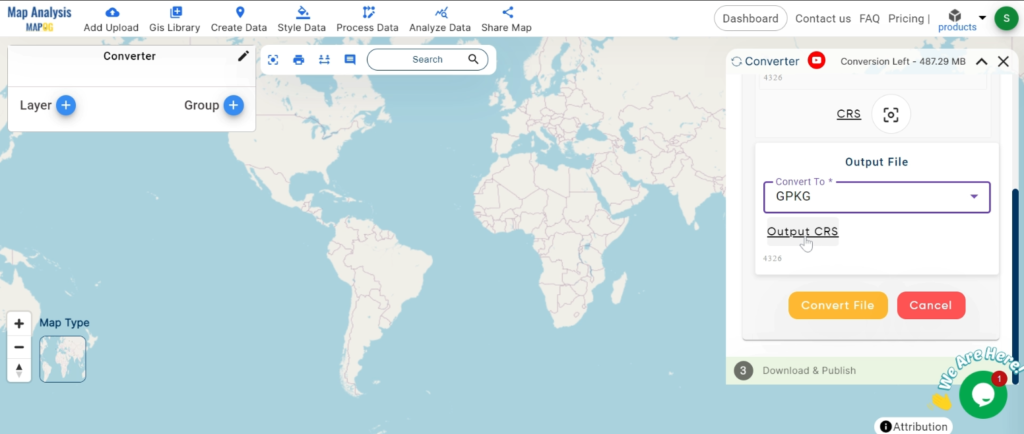
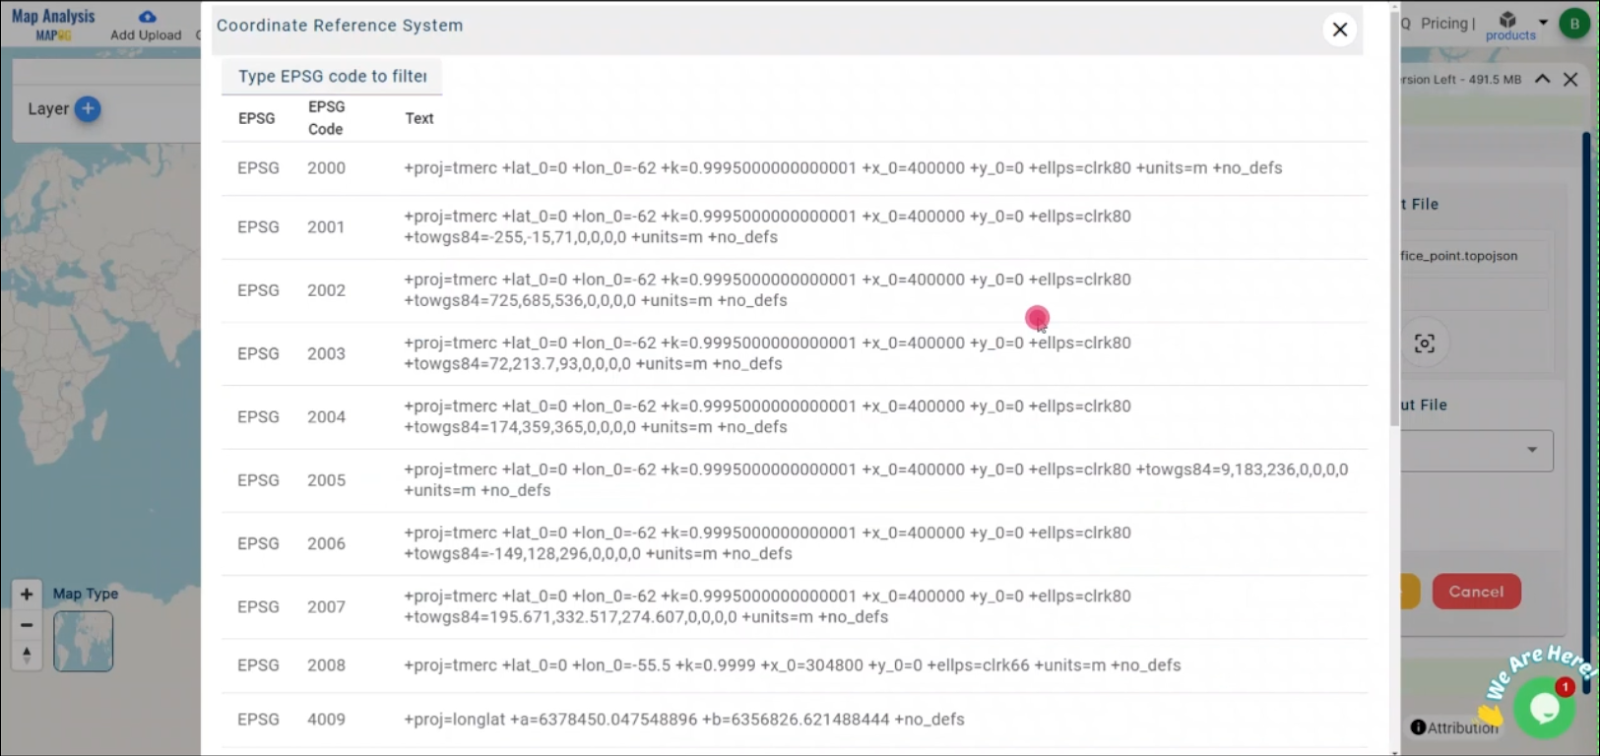
Step 3: Set the Coordinate Reference System (CRS)
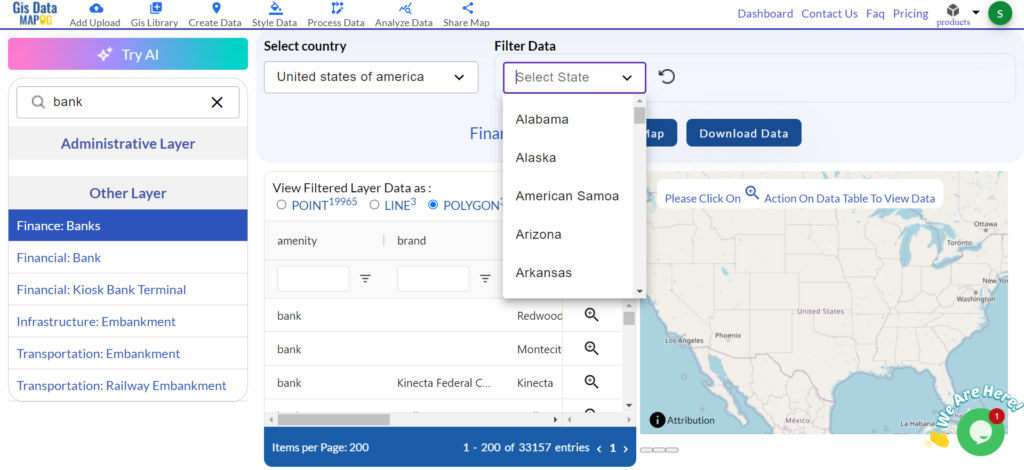
To ensure geographic accuracy, select the appropriate Coordinate Reference System (CRS) for your data. This is crucial for maintaining the spatial integrity of your data when used in GPS devices.
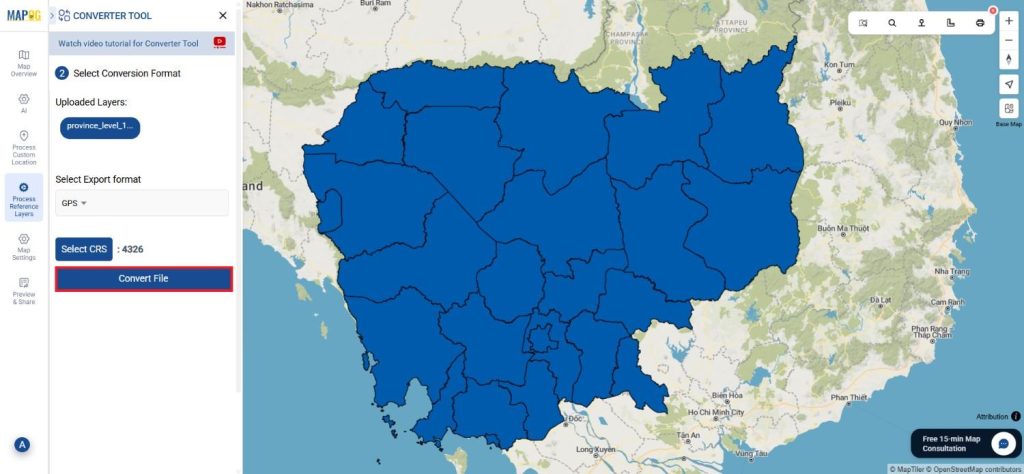
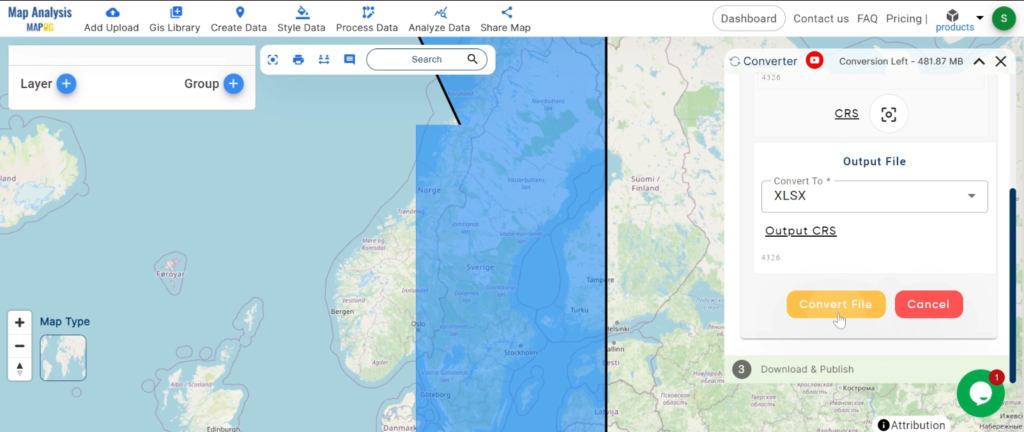
Step 4: Convert the File
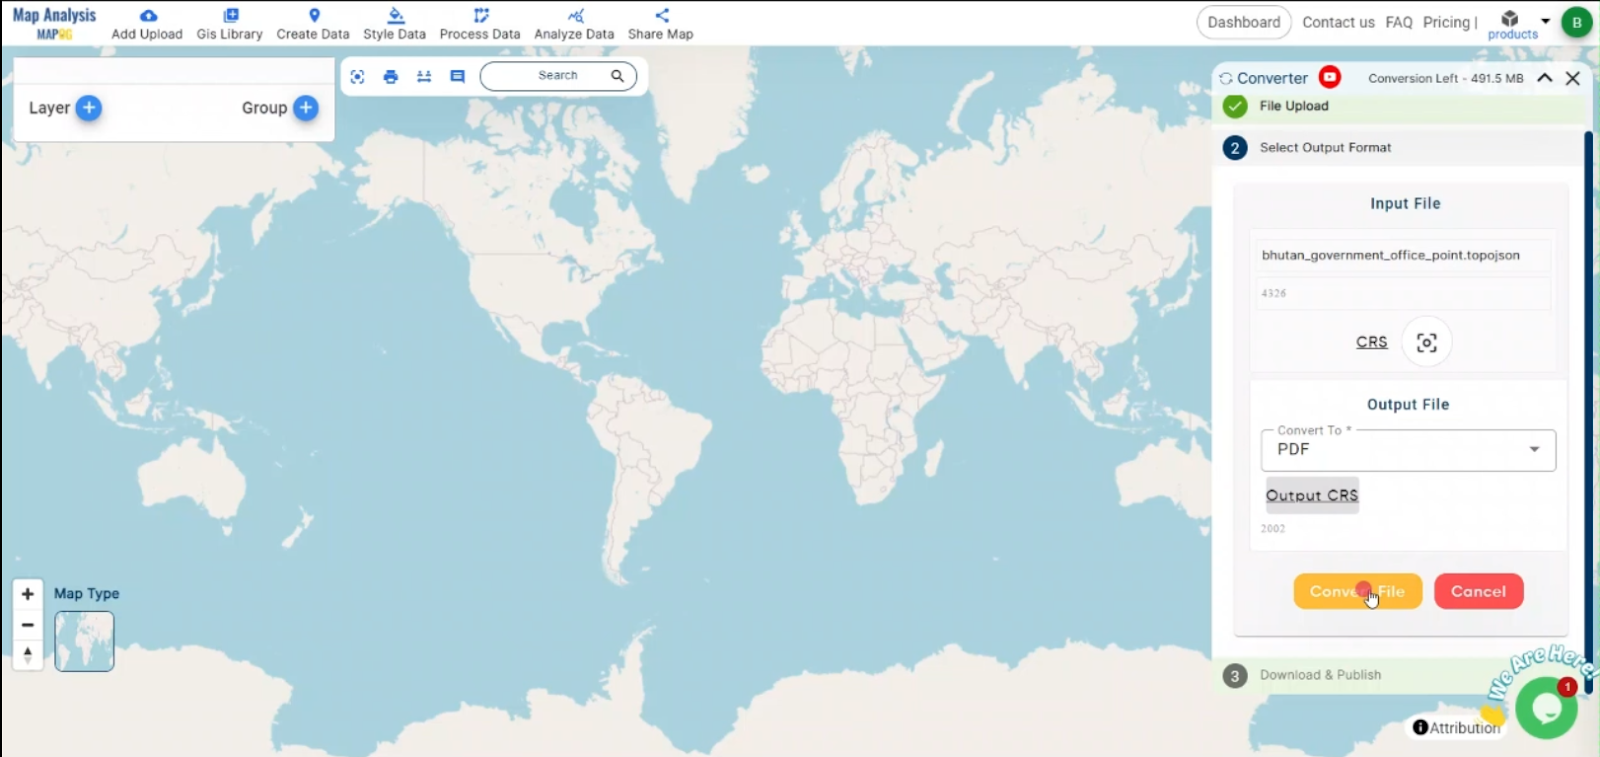
After selecting the output format and setting the CRS, click the “Convert” button to initiate the conversion process. The MAPOG tool will convert your TOPOJSON file into a GPS-readable GPX format, preserving the geographic features and attributes.
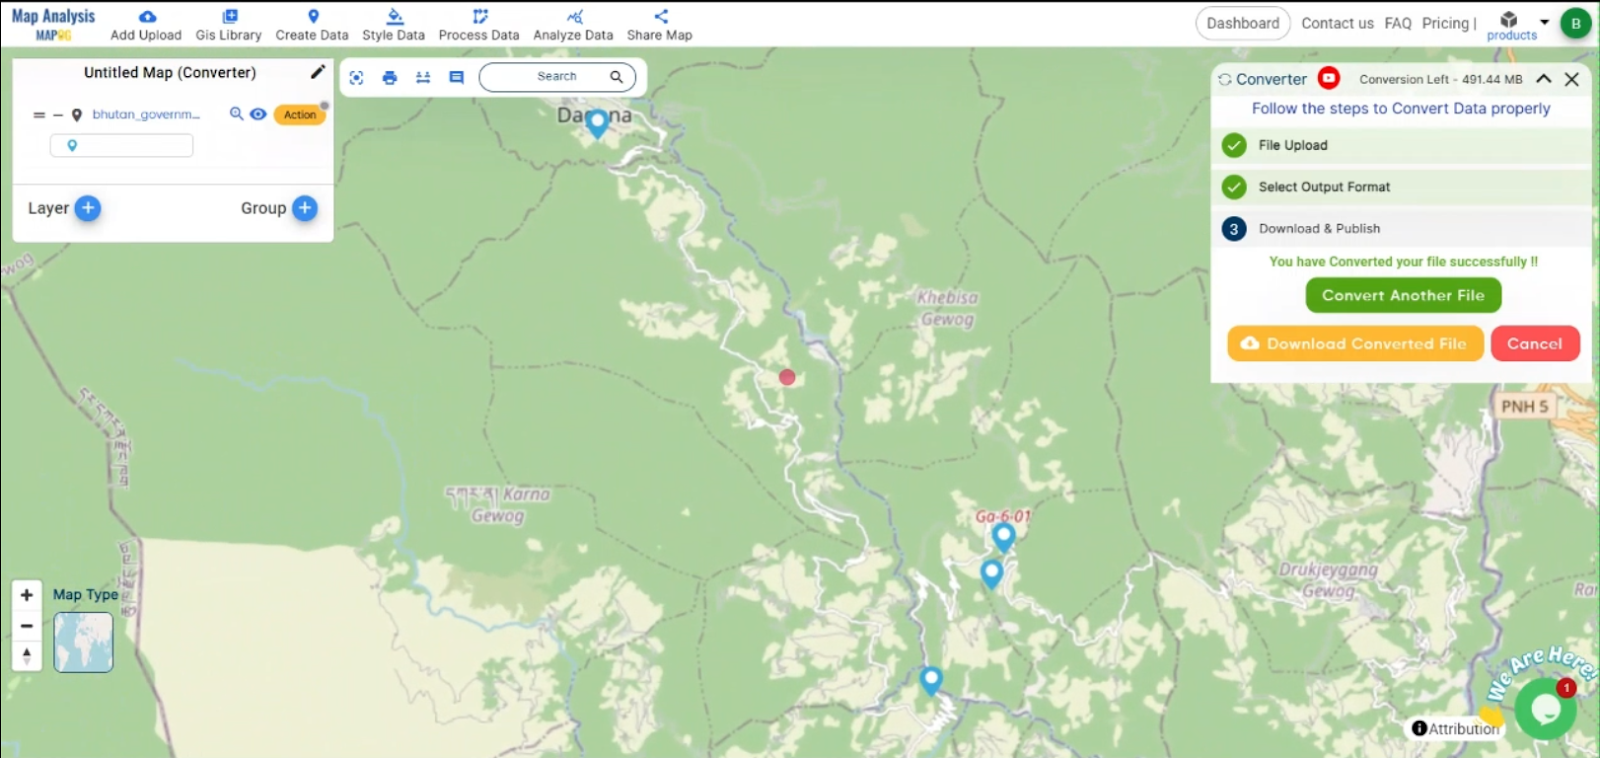
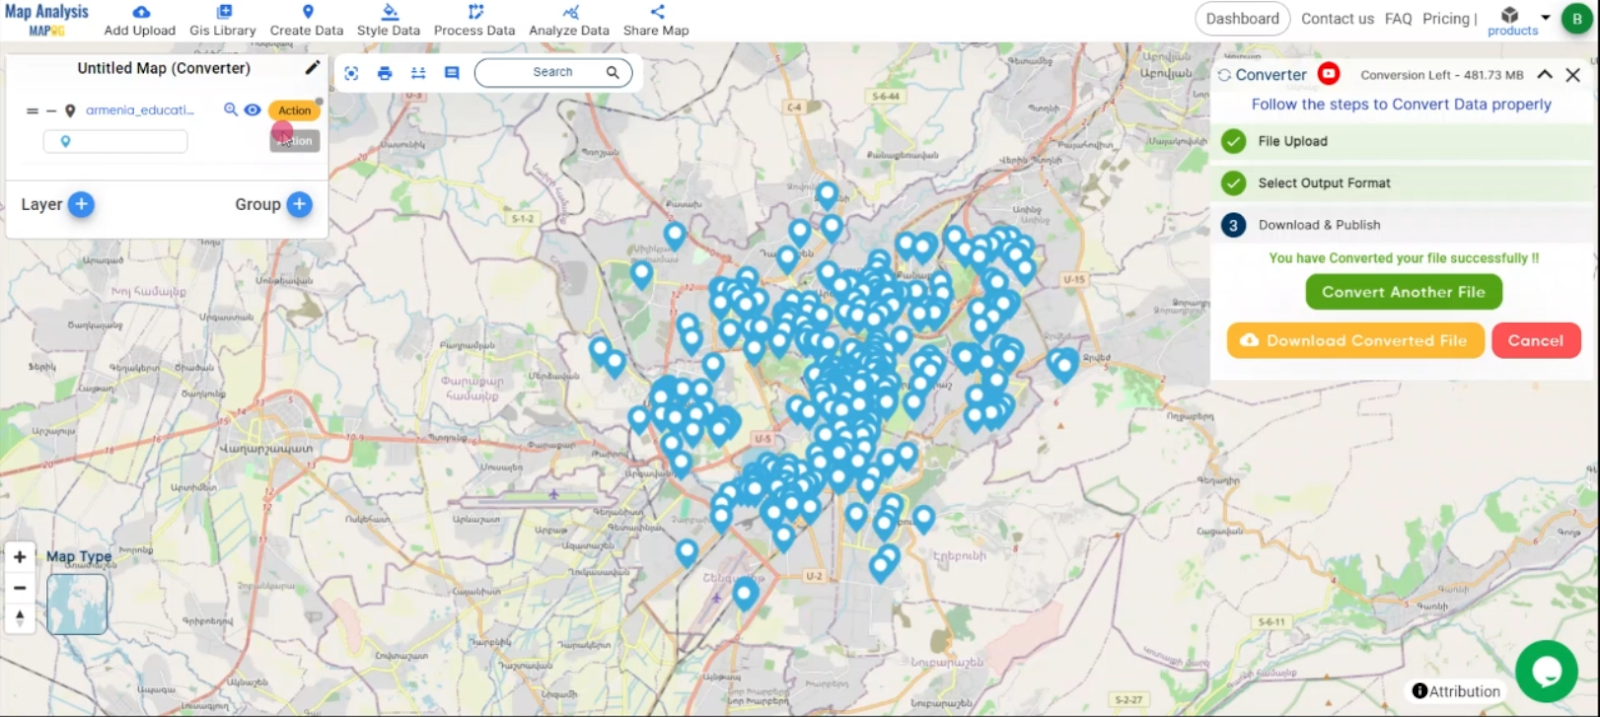
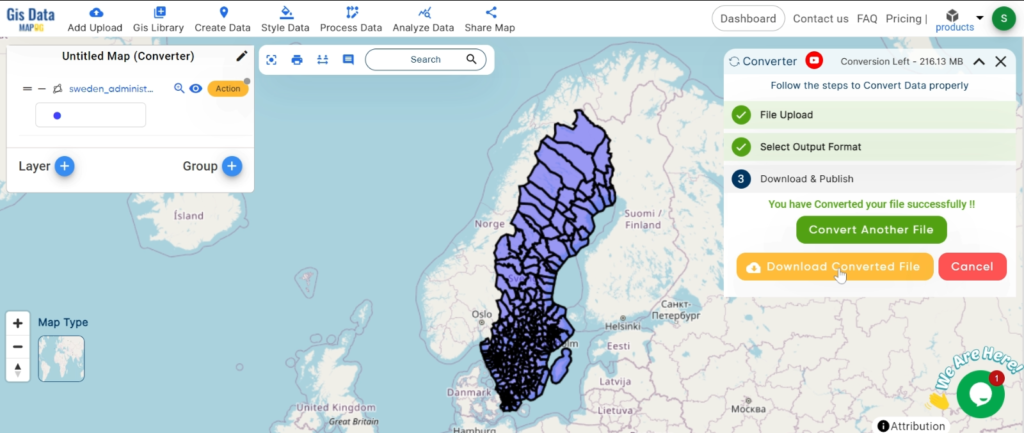
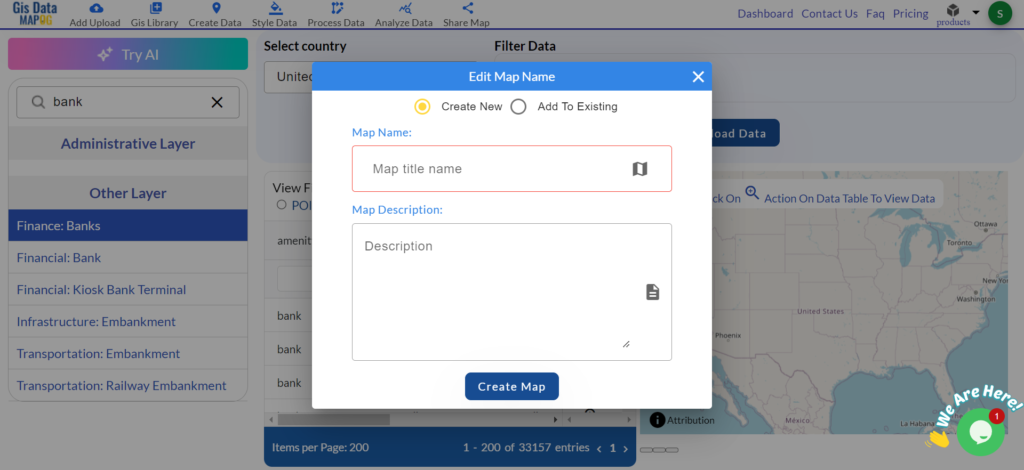
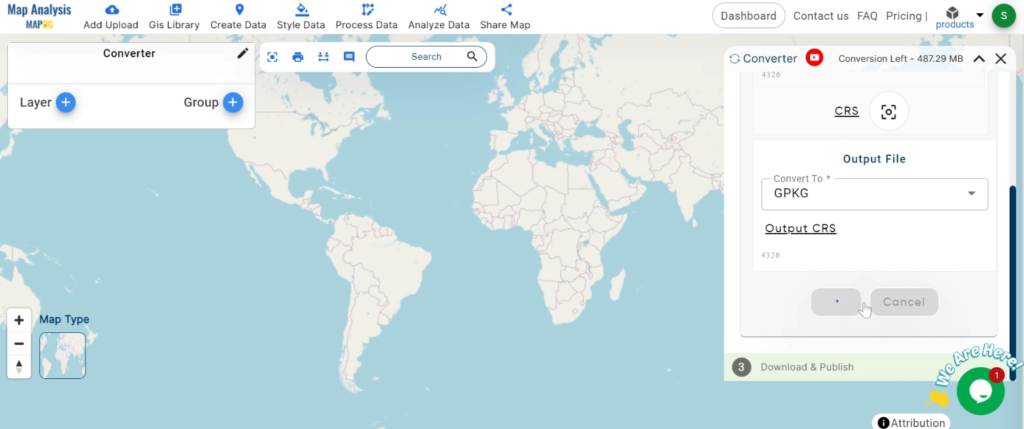
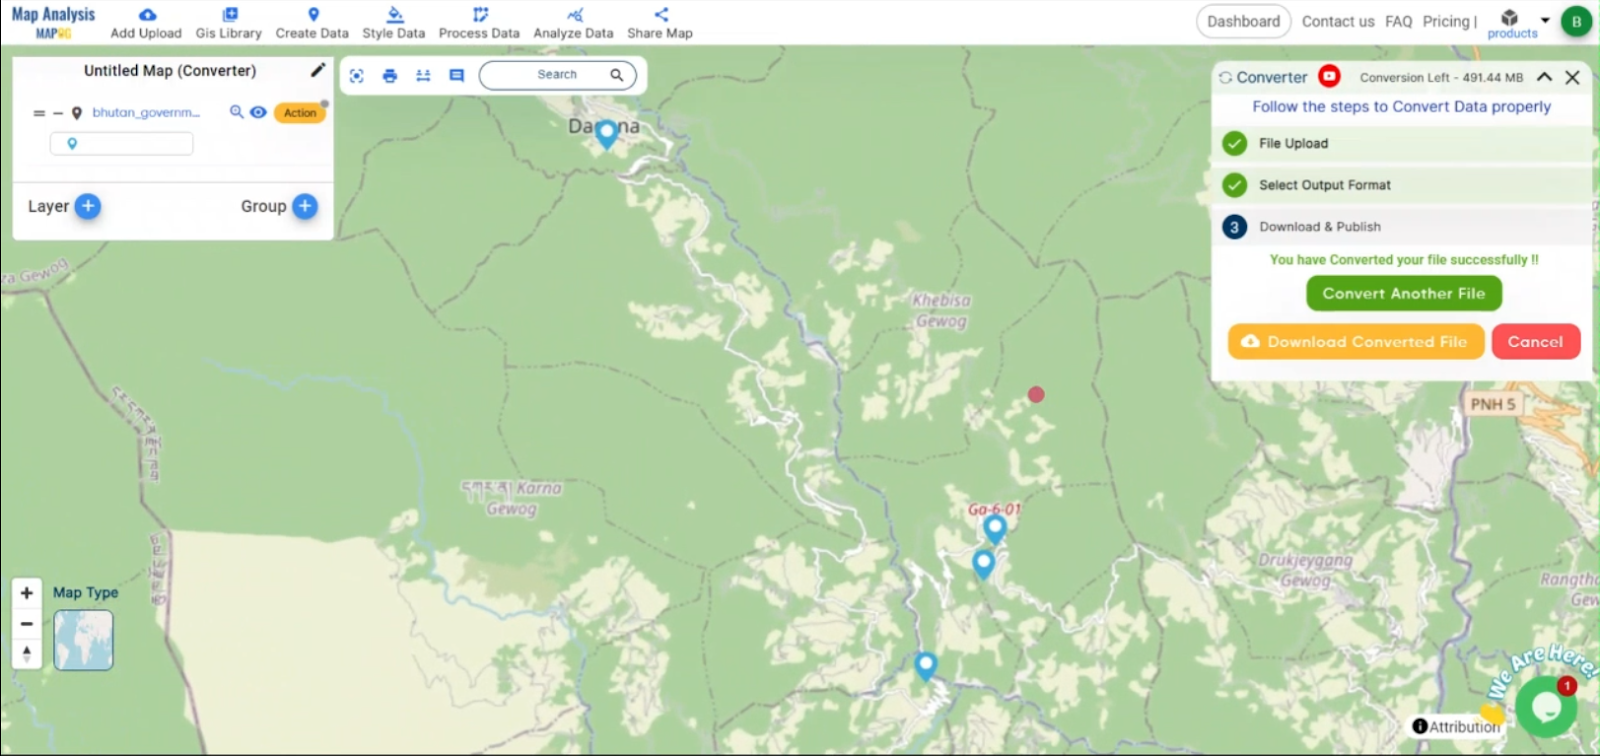
Step 5: Review and Download the GPX File
Once the conversion is complete, review the output file to ensure all data has been accurately converted.
Conclusion
The MAPOG Converter Tool simplifies the process of converting TOPOJSON files into GPS-compatible formats like GPX. This step-by-step guide ensures that your geospatial data can be effectively utilized for navigation, tracking, and other GPS-related tasks, enhancing the versatility of your projects. Follow these steps to ensure a smooth data conversion and seamless integration into your GPS systems.
Feature Tool:
MAPOG:
MAPOG is an interactive application that uses storytelling and interactive maps to bring geographical data to life. Imagine creating engrossing narratives about locations, occasions, or trends by fusing in-depth maps with images, text, and videos.
Here are some other blogs you might be interested in:
- Convert Online Gis data : KML to PDF file
- Converting KML to GeoTIFF , Online Gis Data Converter
- Converting KMZ to SHP : Online GIS Data Conversion
- Converting TopoJSON to SHP Online : GIS Data Converter
- Converting GeoJSON to TopoJSON with MAPOG
- Converting GeoJSON to CSV with MAPOG
- Converting KMZ to KML with MAPOG
- Converting GML to KML with MAPOG
- Convert KMZ to TopoJSON Online
- Converting KMZ to GeoJSON Online
- Convert KML to MID Online
- Online Conversion KML to MIF
- Convert KML to GML Online
- Convert KML to GPKG Online
- Convert KML to KMZ Online
- Convert GML to SHP Online
- Convert KML to GML Online
- Convert KML to GeoJSON file online
- Convert KML to TopoJSON Online
- GeoJSON to GeoTIFF – Vector to Raster Conversion
- KML to GeoTIFF – Vector to Raster Conversion
- SHP to GPX / GPS
- Convert GeoJSON to KML
- Convert Geojson to MIF MapInfo file
- GeoJSON to Shapefile
- Convert GML to CSV
- Convert KMZ to GPX