Owner and Director of a Private Limited company which serves individual to large scale industries in the field of Maps and GIS. He is a Gold Medalist in M.Tech(Spatial Information Technology) and owns some famous Technology blogs and website... Know more
In this guide, we’ll walk you through how to efficiently convert your KMZ files to SQLITE using the powerful Converter Tool in MAPOG Map Analysis. Whether you’re a beginner or an experienced user, Converting KMZ to SQLITE with MAPOG, this tutorial will help you understand the process in easy steps.
Key Concept to Converting files
The Converter Tool is a feature in MAPOG Map Analysis that helps you change your data from one format to another. It’s like magic! You give it your data in one form, and it transforms it into another form that you need for your analysis. Additionally, with GIS Data, you can download data in any format, making it versatile and adaptable for various applications.
Online KMZ to SQLITE GIS Converter
Now, let’s walk through the simple steps of using the Converter Tool to Converting KMZ to SQLITE with MAPOG.
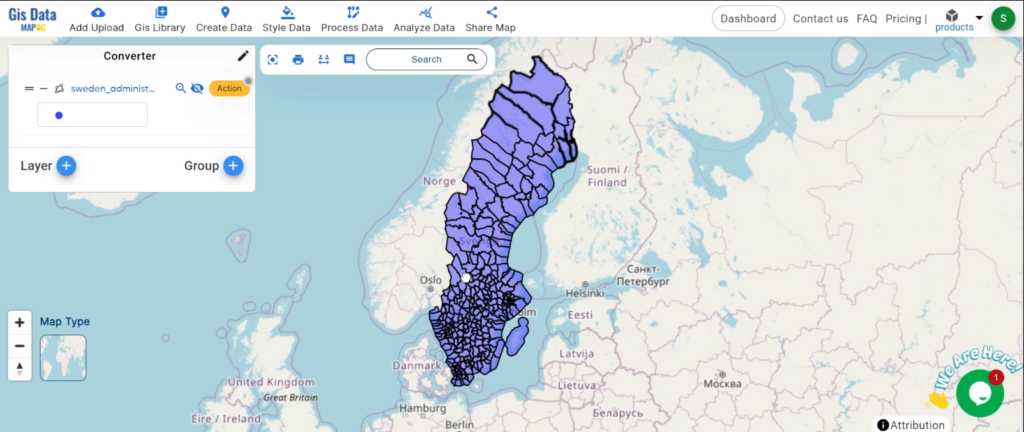
Step 1: Upload the Data
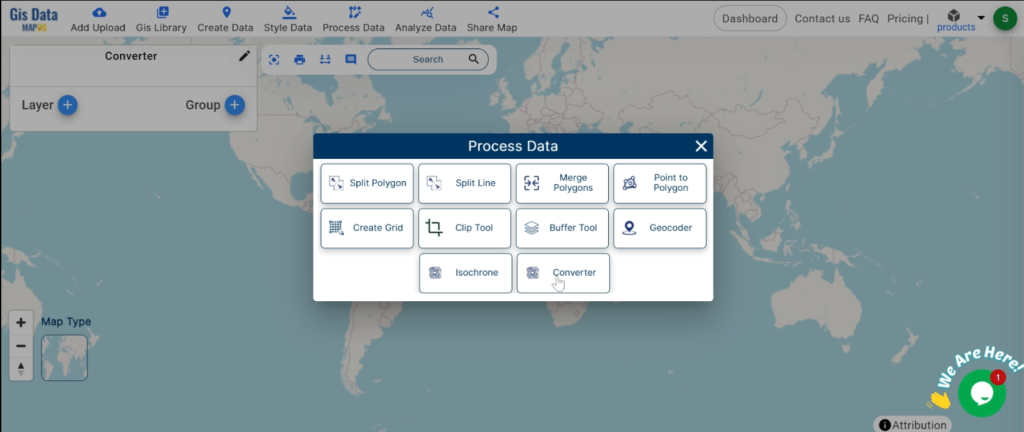
1. Click on the “Process Data” menu and choose the “Converter Tool” option.
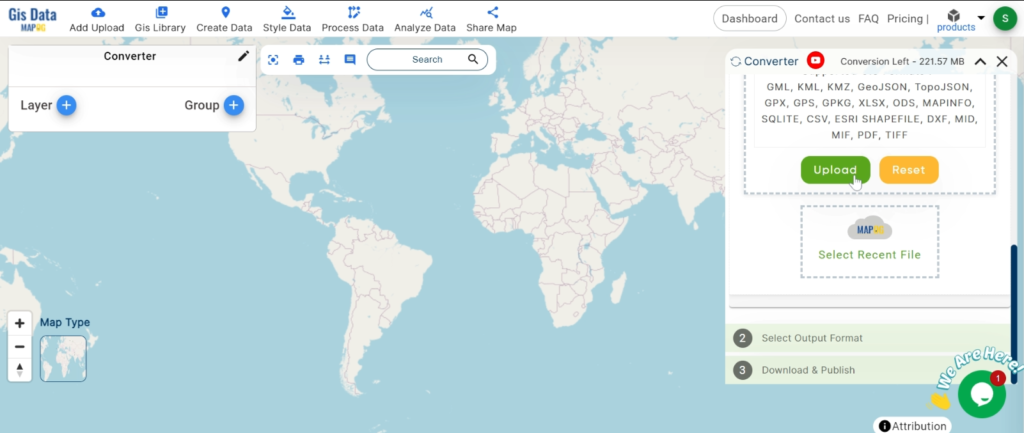
2.Upload your KMZ file. This is your starting point where you provide the data that needs conversion.
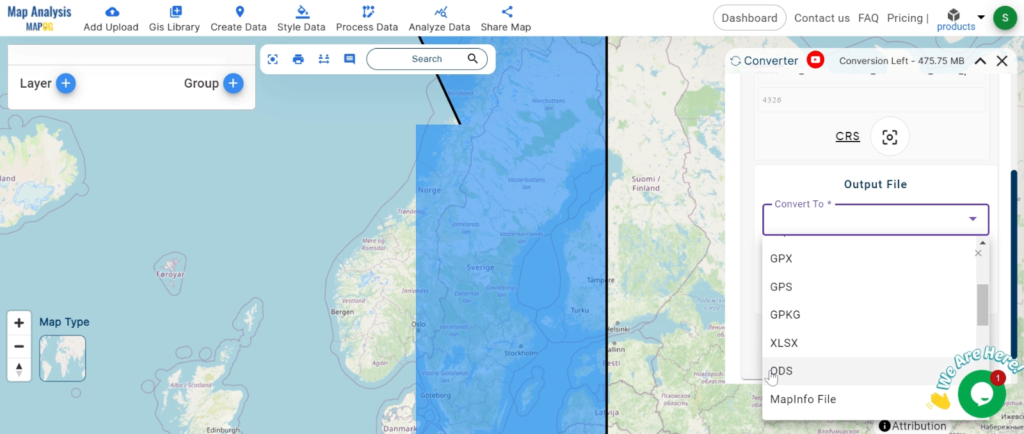
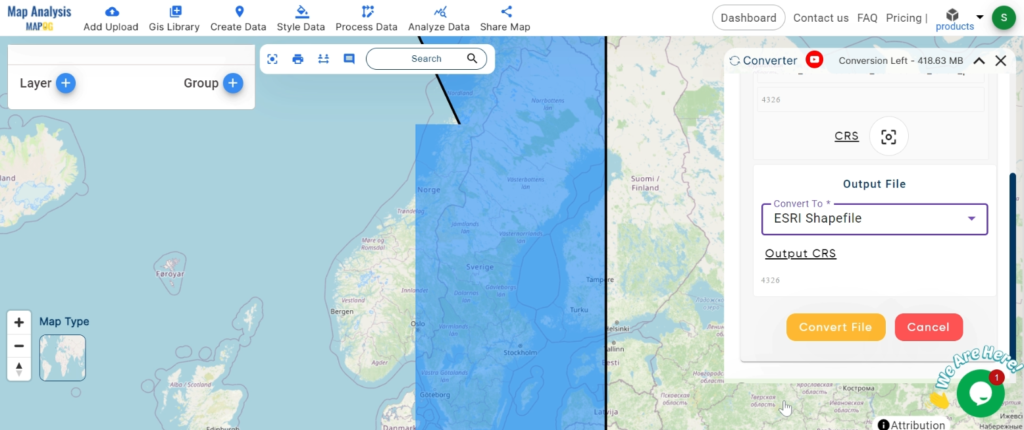
Step 2: Select the Format for Conversion
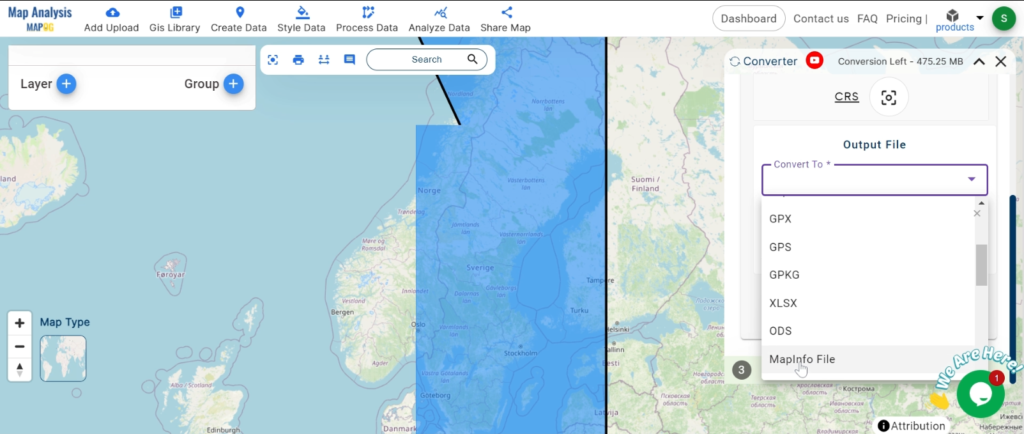
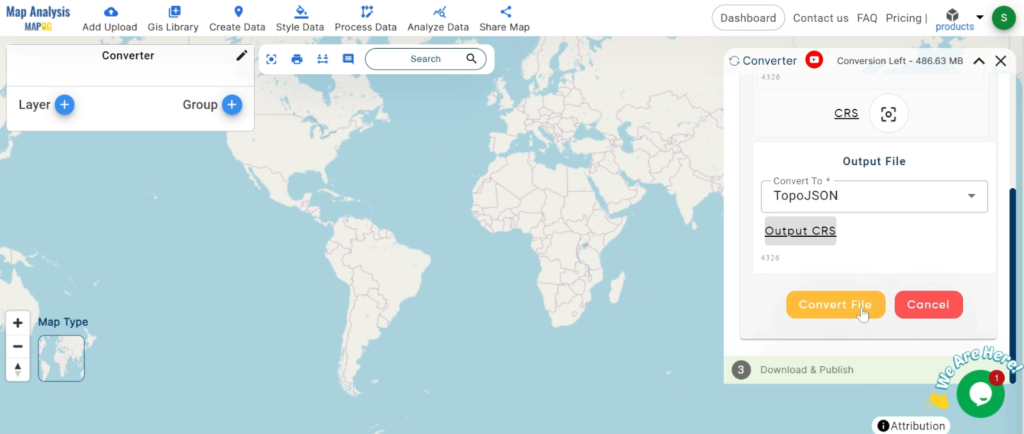
1.Choose the output file format as SQLITE. The tool offers various formats, but for this guide, we are focusing on converting to SQLITE.
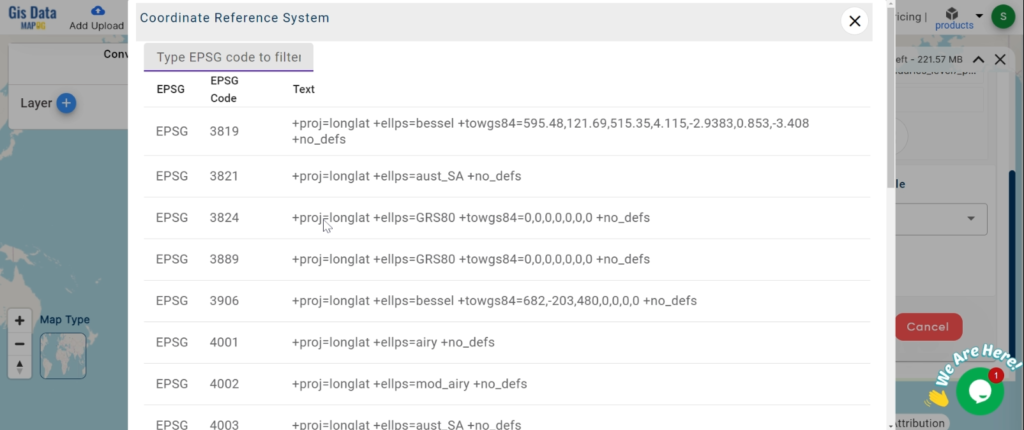
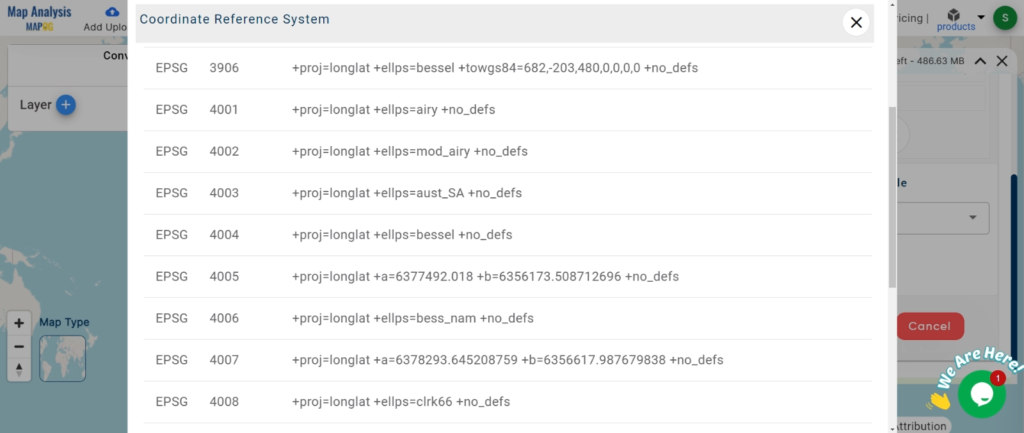
2.You can also set the CRS at this stage.
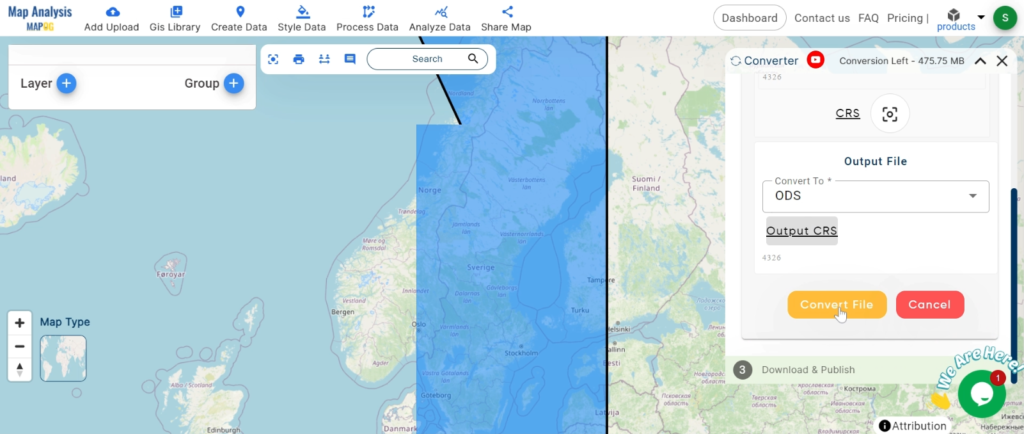
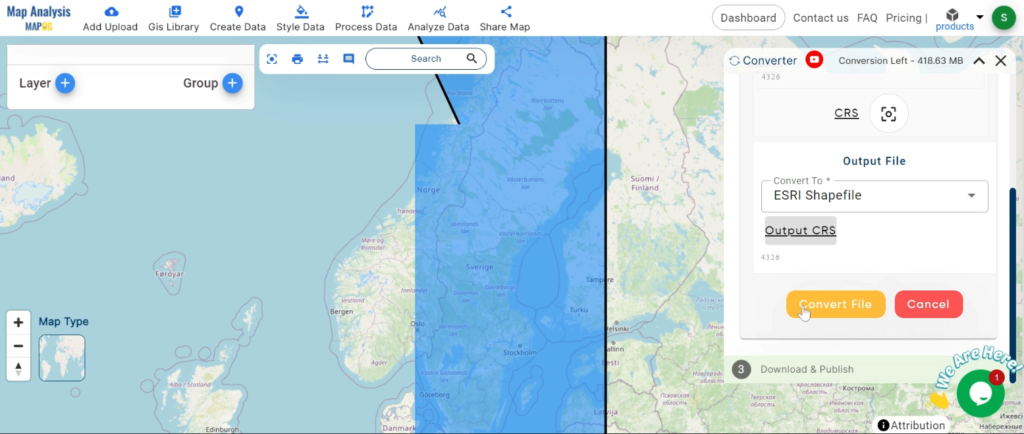
Step 3: Run the Conversion
Click ‘Convert’ and let the tool work its magic. The Converter Tool processes your data, transforming it from KMZ to SQLITE format.
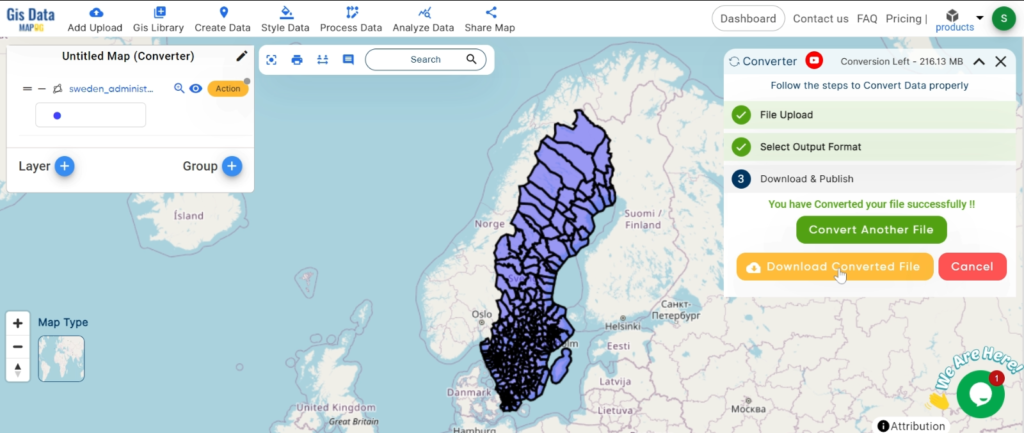
Step 4: Review and Download
Finally, review your converted SQLITE data to ensure it looks right. Once satisfied, download the converted file. This step is crucial to verify that the conversion has been successful and the data integrity is maintained.
And there you have it! You’ve successfully used the Converter Tool in MAPOG Map Analysis to convert your KMZ files to SQLITE. Now you can easily convert your data for all your analysis needs. This feature simplifies the process of handling different data formats, making your workflow more efficient and effective.
In this guide, we’ll walk you through how to efficiently convert your KMZ files to MAPINFO using the powerful Converter Tool in MAPOG Map Analysis. Whether you’re a beginner or an experienced user, Converting KMZ to MAPINFO with MAPOG, this tutorial will help you understand the process in easy steps.
Key Concept to GIS Data Conversion
The Converter Tool is a feature in MAPOG Map Analysis that helps you change your data from one format to another. It’s like magic! You give it your data in one form, and it transforms it into another form that you need for your analysis. Additionally, with GIS Data, you can download data in any format, making it versatile and adaptable for various applications.
Online KMZ to MAPINFO GIS Converter
Now, let’s walk through the simple steps of using the Converter Tool to Converting KMZ to MAPINFO with MAPOG.
Step 1: Upload the Data
1. Click on the “Process Data” menu and choose the “Converter Tool” option.
2.Upload your KMZ file. This is your starting point where you provide the data that needs conversion.
Step 2: Select the Format for Conversion
1.Choose the output file format as MAPINFO. The tool offers various formats, but for this guide, we are focusing on converting to MAPINFO.
2.You can also set the CRS at this stage.
Step 3: Run the Conversion
Click ‘Convert’ and let the tool work its magic. The Converter Tool processes your data, transforming it from KMZ to MAPINFO format.
Step 4: Review and Download
Finally, review your converted MAPINFO data to ensure it looks right. Once satisfied, download the converted file. This step is crucial to verify that the conversion has been successful and the data integrity is maintained.
And there you have it! You’ve successfully used the Converter Tool in MAPOG Map Analysis to convert your KMZ files to MAPINFO. Now you can easily convert your data for all your analysis needs. This feature simplifies the process of handling different data formats, making your workflow more efficient and effective.
KMZ to ODS using MAPOG, you can transform gis data, making it easier to analyze, share, and integrate into various GIS applications.
In this guide, we’ll walk you through how to efficiently convert your KMZ files to ODS using the powerful Converter Tool in MAPOG Map Analysis. Whether you’re a beginner or an experienced user, Converting KMZ to ODS with MAPOG, this tutorial will help you understand the process in easy steps.
Key Concept of Converting files
The Converter Tool is a feature in MAPOG Map Analysis that helps you change your data from one format to another. It’s like magic! You give it your data in one form, and it transforms it into another form that you need for your analysis. Additionally, with GIS Data, you can download data in any format, making it versatile and adaptable for various applications.
Now, let’s walk through the simple steps of using the Converter Tool to Converting KMZ to ODS with MAPOG.
Step 1: Upload the Data
1. Click on the “Process Data” menu and choose the “Converter Tool” option.
2.Upload your KMZ file. This is your starting point where you provide the data that needs conversion.
Step 2: Select the Format for Conversion
1.Choose the output file format as ODS. The tool offers various formats, but for this guide, we are focusing on converting to ODS.
2.You can also set the CRS at this stage.
Step 3: Run the Conversion
Click ‘Convert’ and let the tool work its magic. The Converter Tool processes your data, transforming it from KMZ to ODS format.
Step 4: Review and Download
Finally, review your converted ODS data to ensure it looks right. Once satisfied, download the converted file. This step is crucial to verify that the conversion has been successful and the data integrity is maintained.
And there you have it! You’ve successfully used the Converter Tool in MAPOG Map Analysis to convert your KMZ files to ODS. Now you can easily convert your data for all your analysis needs. This feature simplifies the process of handling different data formats, making your workflow more efficient and effective.
Download and filter bank data in formats like Shapefile, KML, and GeoJSON with MAPOG for detailed mapping and analysis.
MAPOG offers a powerful tool to help you locate and download bank data. This information can be invaluable for creating maps, planning financial analyses, and exploring various banking locations. In this guide, we’ll walk you through the process of downloading bank data using MAPOG in multiple formats.
GIS Data is a specialized type of information that lets you visualize and analyze geographic locations on a map. With MAPOG, you can access GIS data that includes details about bank branches and their locations.
All data provided by MAPOG are in GCS datum EPSG:4326 WGS84 CRS (Coordinate Reference System).
Access to shapefile downloads requires logging in to the platform.
Bank data is crucial for several reasons. It helps individuals find nearby banking services and assists businesses in analyzing financial service distribution. With MAPOG GIS Data, you can download information about banks in multiple file formats, including KML, SHP, CSV, GeoJSON, Tab, SQL, Tiff, GML, KMZ, GPKZ, SQLITE, DXF, MIF, TOPOJSON, XLSX, GPX, ODS, MID, and GPS. This versatility allows you to use the data with various software and devices for diverse projects or analyses.
Step-by-step Process to Download Bank Data
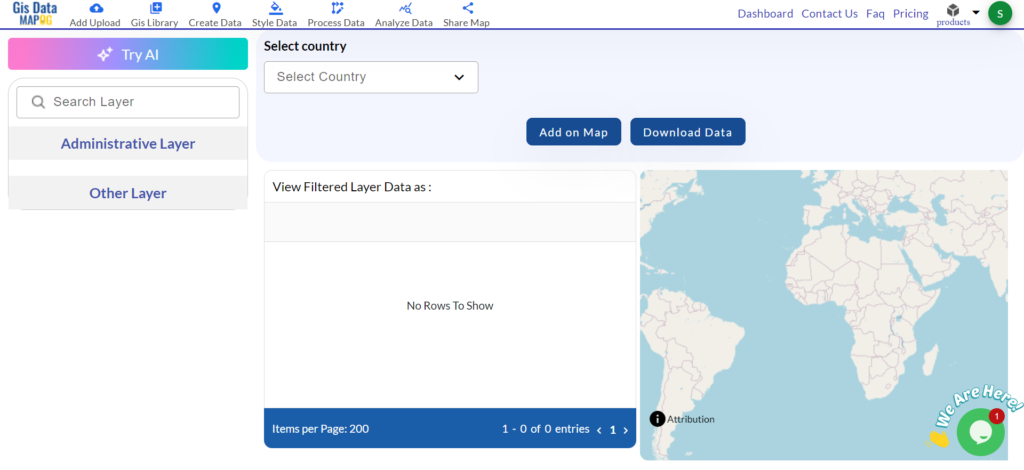
Step 1: Open GIS Data
Log in to MAPOG using your email credentials. After logging in, navigate to the GIS Data tool. You can easily find this in the top navigation menu. Look for the bank GIS data category or use the search function. For example, you can search specifically for the bank networks of countries like USA, UK, Germany, and Egypt.
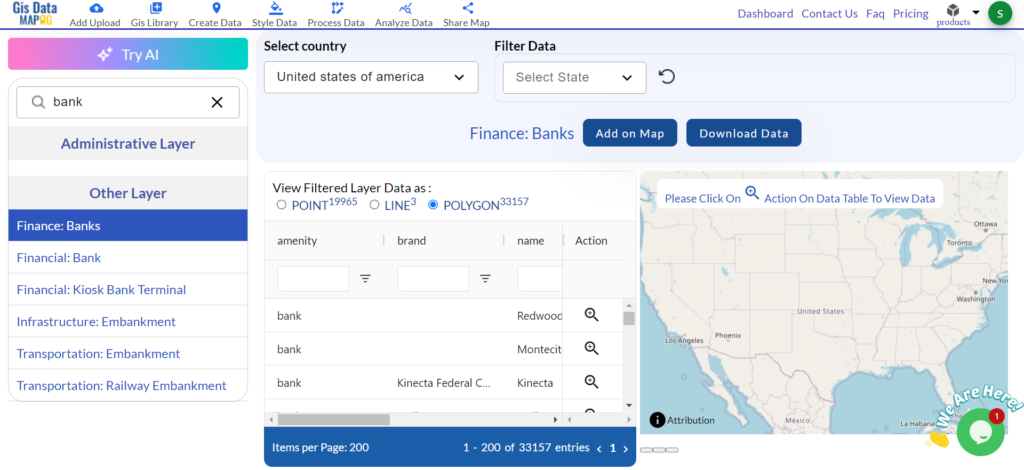
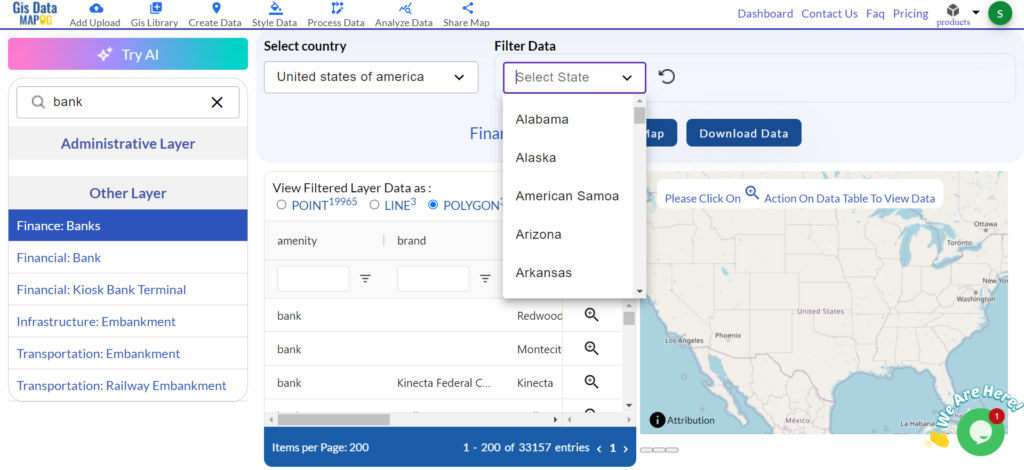
Step 2: Select the Country and Search for ‘Bank Data’
Start by selecting the country you’re interested in. Navigate through the available options and choose the specific country where you need hotel data. After selecting the country, search for the ‘Bank Data’ layer that contains the relevant information.
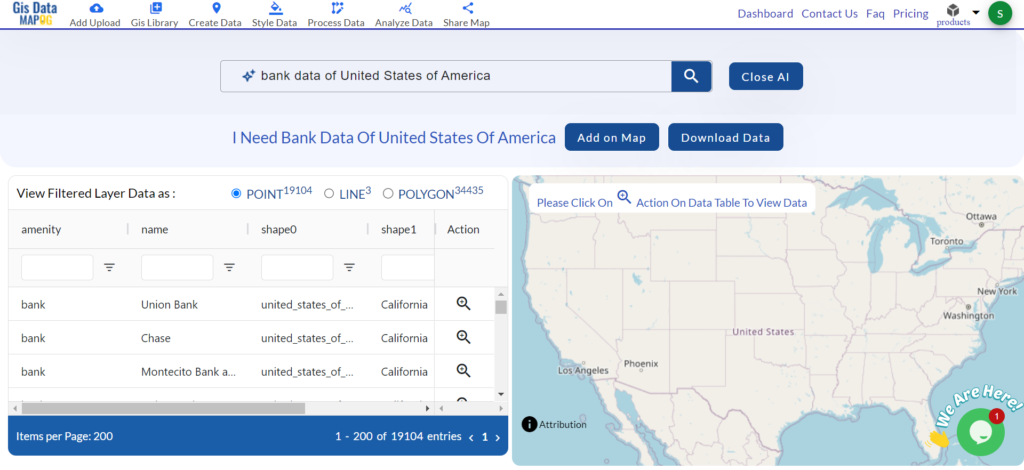
If you’re unsure which country or layer to choose, use the “Try AI” feature and It gives smart suggestions based on your needs and help you find the right data easily.
Step 3: Filter the Data
Apply the available filters to refine your search. You can select specific areas, types of banking institutions or other criteria to get the exact data you need.
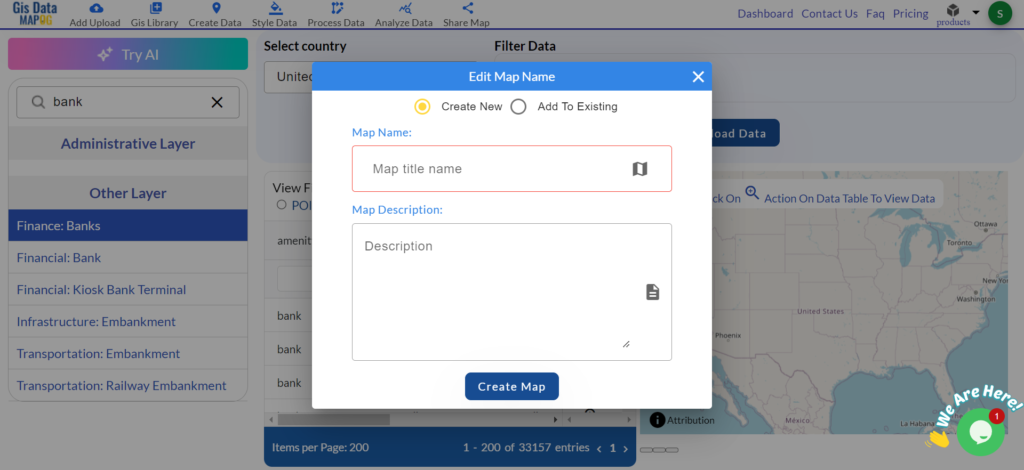
Step 4: Add to Map
After filtering the data, add it to your map and This step will show the locations of bank branches on your map, making it easier to visualize their placement.
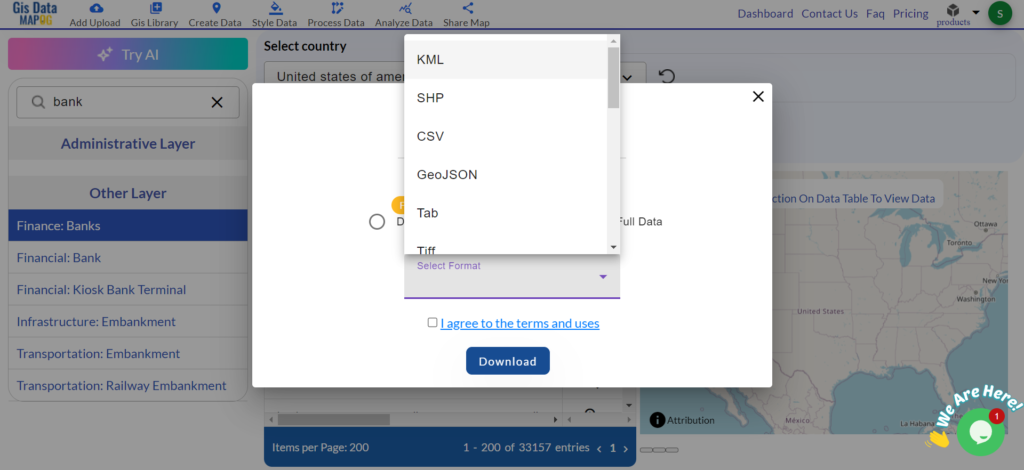
Step 5: Download the Data
After reviewing the map, click the download button to download bank data. You can select from various file formats depending on your project needs.
Bank data consists of both point and polygon features because point data shows the exact location of each bank branch, while polygon data illustrates the boundaries or areas around banking facilities. These features provide a detailed view of bank locations and their surroundings and beneficial for creating comprehensive maps and conducting thorough analyses.
For more information or assistance with downloading hotel data, please contact us at support@mapog.com.
Disclaimer:
The GIS data provided for download in this article was initially sourced from OpenStreetMap (OSM) and However, it has been further modified to enhance its usability. It’s important to note that the original data is licensed under the Open Database License (ODbL) by OpenStreetMap contributors. Although modifications have been made to improve the data, any use, redistribution, or further modification must still comply with the terms of the ODbL license. For additional details, please visit OpenStreetMap’s License Page.
In this guide, we’ll walk you through how to efficiently convert your KMZ files to XLSX using the powerful Converter Tool in MAPOG Map Analysis. Whether you’re a beginner or an experienced user, Converting KMZ to XLSX with MAPOG, this tutorial will help you understand the process in easy steps.
Key Concept of Converting files
The Converter Tool is a feature in MAPOG Map Analysis that helps you change your data from one format to another. It’s like magic! You give it your data in one form, and it transforms it into another form that you need for your analysis. Additionally, with GIS Data, you can download data in any format, making it versatile and adaptable for various applications.
Now, let’s walk through the simple steps of using the Converter Tool to Converting KMZ to XLSX with MAPOG.
Step 1: Upload the Data
1. Click on the “Process Data” menu and choose the “Converter Tool” option.
2.Upload your KMZ file. This is your starting point where you provide the data that needs conversion.
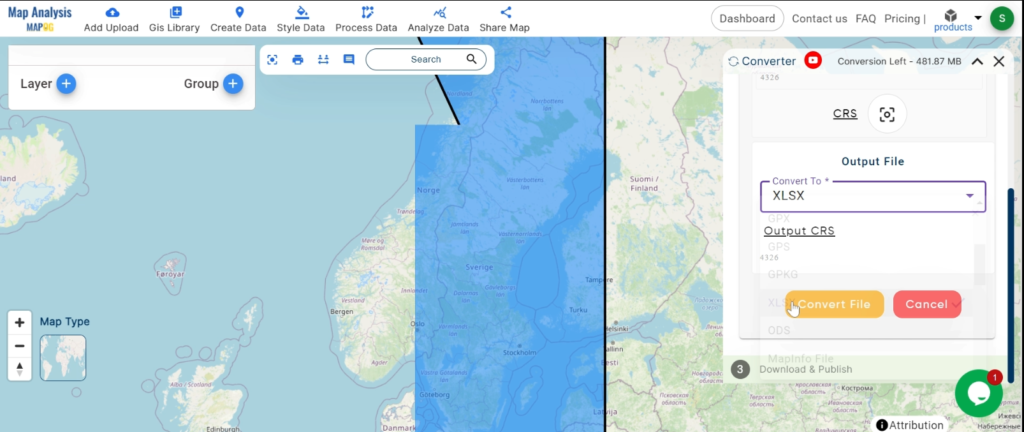
Step 2: Select the Format for Conversion
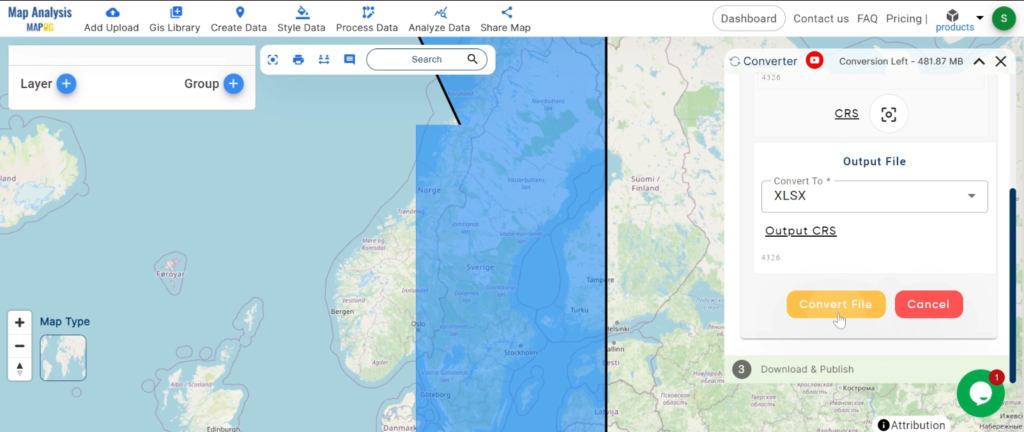
1.Choose the output file format as XLSX. The tool offers various formats, but for this guide, we are focusing on converting to XLSX.
2.You can also set the CRS at this stage.
Step 3: Run the Conversion
Click ‘Convert’ and let the tool work its magic. The Converter Tool processes your data, transforming it from KMZ to XLSX format.
Step 4: Review and Download
Finally, review your converted XLSX data to ensure it looks right. Once satisfied, download the converted file. This step is crucial to verify that the conversion has been successful and the data integrity is maintained.
And there you have it! You’ve successfully used the Converter Tool in MAPOG Map Analysis to convert your KMZ files to XLSX. Now you can easily convert your data for all your analysis needs. This feature simplifies the process of handling different data formats, making your workflow more efficient and effective.
KMZ to GPKG using MAPOG, you can transform gis data, making it easier to analyze, share, and integrate into various GIS applications.
In this guide, we’ll walk you through how to efficiently convert your KMZ files to GPKG using the powerful Converter Tool in MAPOG Map Analysis. Whether you’re a beginner or an experienced user, Converting KMZ to GPKG with MAPOG, this tutorial will help you understand the process in easy steps.
Key Concept of Converting files
The Converter Tool is a feature in MAPOG Map Analysis that helps you change your data from one format to another. It’s like magic! You give it your data in one form, and it transforms it into another form that you need for your analysis. Additionally, with GIS Data, you can download data in any format, making it versatile and adaptable for various applications.
Online KMZ to GPKG GIS Converter
Now, let’s walk through the simple steps of using the Converter Tool to Converting KMZ to GPKG with MAPOG.
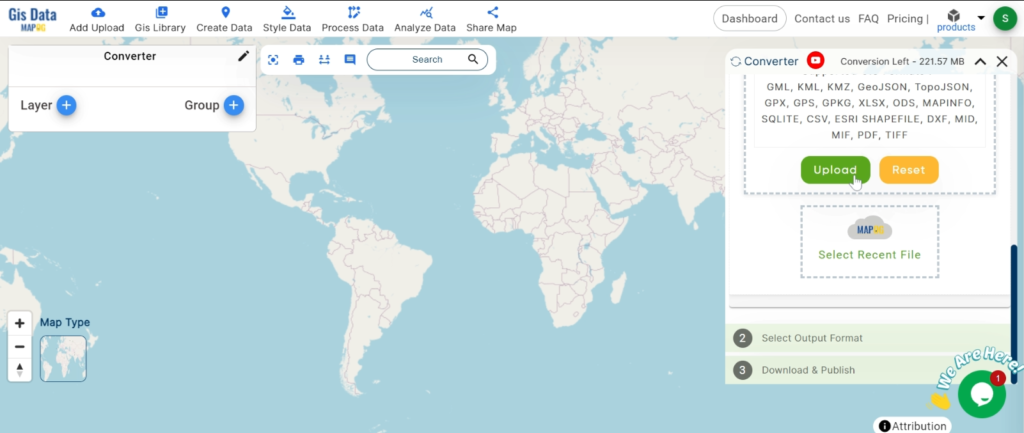
Step 1: Upload the Data
1. Click on the “Process Data” menu and choose the “Converter Tool” option.
2.Upload your KMZ file. This is your starting point where you provide the data that needs conversion.
Step 2: Select the Format for Conversion
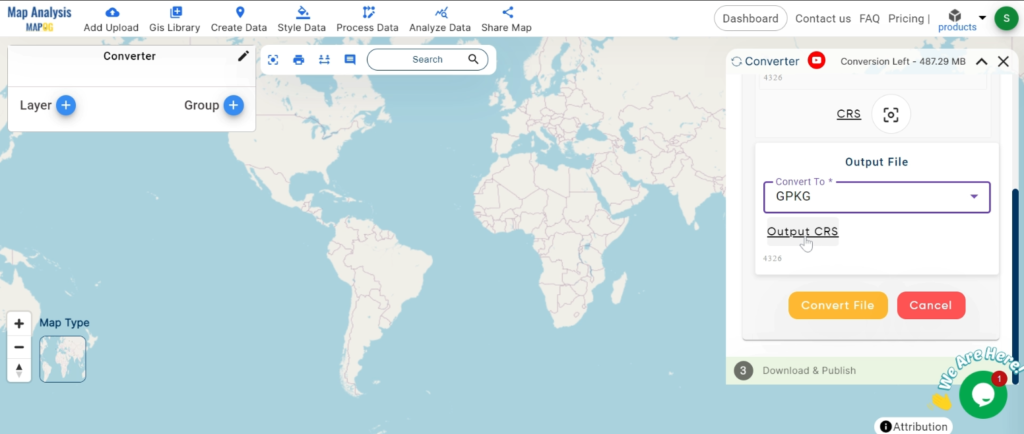
1.Choose the output file format as GPKG. The tool offers various formats, but for this guide, we are focusing on converting to GPKG.
2.You can also set the CRS at this stage.
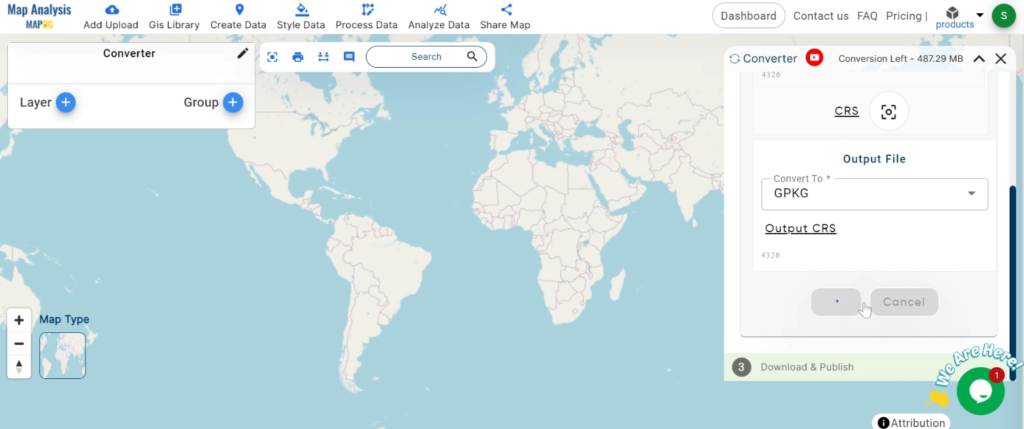
Step 3: Run the Conversion
Click ‘Convert’ and let the tool work its magic. The Converter Tool processes your data, transforming it from KMZ to GPKG format.
Step 4: Review and Download
Finally, review your converted GPKG data to ensure it looks right. Once satisfied, download the converted file. This step is crucial to verify that the conversion has been successful and the data integrity is maintained.
And there you have it! You’ve successfully used the Converter Tool in MAPOG Map Analysis to convert your KMZ files to GPKG. Now you can easily convert your data for all your analysis needs. This feature simplifies the process of handling different data formats, making your workflow more efficient and effective.
In this guide, we’ll walk you through how to efficiently convert your KMZ files to GPX using the powerful Converter Tool in MAPOG Map Analysis. Whether you’re a beginner or an experienced user, Converting KMZ to GPX with MAPOG, this tutorial will help you understand the process in easy steps.
Key Concept of Converting files
The Converter Tool is a feature in MAPOG Map Analysis that helps you change your data from one format to another. It’s like magic! You give it your data in one form, and it transforms it into another form that you need for your analysis. Additionally, with GIS Data, you can download data in any format, making it versatile and adaptable for various applications.
Online KMZ to GPX GIS Converter
Now, let’s walk through the simple steps of using the Converter Tool to Converting KMZ to GPX with MAPOG.
Step 1: Upload the Data
1. Click on the “Process Data” menu and choose the “Converter Tool” option.
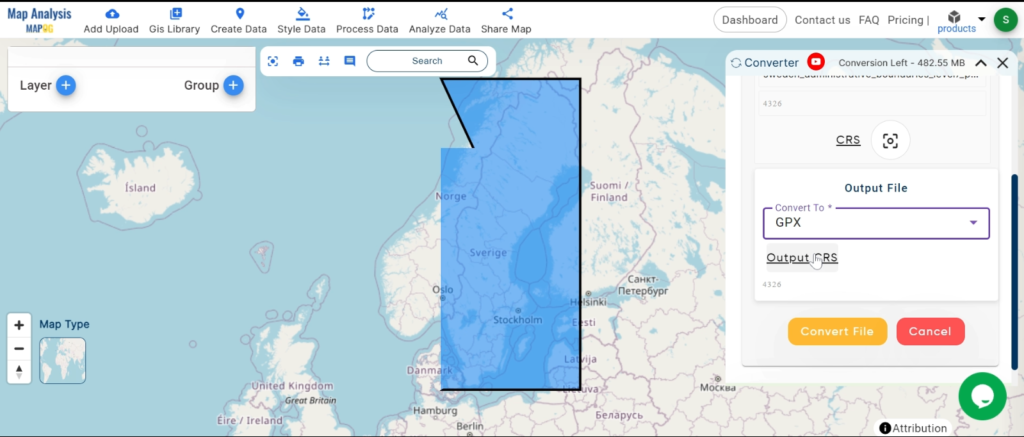
2.Upload your KMZ file. This is your starting point where you provide the data that needs conversion.
Step 2: Select the Format for Conversion
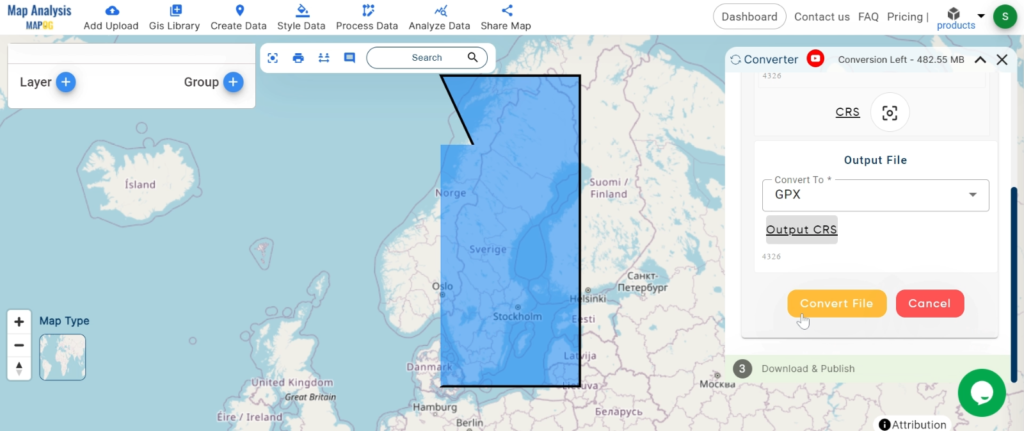
1.Choose the output file format as GPX. The tool offers various formats, but for this guide, we are focusing on converting to GPX.
2.You can also set the CRS at this stage.
Step 3: Run the Conversion
Click ‘Convert’ and let the tool work its magic. The Converter Tool processes your data, transforming it from KMZ to GPX format.
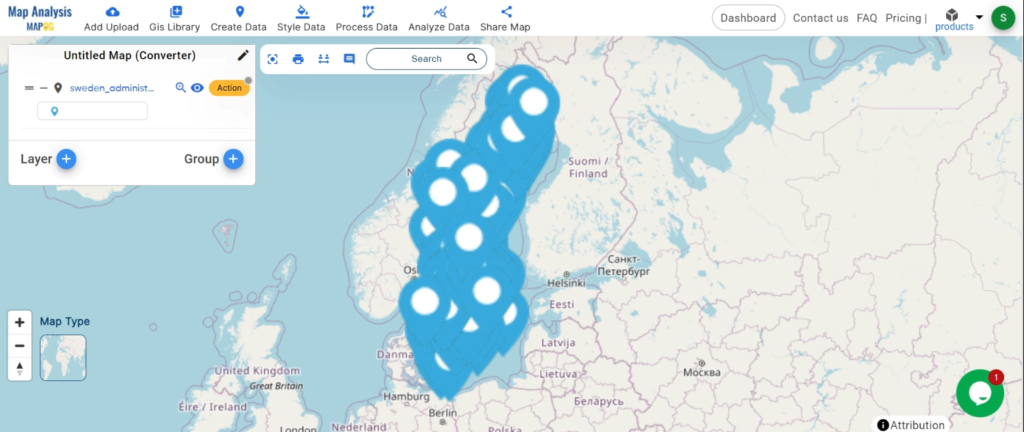
Step 4: Review and Download
Finally, review your converted GPX data to ensure it looks right. Once satisfied, download the converted file. This step is crucial to verify that the conversion has been successful and the data integrity is maintained.
And there you have it! You’ve successfully used the Converter Tool in MAPOG Map Analysis to convert your KMZ files to GPX. Now you can easily convert your data for all your analysis needs. This feature simplifies the process of handling different data formats, making your workflow more efficient and effective.
In this guide, we’ll walk you through how to efficiently convert your KMZ files to TopoJSON using the powerful Converter Tool in MAPOG Map Analysis. Whether you’re a beginner or an experienced user, Converting KMZ to TopoJSON with MAPOG, this tutorial will help you understand the process in easy steps.
Key Concept of Converting files
The Converter Tool is a feature in MAPOG Map Analysis that helps you change your data from one format to another. It’s like magic! You give it your data in one form, and it transforms it into another form that you need for your analysis. Additionally, with GIS Data, you can download data in any format, making it versatile and adaptable for various applications.
Online KMZ to TopoJSON GIS Converter
Now, let’s walk through the simple steps of using the Converter Tool to Converting KMZ to TopoJSON with MAPOG.
Step 1: Upload the Data
1. Click on the “Process Data” menu and choose the “Converter Tool” option.
2.Upload your KMZ file. This is your starting point where you provide the data that needs conversion.
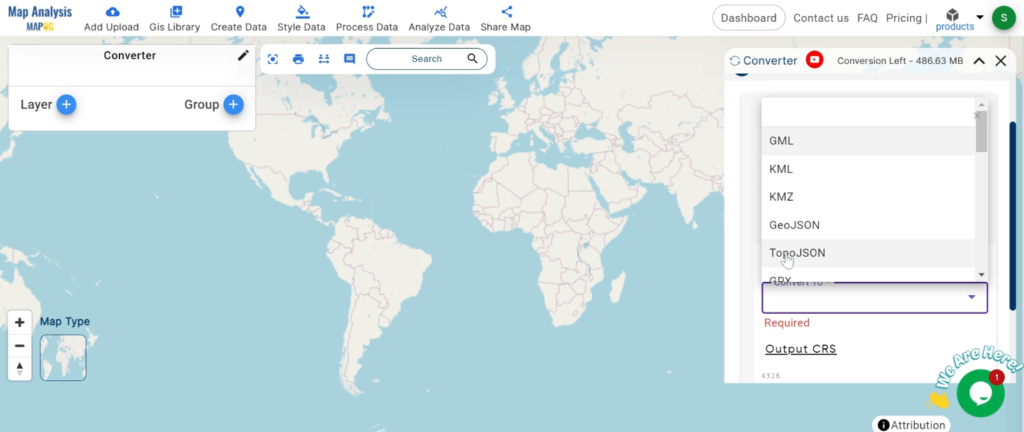
Step 2: Select the Format for Conversion
1.Choose the output file format as TopoJSON. The tool offers various formats, but for this guide, we are focusing on converting to TopoJSON.
2.You can also set the CRS at this stage.
Step 3: Run the Conversion
Click ‘Convert’ and let the tool work its magic. The Converter Tool processes your data, transforming it from KMZ to TopoJSON format.
Step 4: Review and Download
Finally, review your converted TopoJSON data to ensure it looks right. Once satisfied, download the converted file. This step is crucial to verify that the conversion has been successful and the data integrity is maintained.
And there you have it! You’ve successfully used the Converter Tool in MAPOG Map Analysis to convert your KMZ files to TopoJSON. Now you can easily convert your data for all your analysis needs. This feature simplifies the process of handling different data formats, making your workflow more efficient and effective.
KMZ to GeoJSON using MAPOG, you can transform your gis data, making it easier to analyze, share, and integrate into various GIS applications.
In this guide, we’ll walk you through how to efficiently convert your KMZ files to GeoJSON using the powerful Converter Tool in MAPOG Map Analysis. Whether you’re a beginner or an experienced user, Converting KMZ to GeoJSON with MAPOG, this tutorial will help you understand the process in easy steps.
Key Concept of Converting GIS format files
The Converter Tool is a feature in MAPOG Map Analysis that helps you change your data from one format to another. It’s like magic! You give it your data in one form, and it transforms it into another form that you need for your analysis. Additionally, with GIS Data, you can download data in any format, making it versatile and adaptable for various applications.
Online KMZ to GeoJSON GIS Converter
Now, let’s walk through the simple steps of using the Converter Tool to Converting KMZ to GeoJSON with MAPOG.
Step 1: Upload the Data
1. Click on the “Process Data” menu and choose the “Converter Tool” option.
2.Upload your KMZ file. This is your starting point where you provide the data that needs conversion.
Step 2: Select the Format for Conversion
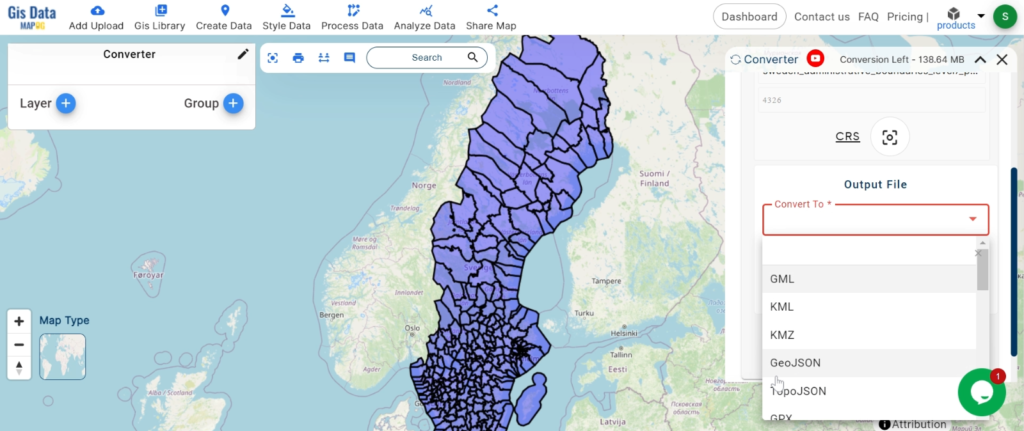
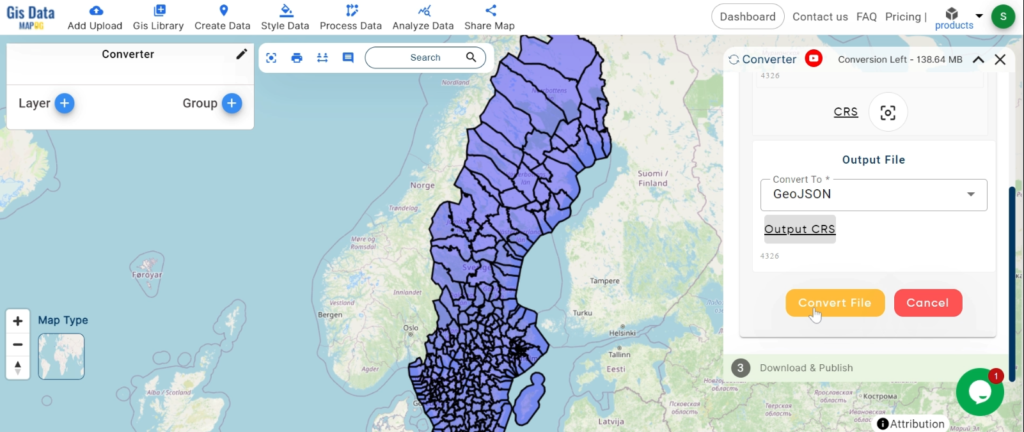
1.Choose the output file format as GeoJSON. The tool offers various formats, but for this guide, we are focusing on converting to GeoJSON.
2.You can also set the CRS at this stage.
Step 3: Run the Conversion
Click ‘Convert’ and let the tool work its magic. The Converter Tool processes your data, transforming it from KMZ to GeoJSON format.
Step 4: Review and Download
Finally, review your converted GeoJSON data to ensure it looks right. Once satisfied, download the converted file. This step is crucial to verify that the conversion has been successful and the data integrity is maintained.
And there you have it! You’ve successfully used the Converter Tool in MAPOG Map Analysis to convert your KMZ files to GeoJSON. Now you can easily convert your data for all your analysis needs. This feature simplifies the process of handling different data formats, making your workflow more efficient and effective.
KMZ to SHP using MAPOG, you can transform gis data, making it easier to analyze, share, and integrate into various GIS applications.
In this guide, we’ll walk you through how to efficiently convert your KMZ files to SHP using the powerful Converter Tool in MAPOG Map Analysis. Whether you’re a beginner or an experienced user, Converting KMZ to SHP with MAPOG, this tutorial will help you understand the process in easy steps.
Key Concept of Converting files
The Converter Tool is a feature in MAPOG Map Analysis that helps you change your data from one format to another. It’s like magic! You give it your data in one form, and it transforms it into another form that you need for your analysis. Additionally, with GIS Data, you can download data in any format, making it versatile and adaptable for various applications.
Online KMZ to SHP GIS Converter
Now, let’s walk through the simple steps of using the Converter Tool to Converting KMZ to SHP with MAPOG.
Step 1: Upload the Data
1. Click on the “Process Data” menu and choose the “Converter Tool” option.
2.Upload your KMZ file. This is your starting point where you provide the data that needs conversion.
Step 2: Select the Format for Conversion
1.Choose the output file format as SHP. The tool offers various formats, but for this guide, we are focusing on converting to SHP.
2.You can also set the CRS at this stage.
Step 3: Run the Conversion
Click ‘Convert’ and let the tool work its magic. The Converter Tool processes your data, transforming it from KMZ to SHP format.
Step 4: Review and Download
Finally, review your converted SHP data to ensure it looks right. Once satisfied, download the converted file. This step is crucial to verify that the conversion has been successful and the data integrity is maintained.
And there you have it! You’ve successfully used the Converter Tool in MAPOG Map Analysis to convert your KMZ files to SHP. Now you can easily convert your data for all your analysis needs. This feature simplifies the process of handling different data formats, making your workflow more efficient and effective.
We use cookies to ensure that we give you the best experience on our website. If you continue to use this site we will assume that you are happy with it.Ok