In the world of Geographic Information Systems (GIS), file conversion is essential for ensuring that geospatial data is compatible with different platforms and tools. Converting CSV to TopoJSON allows you to visualize your data.
What is CSV File?
A CSV file (Comma-Separated Values) is a simple text file that stores data in a table format. Each line represents a row, and the values in each row are separated by commas, making it easy to organize and share information like a spreadsheet.
Key Concept for Conversion CSV to Topojson:
The MAPOG MapAnalysis Converter Tool is designed to make data conversion between various formats seamless and user-friendly. Below is a step-by-step guide on how to convert CSV files to TopoJSON format using MAPOG.
Step-by-Step Guide to Converting CSV to TopoJSON
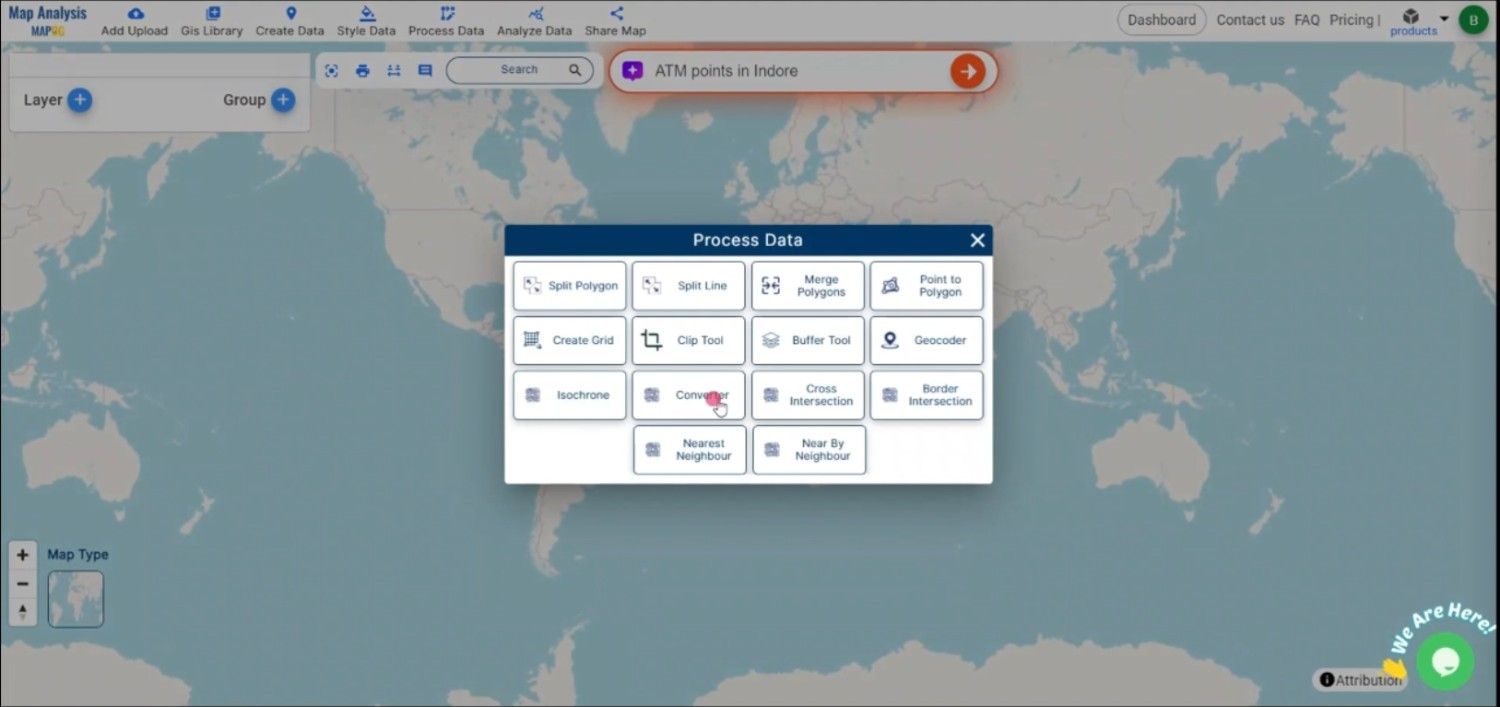
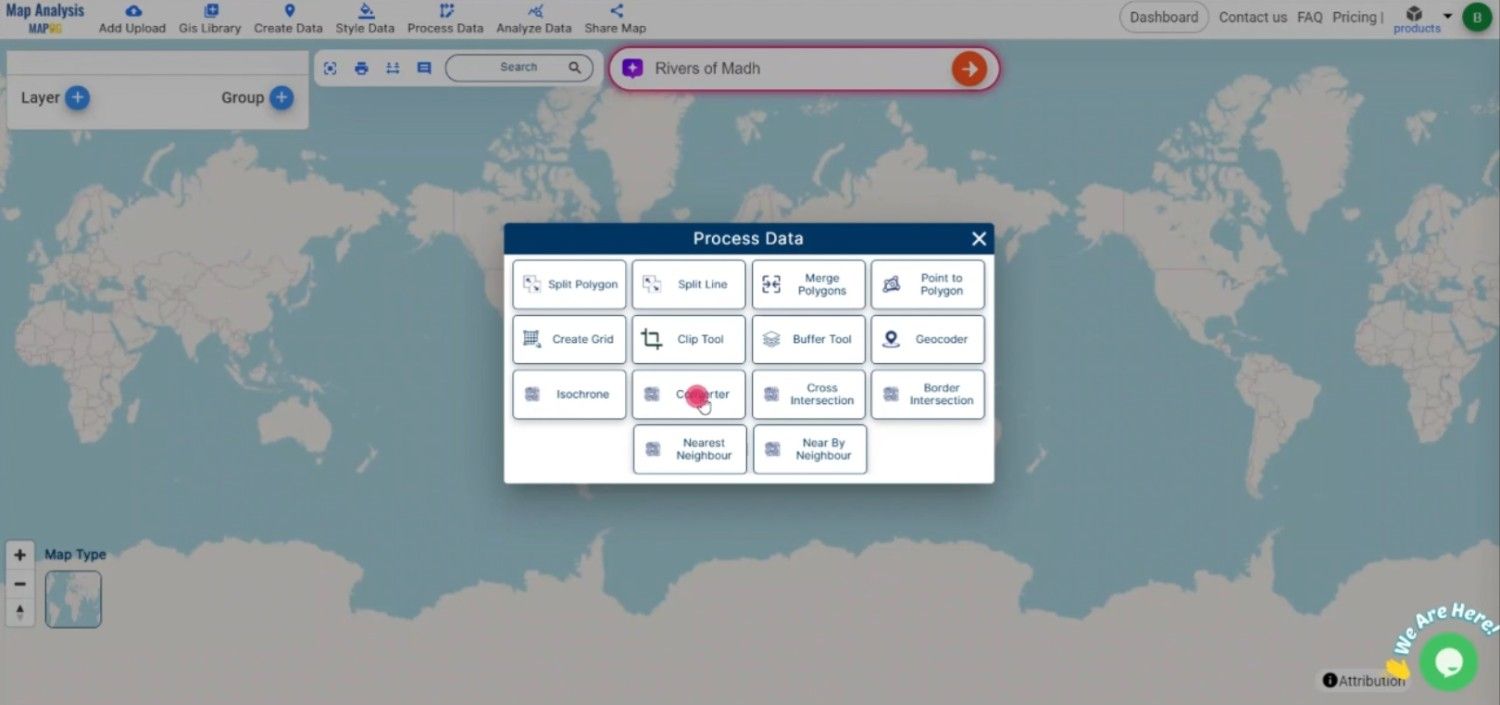
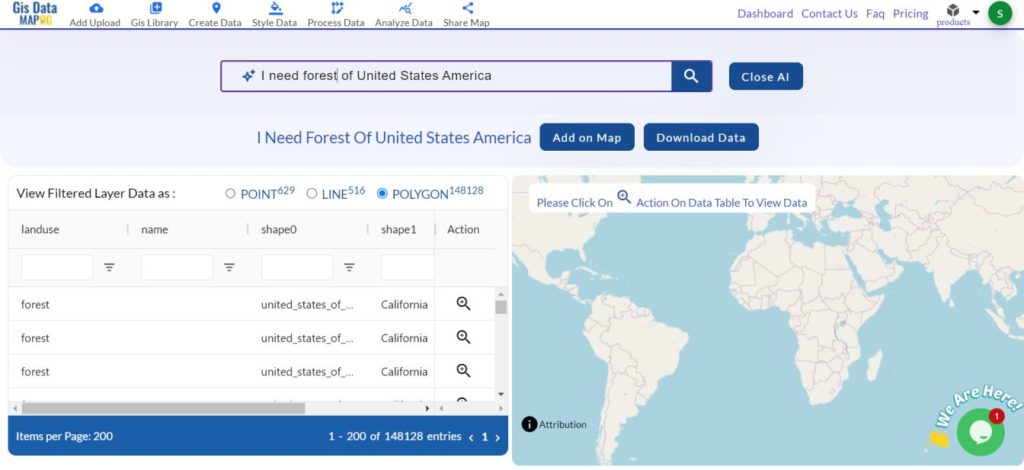
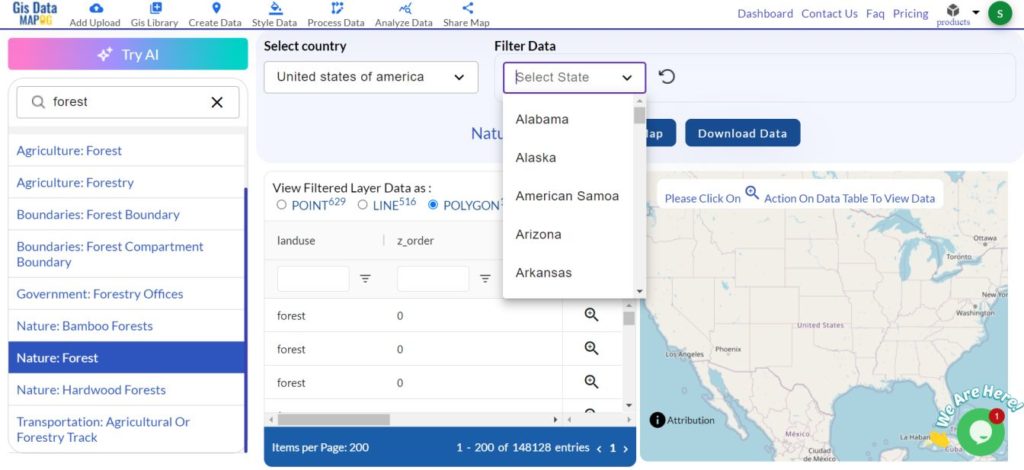
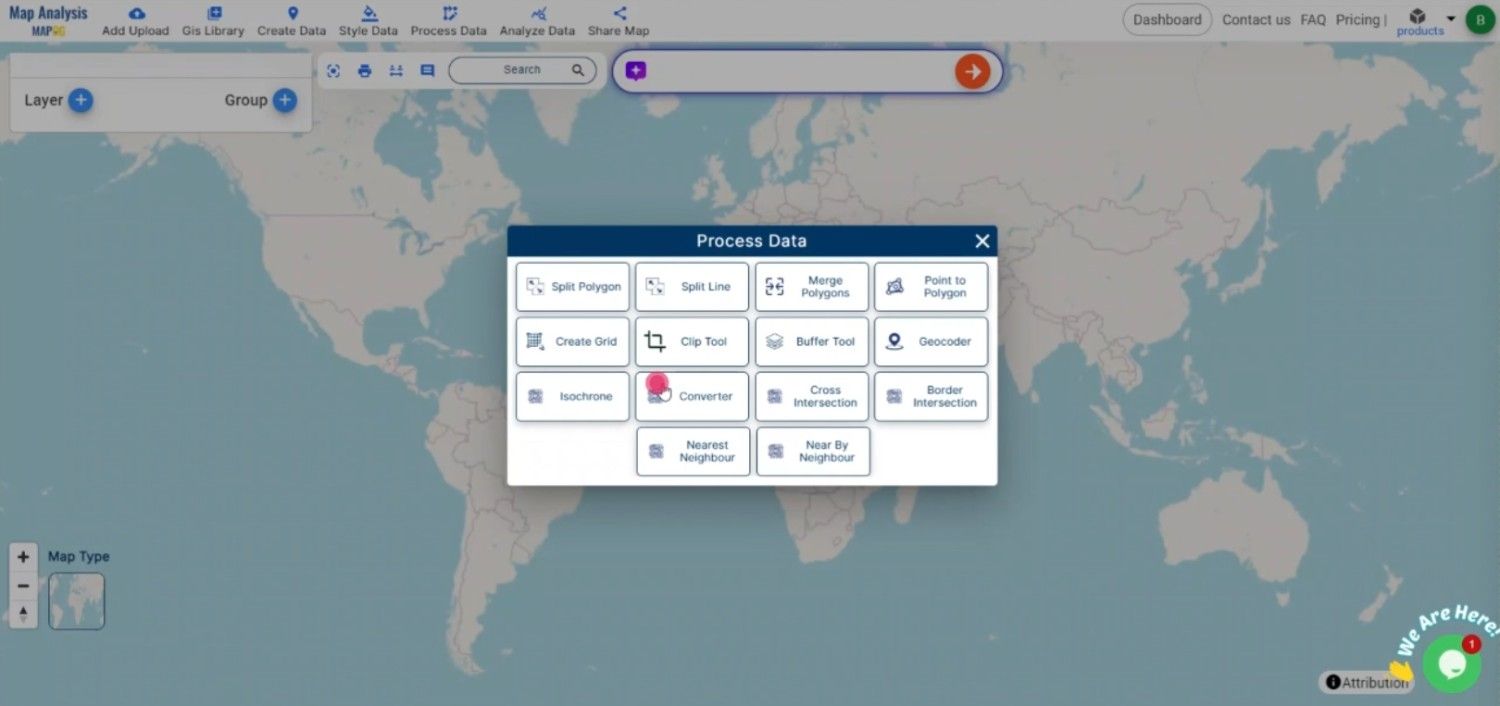
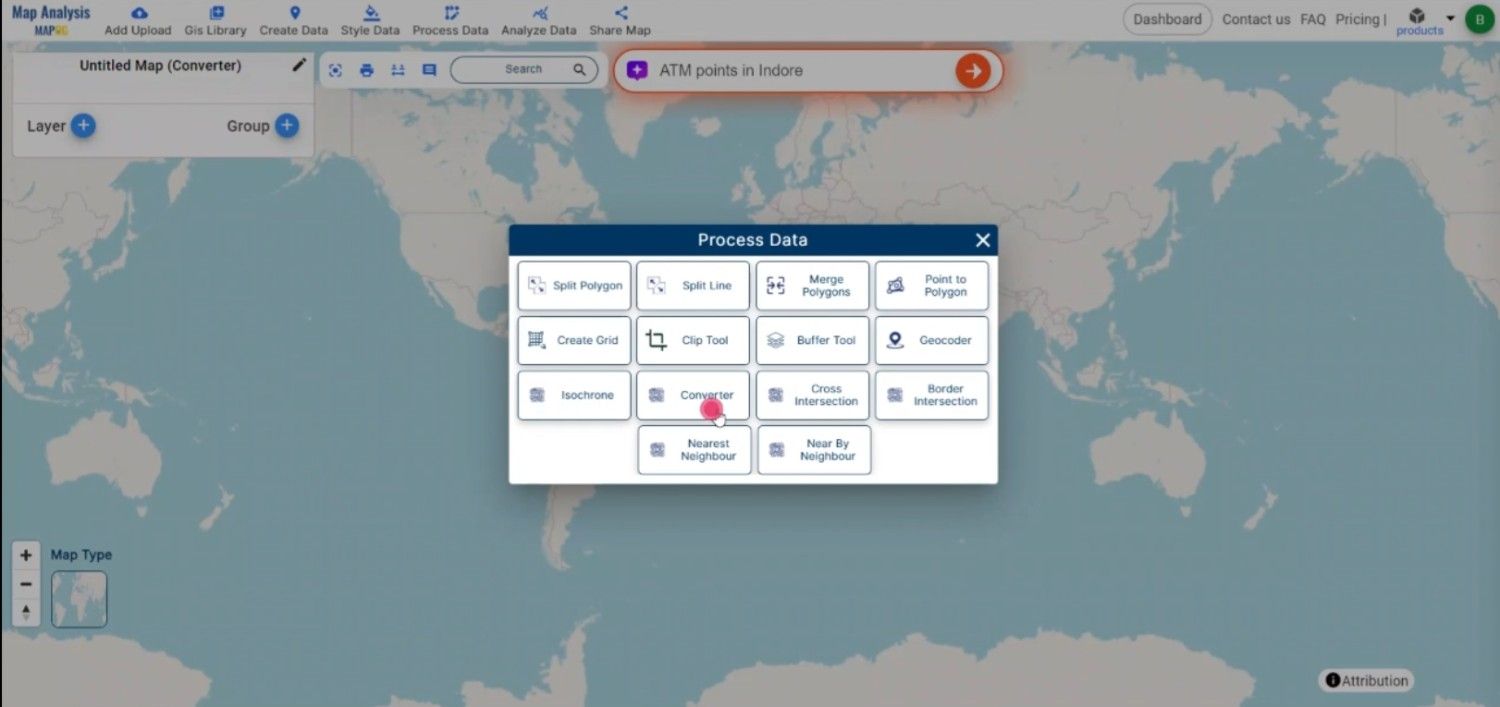
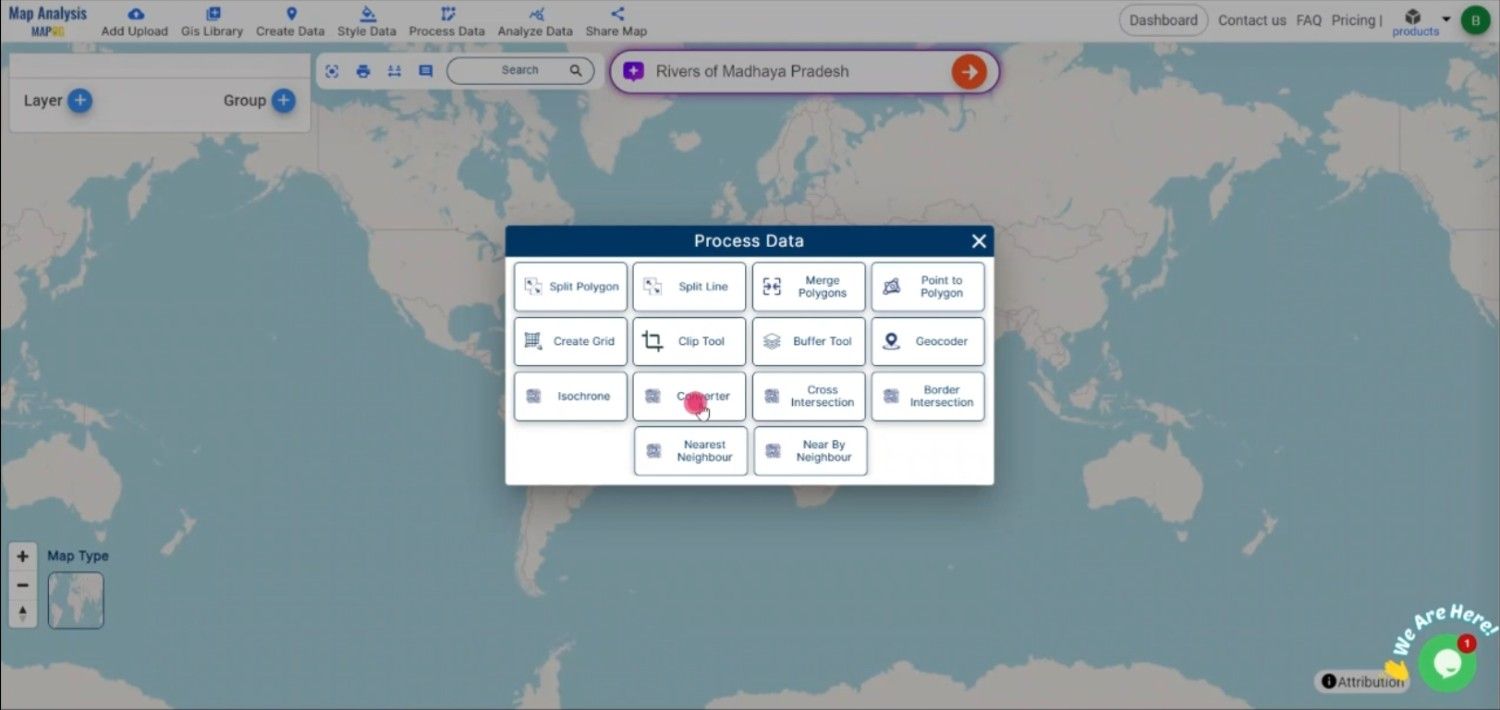
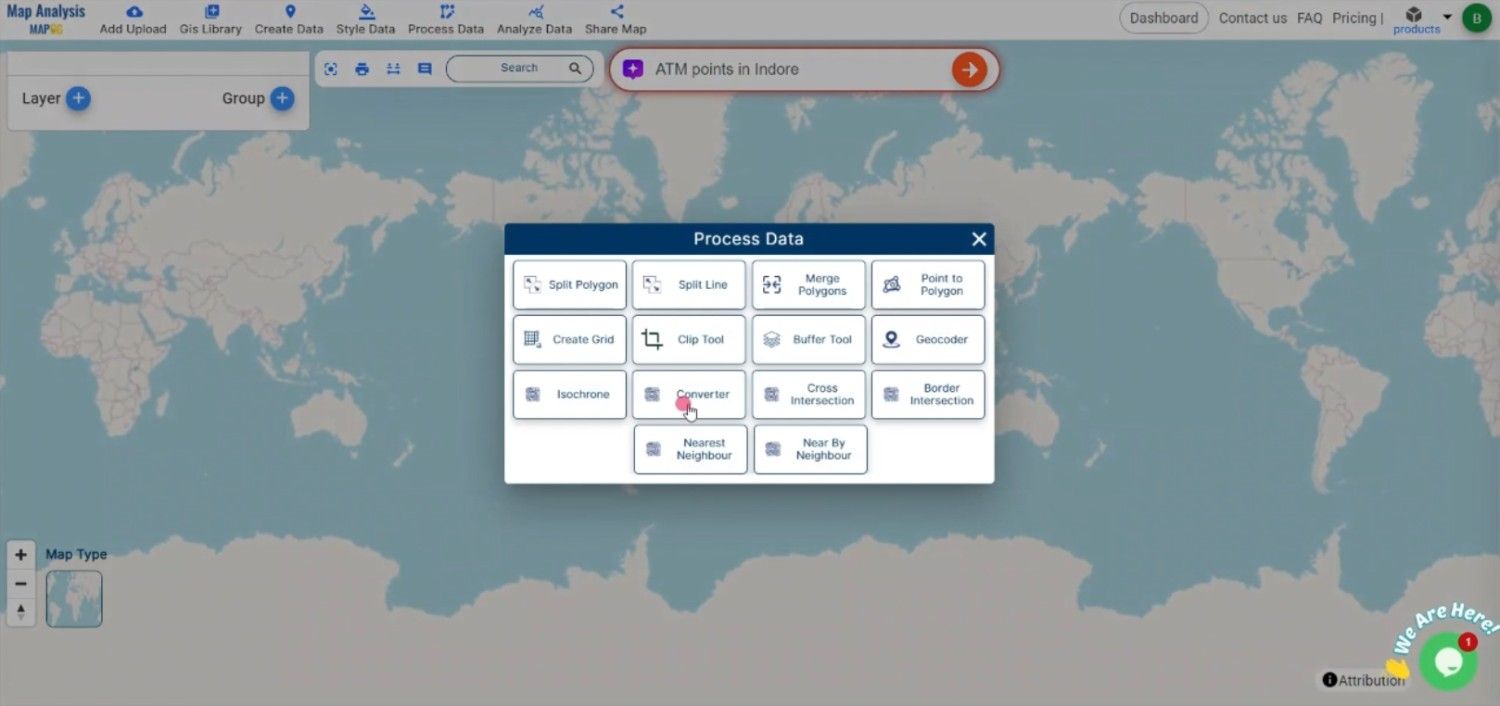
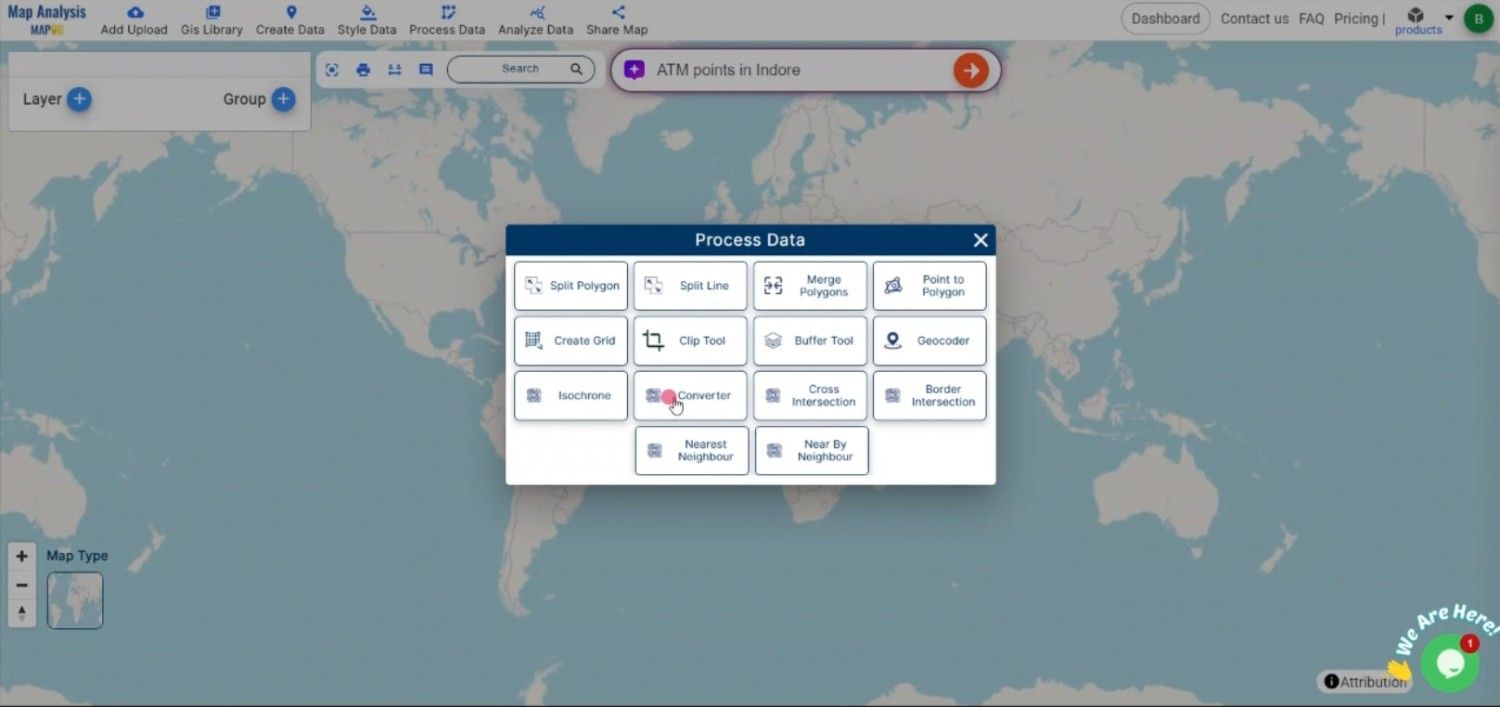
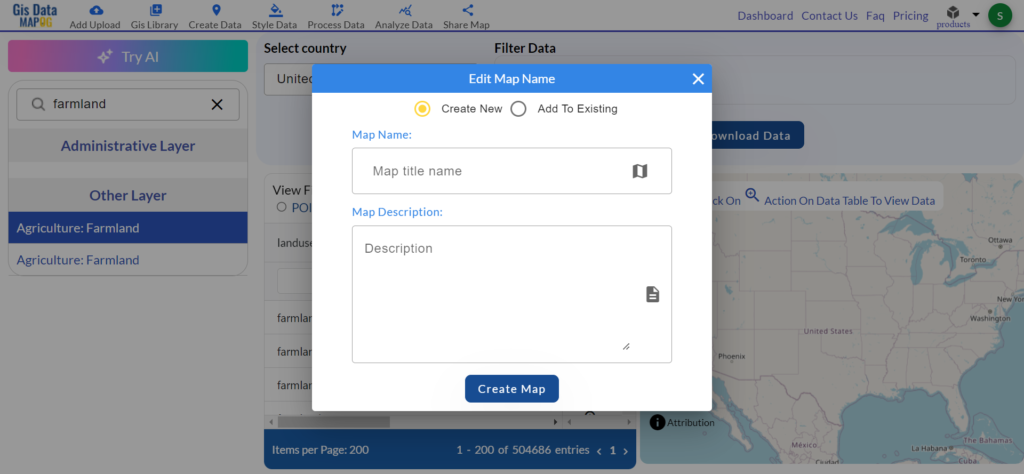
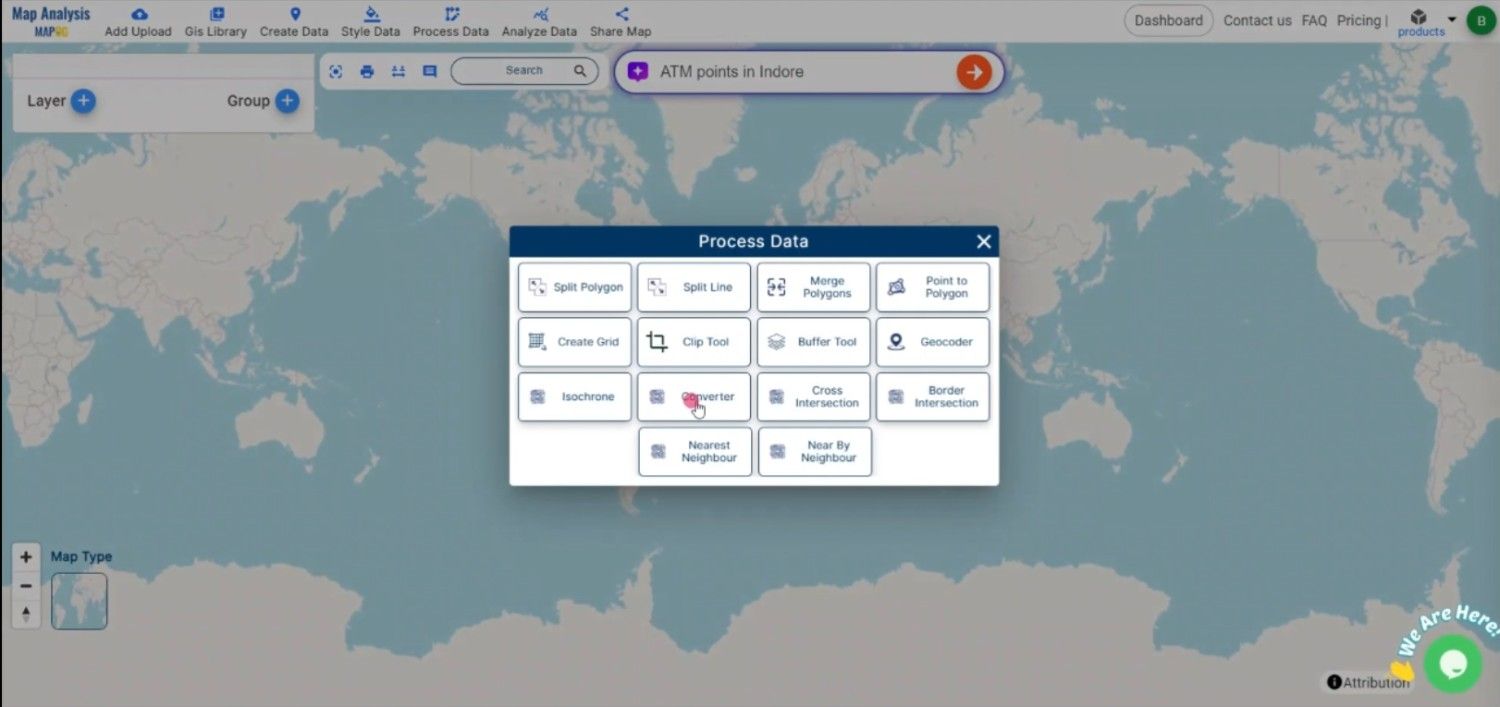
Step 1: Upload Your CSV Data
Begin by navigating to the “Process Data” section in MAPOG MapAnalysis and selecting the “Converter Tool” option. Before uploading, ensure your CSV file is well-organized, with columns representing necessary attributes like coordinates and any other relevant data fields.
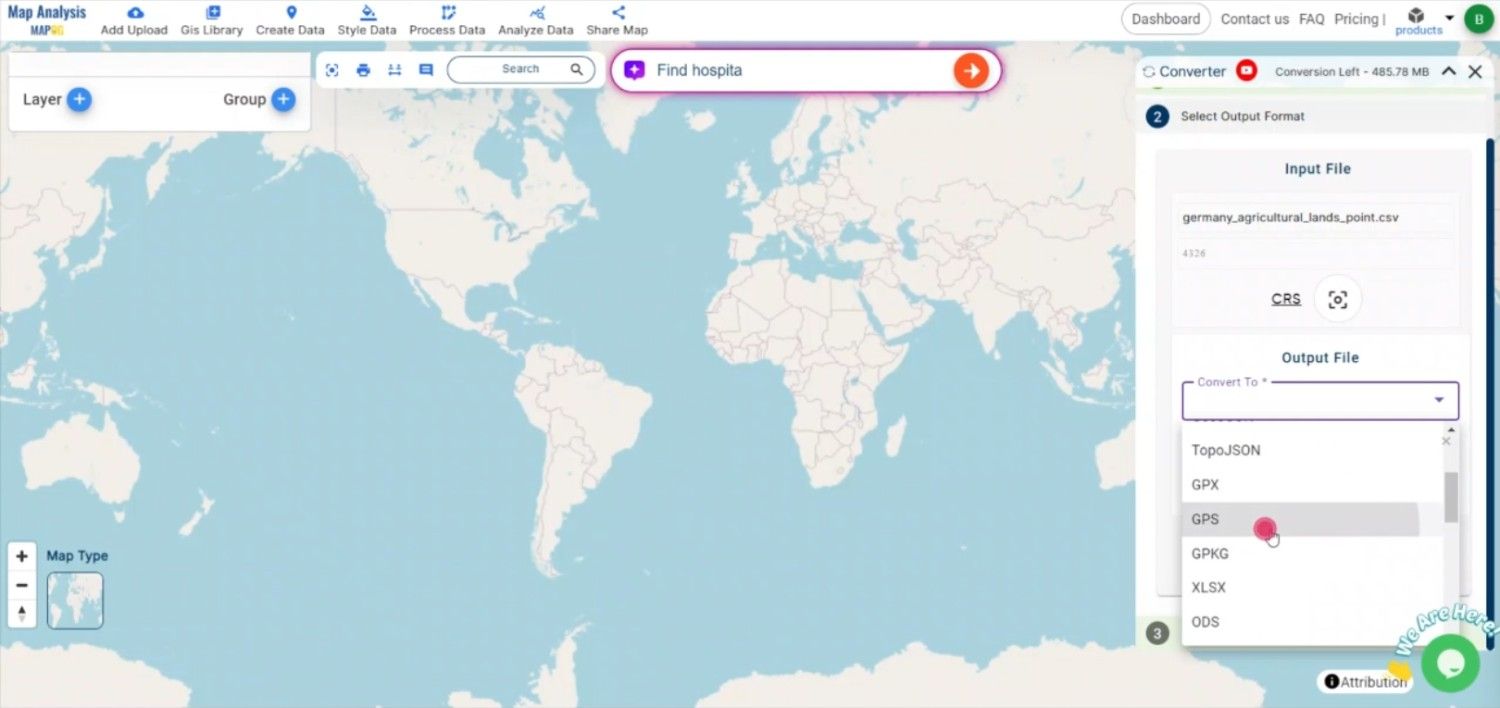
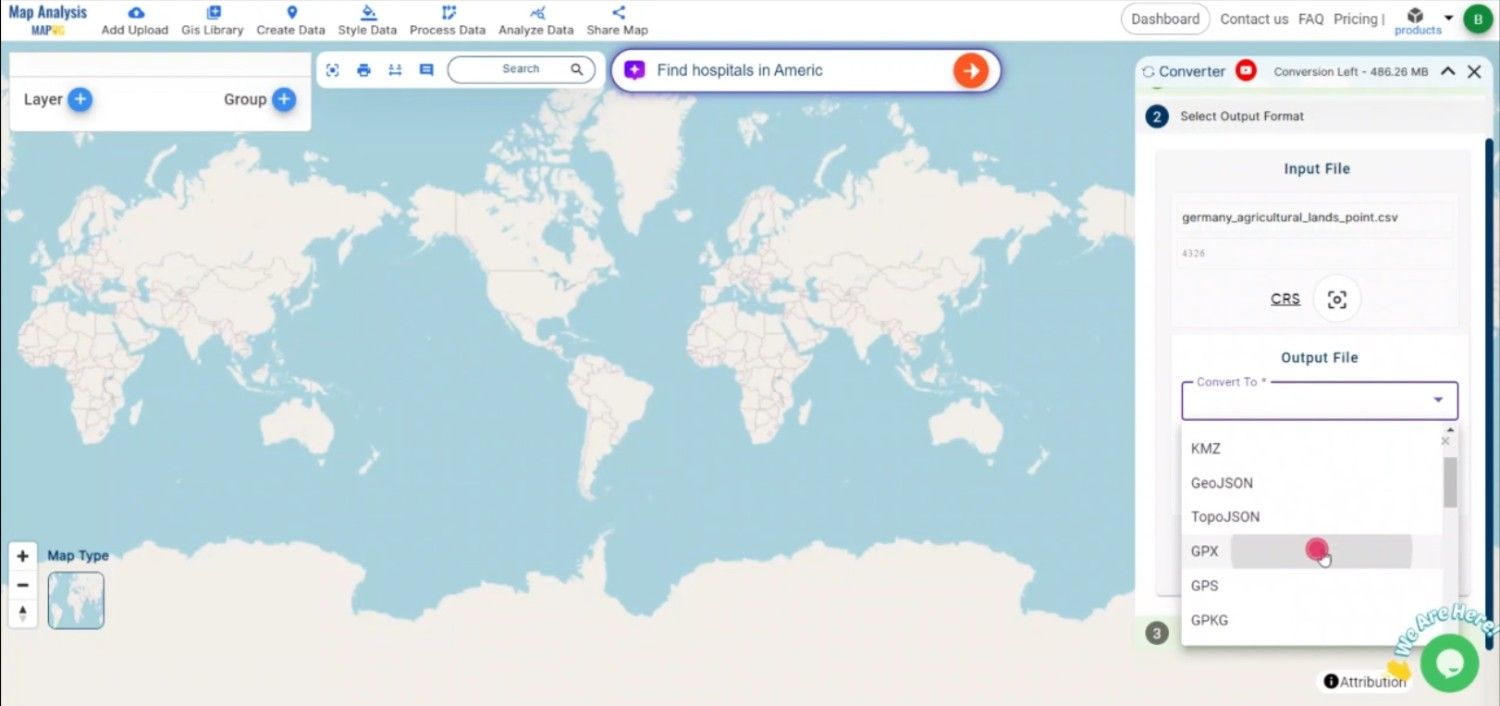
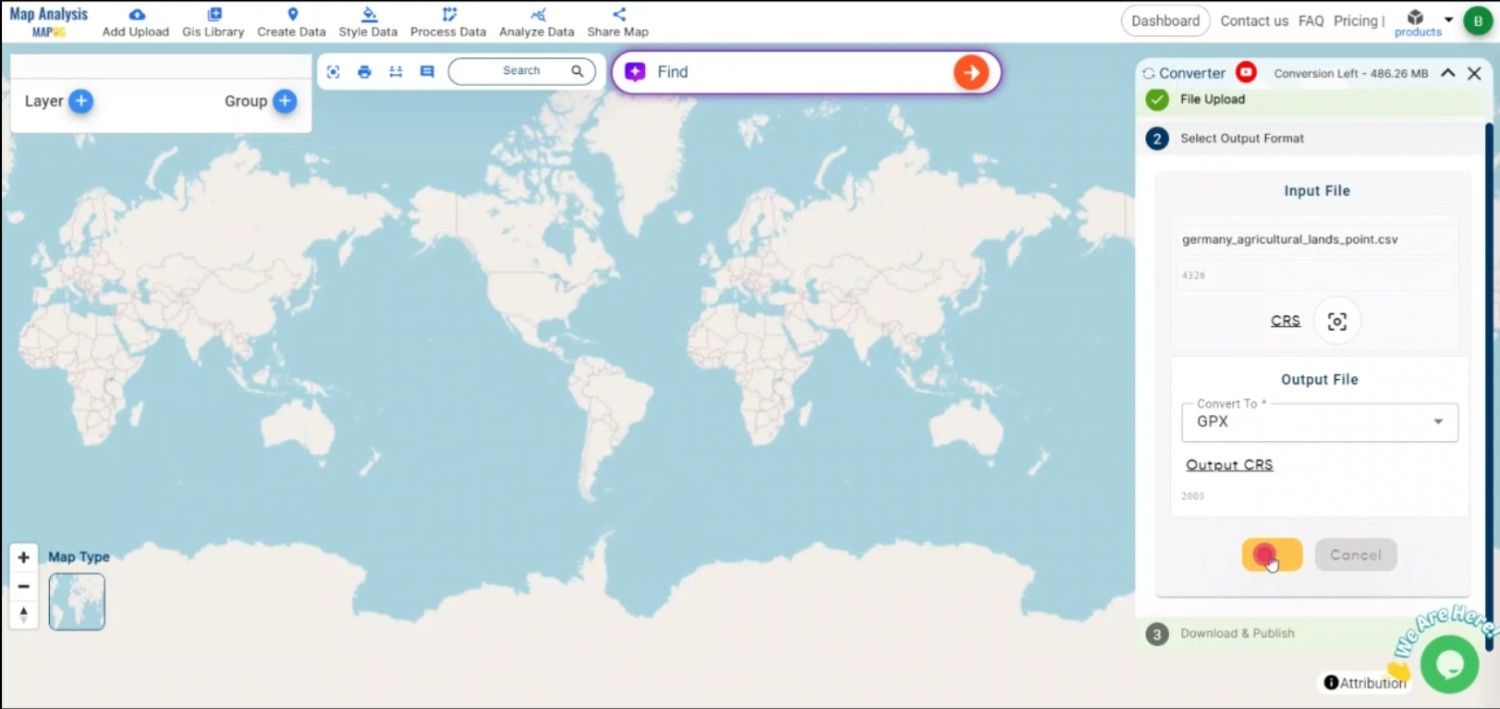
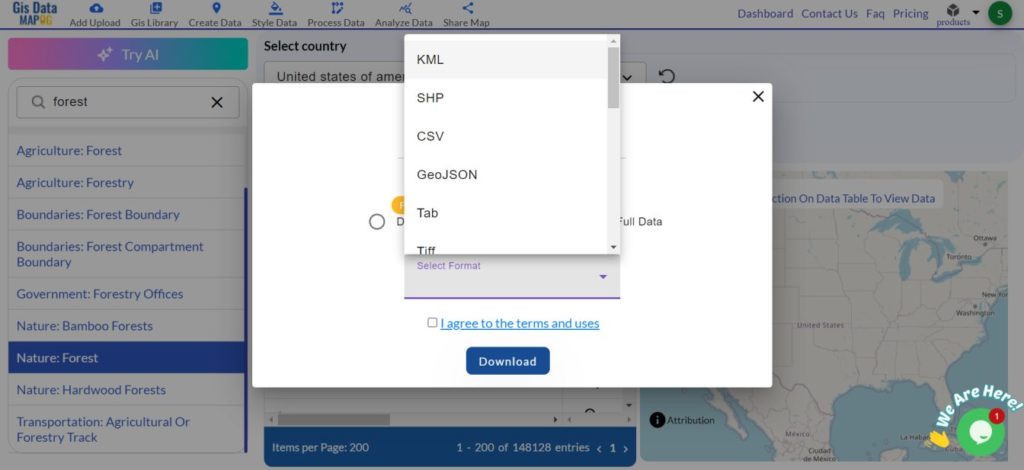
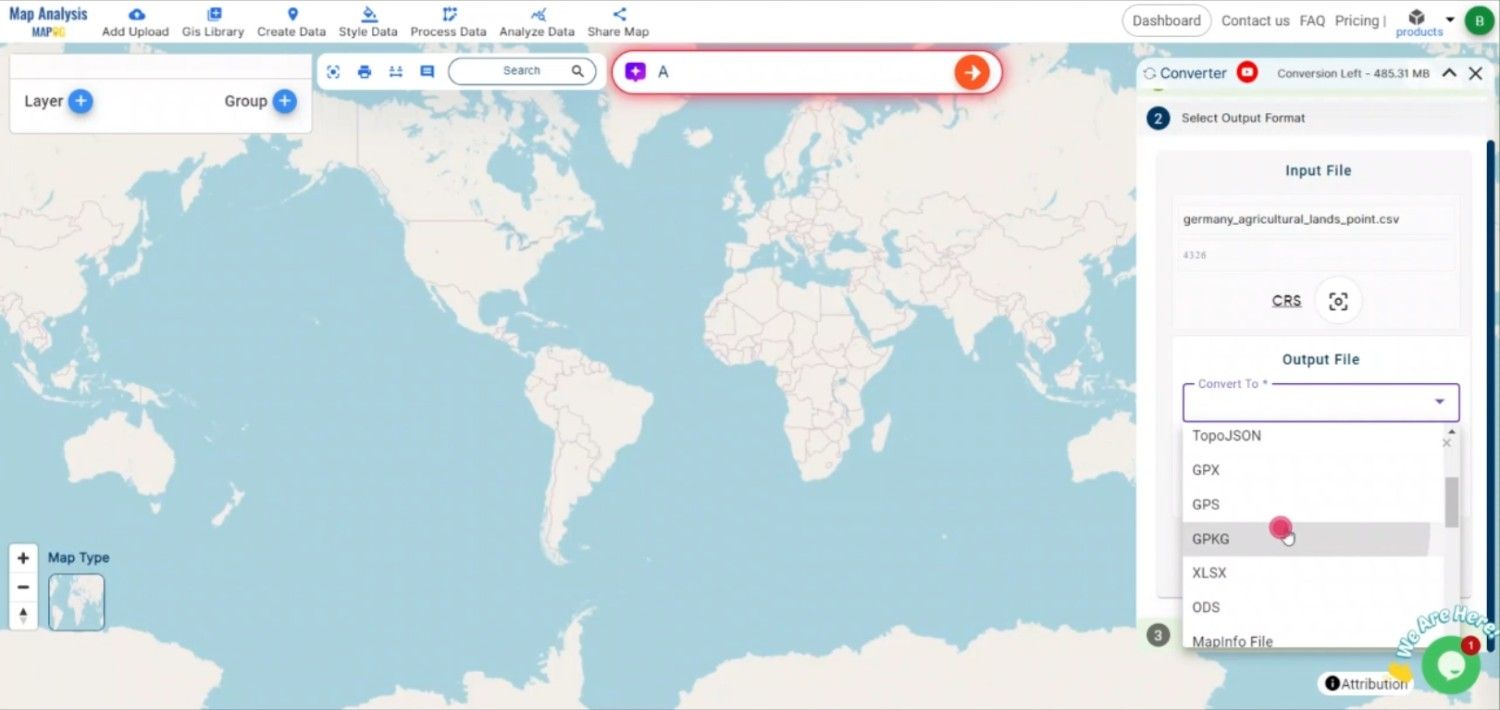
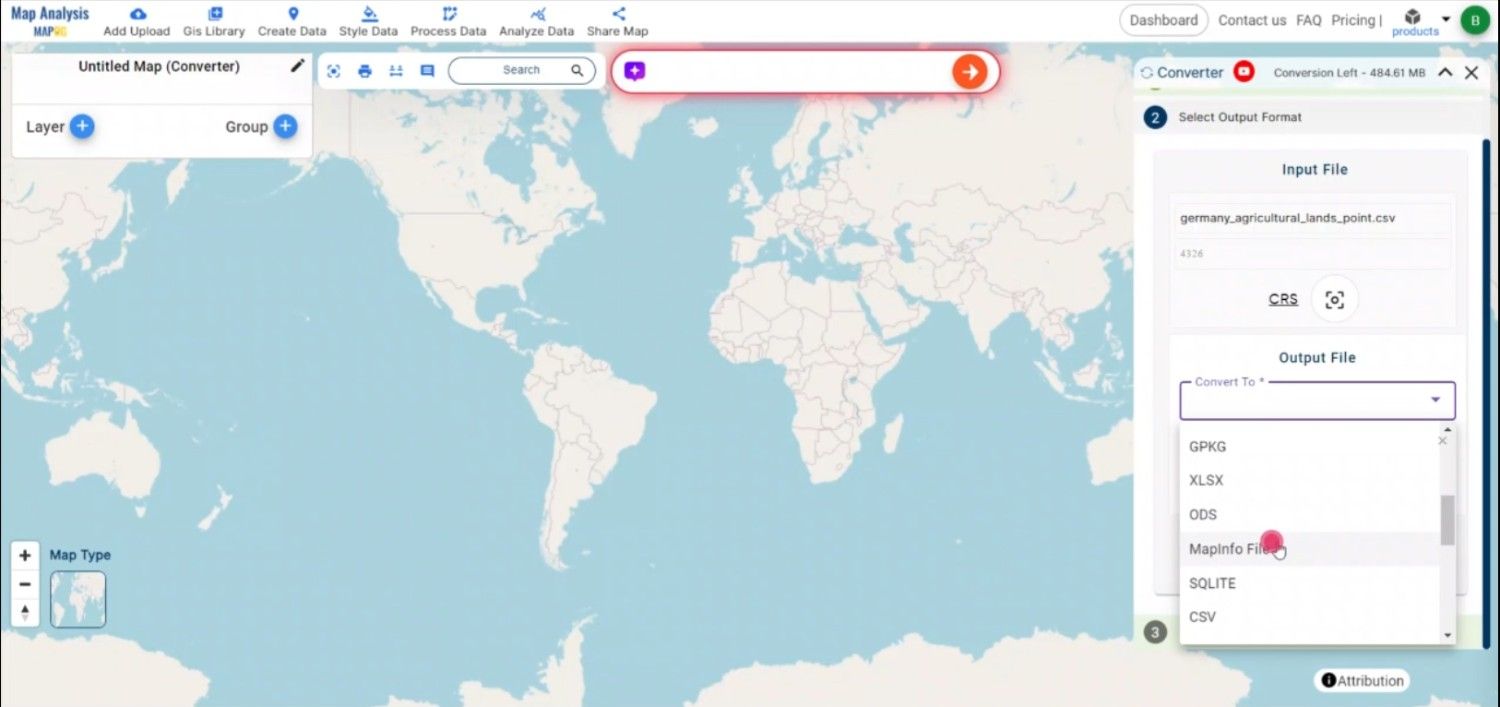
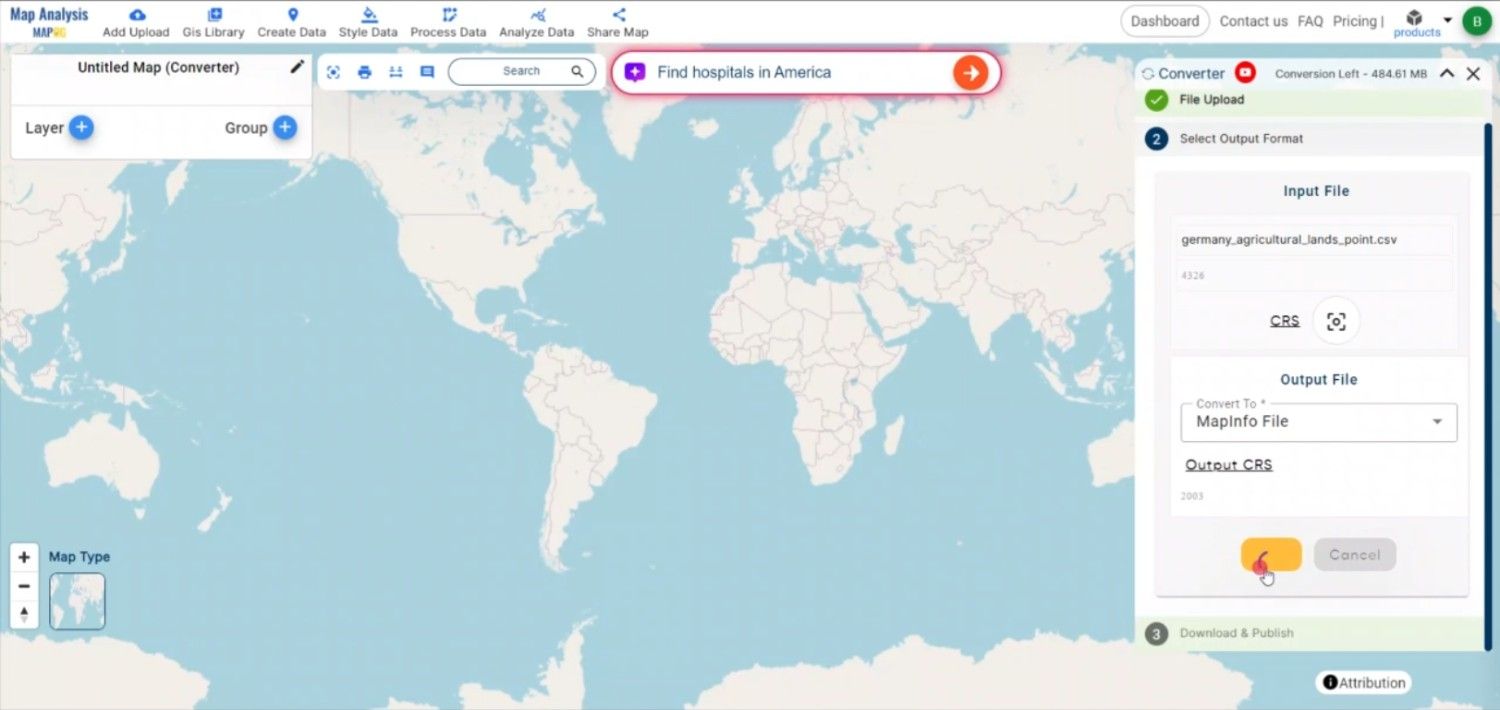
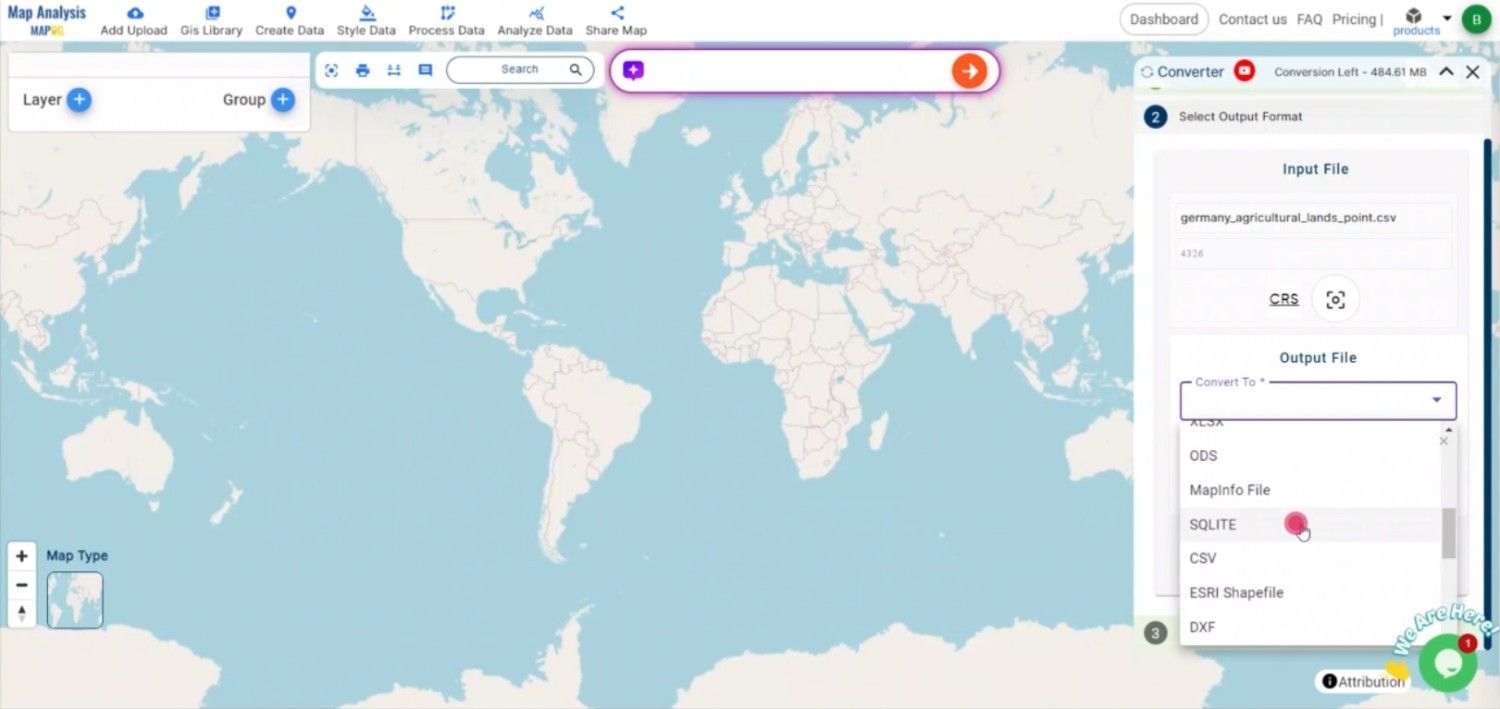
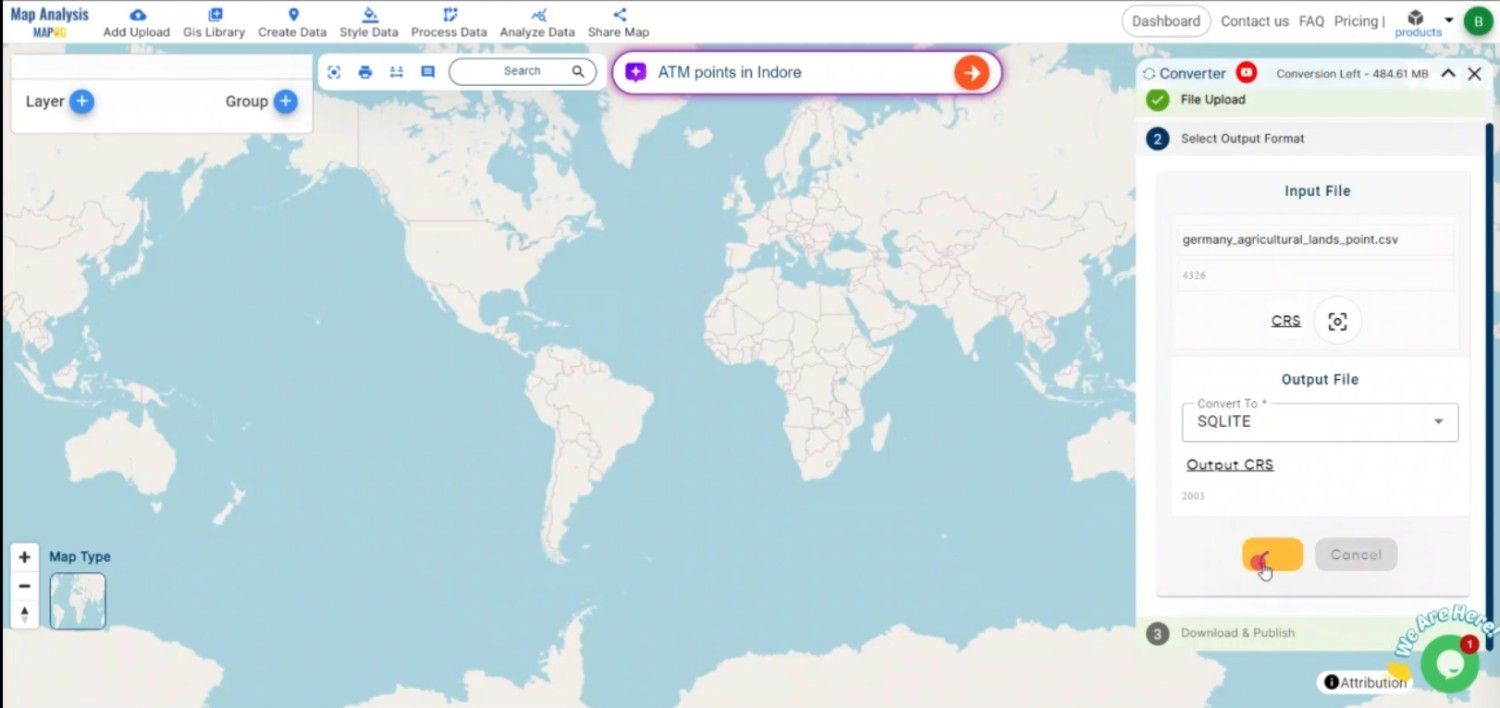
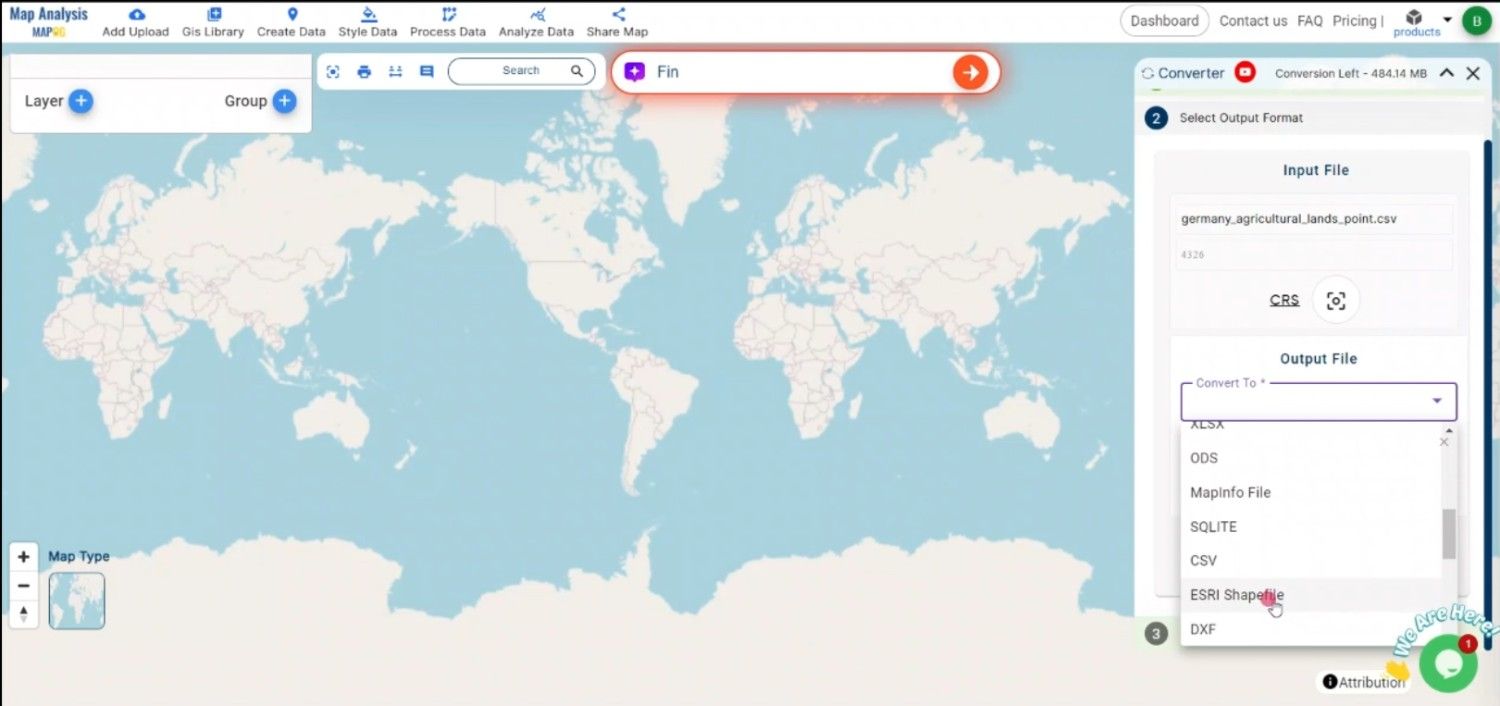
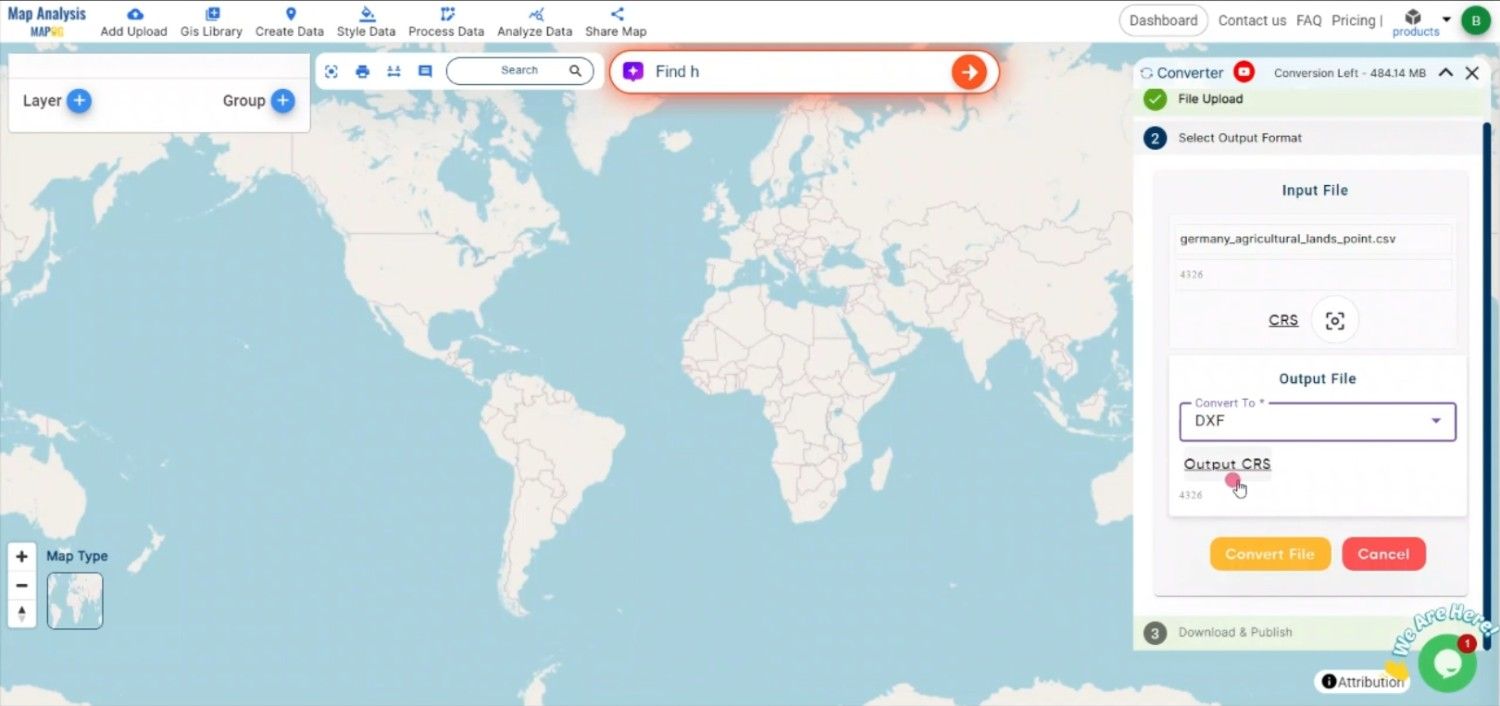
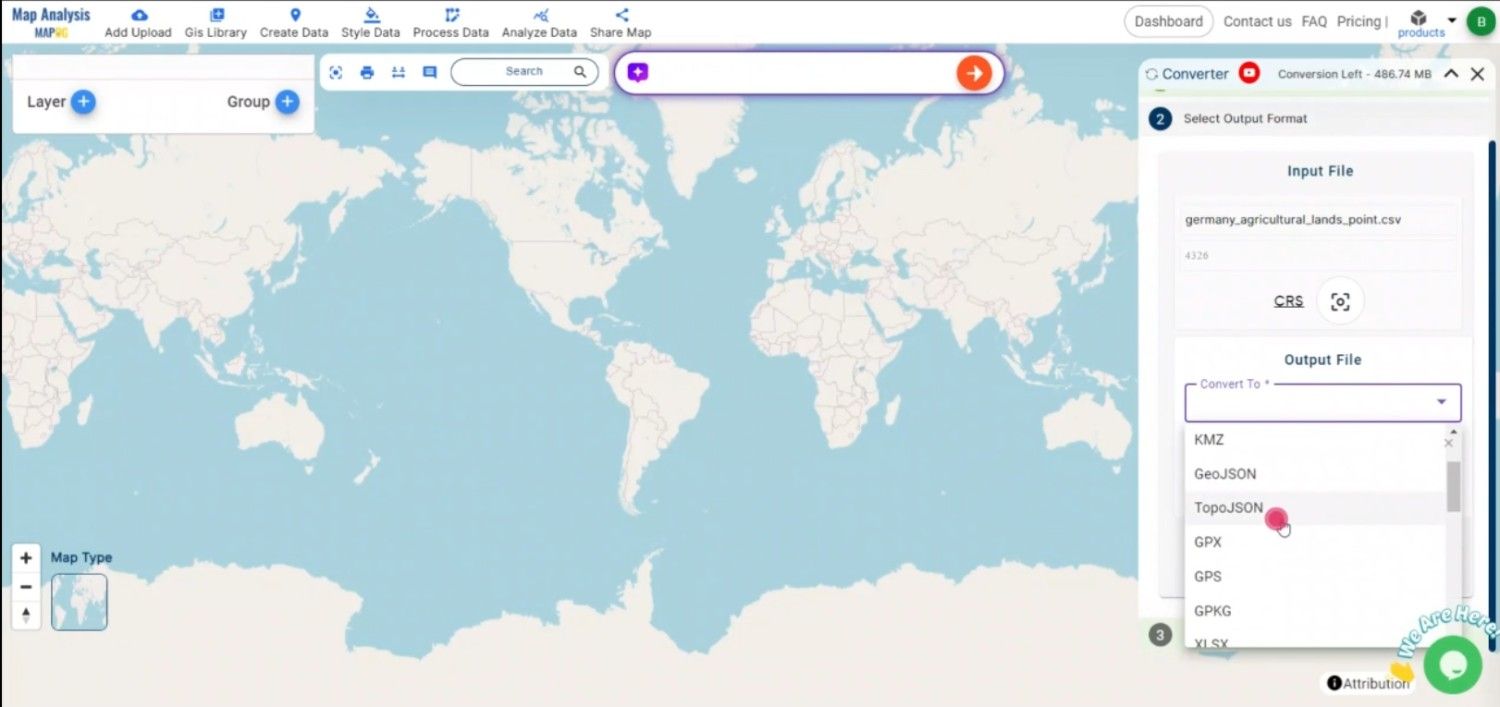
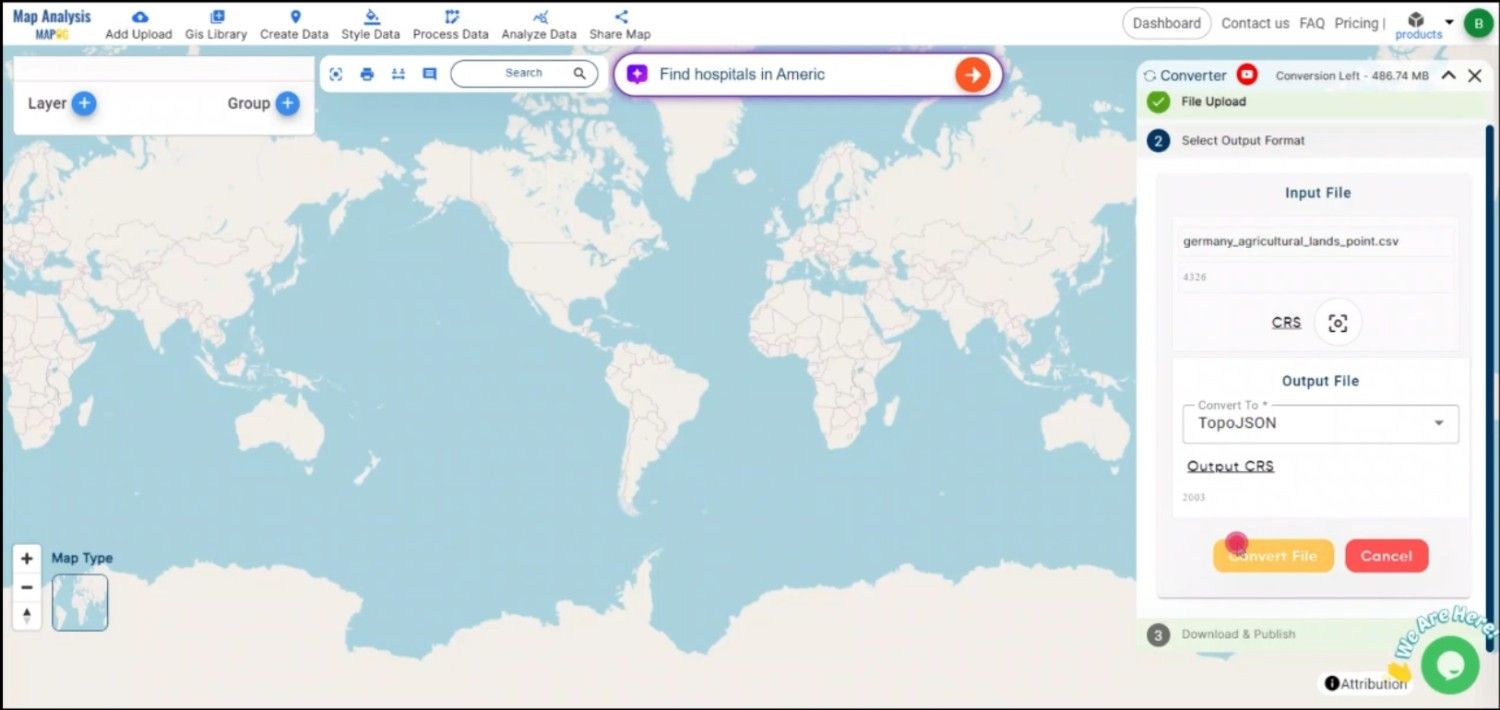
Step 2: Select TopoJSON as the Output Format
From the available list of formats, choose TopoJSON as the output. TopoJSON is particularly useful for web mapping due to its compact size and ability to encode topology, reducing redundancy in geometric data.
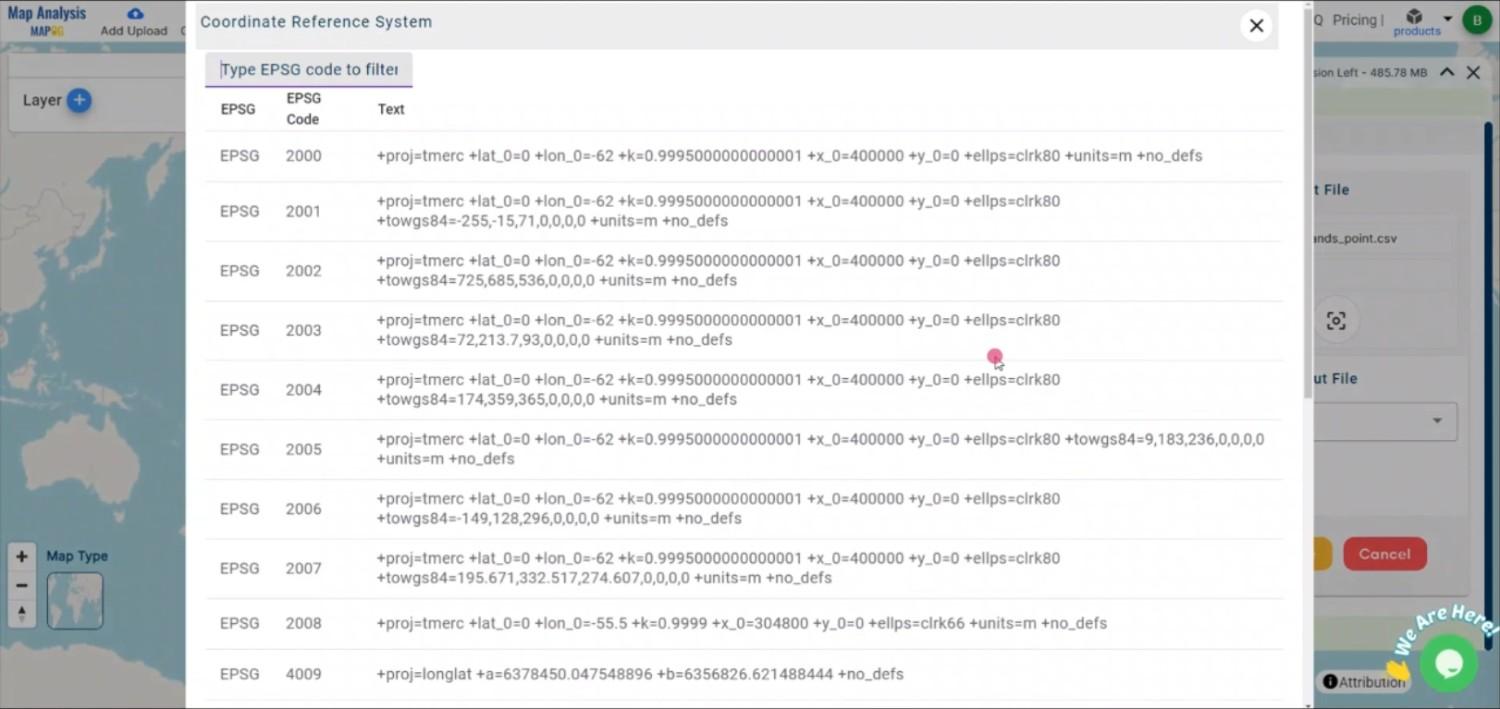
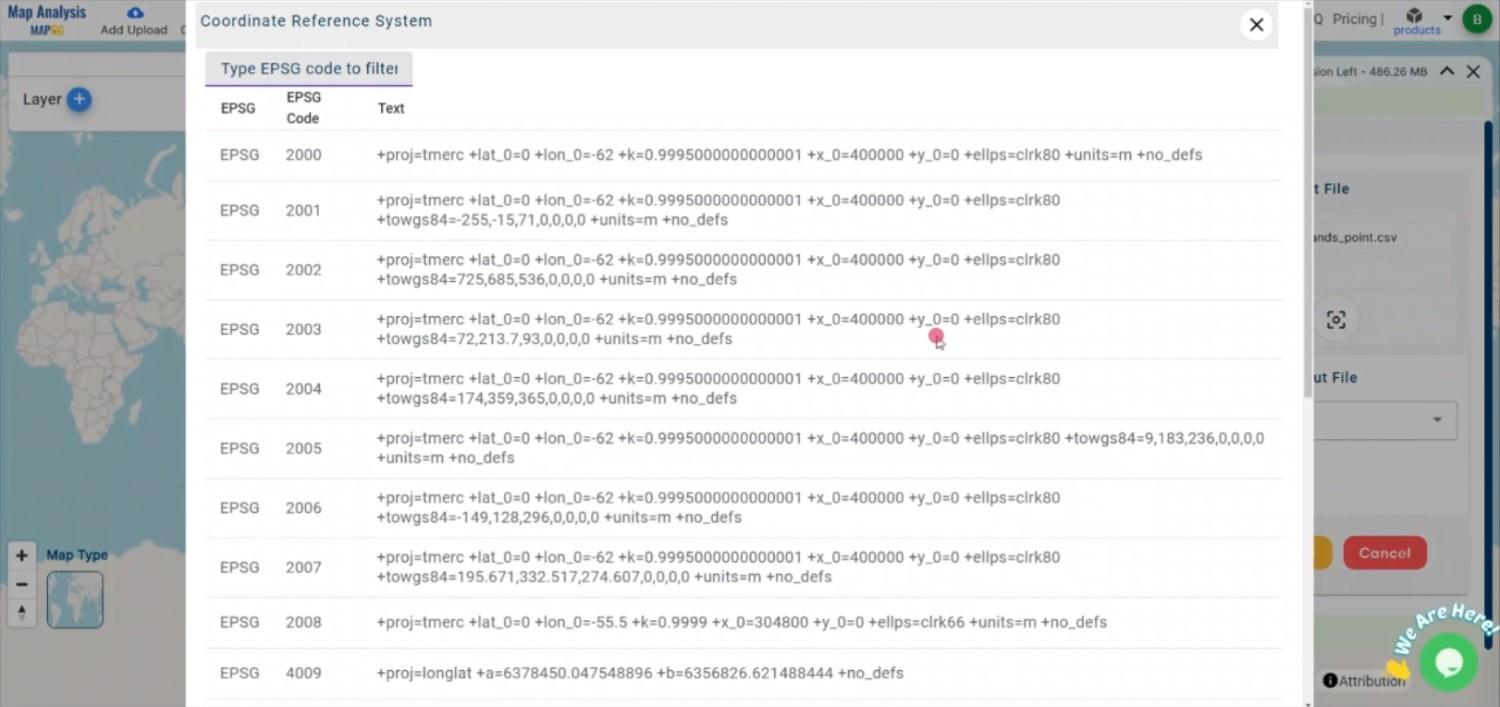
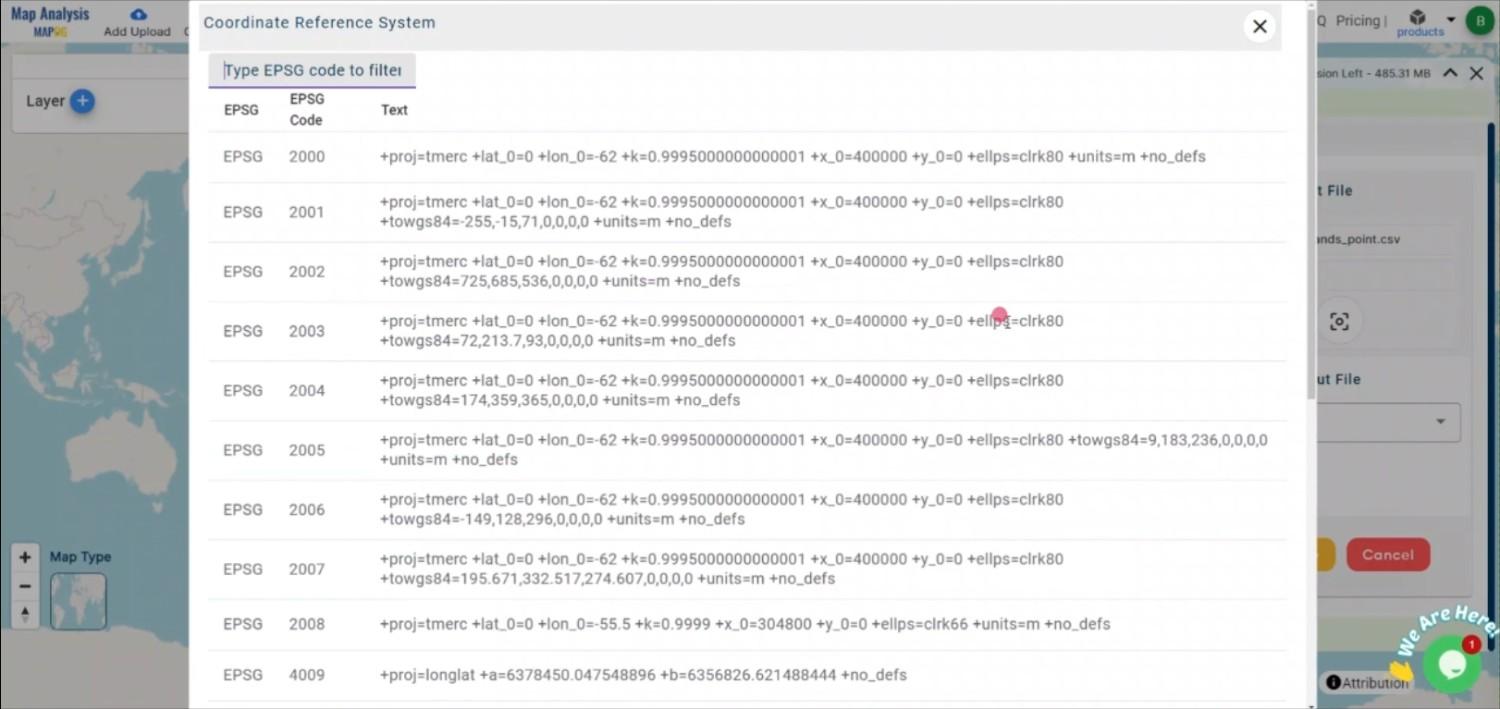
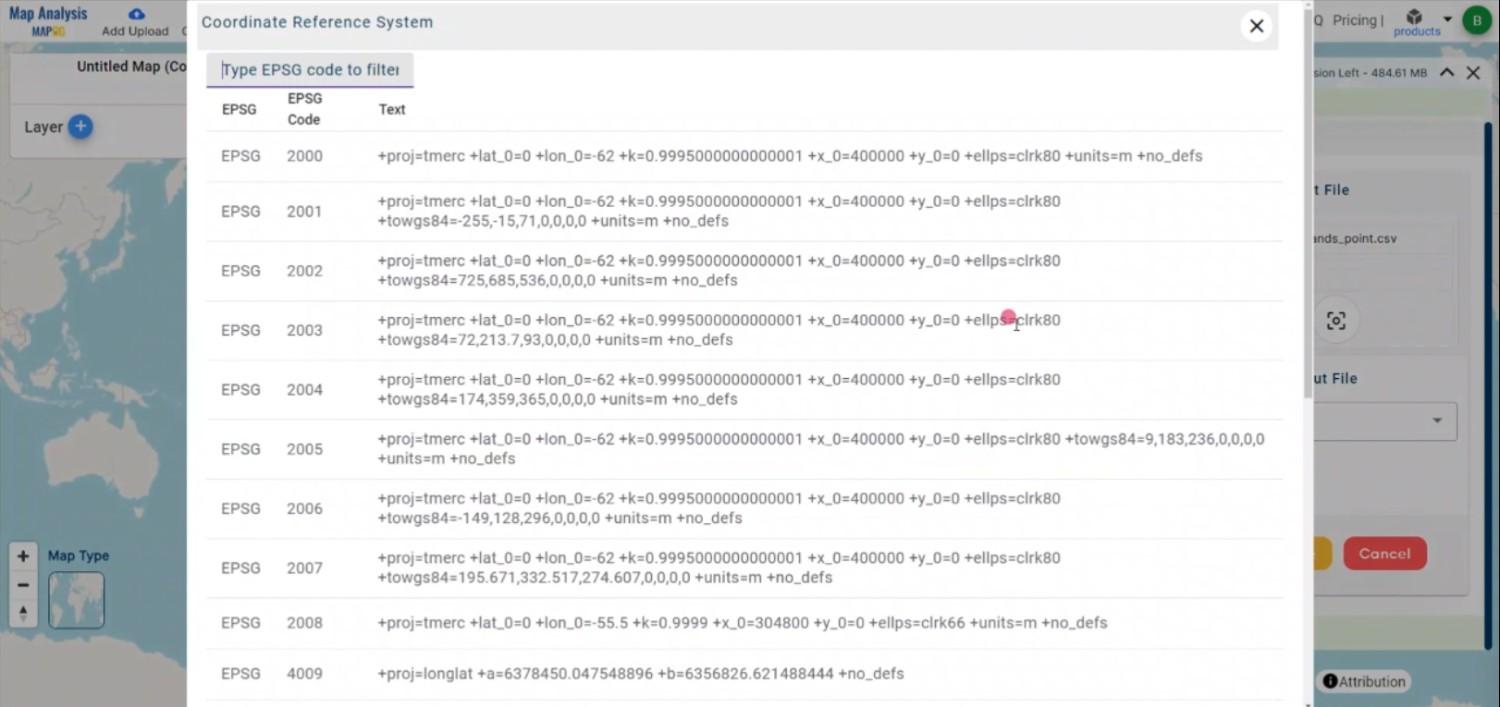
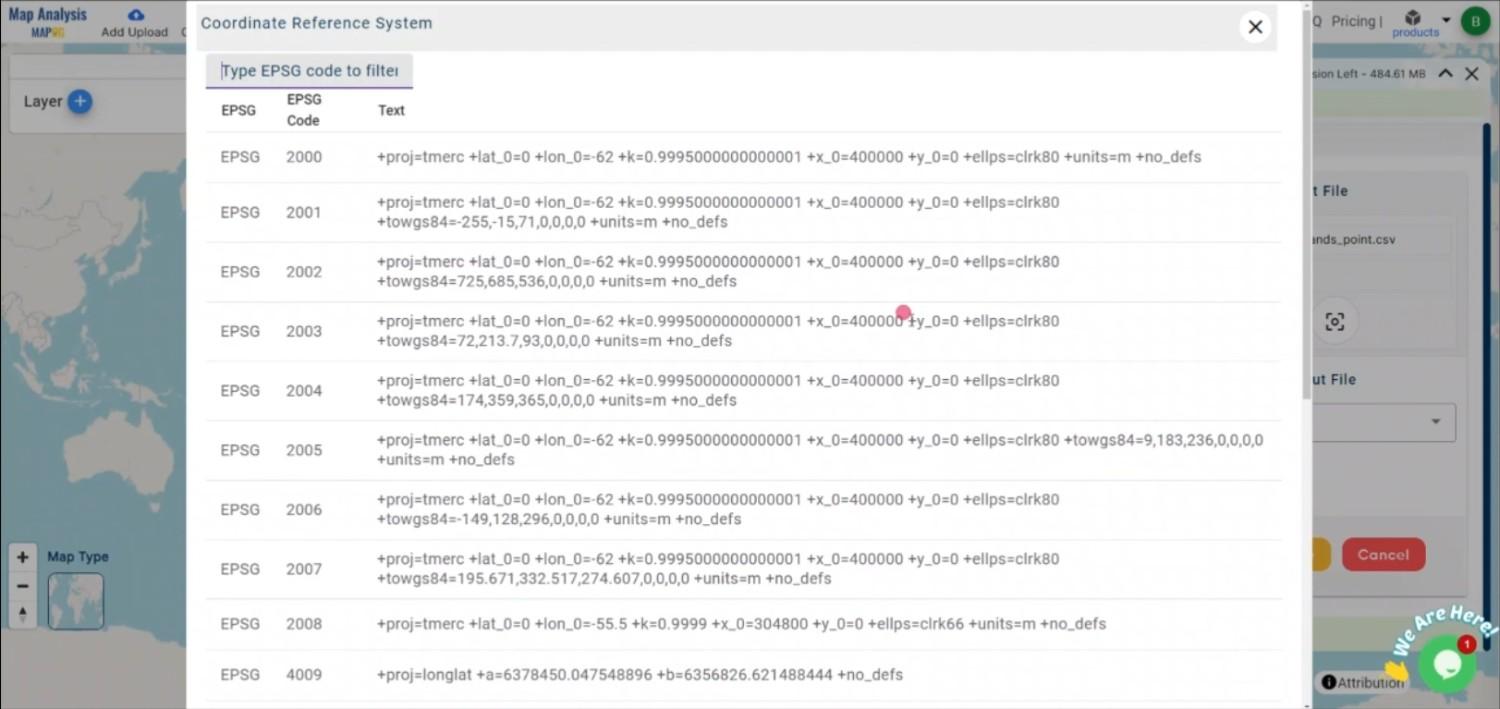
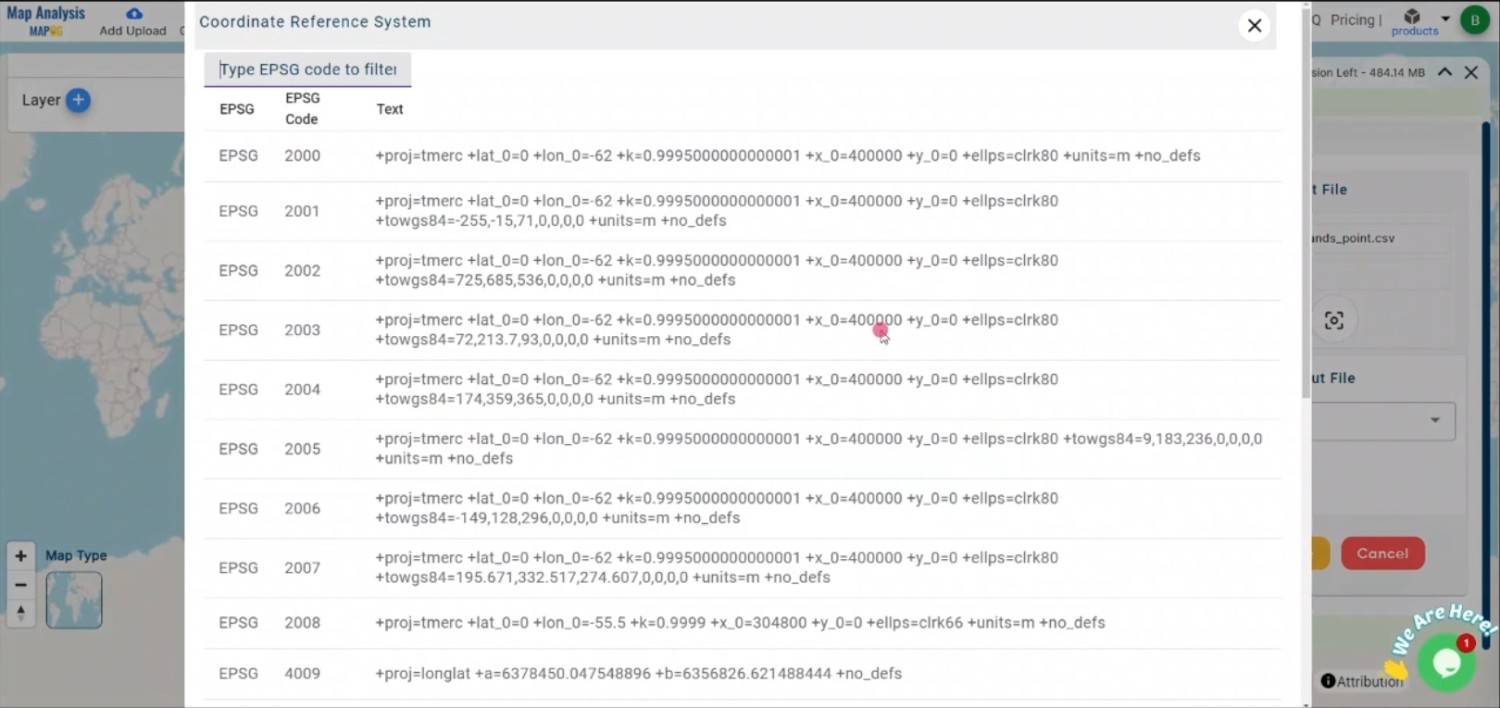
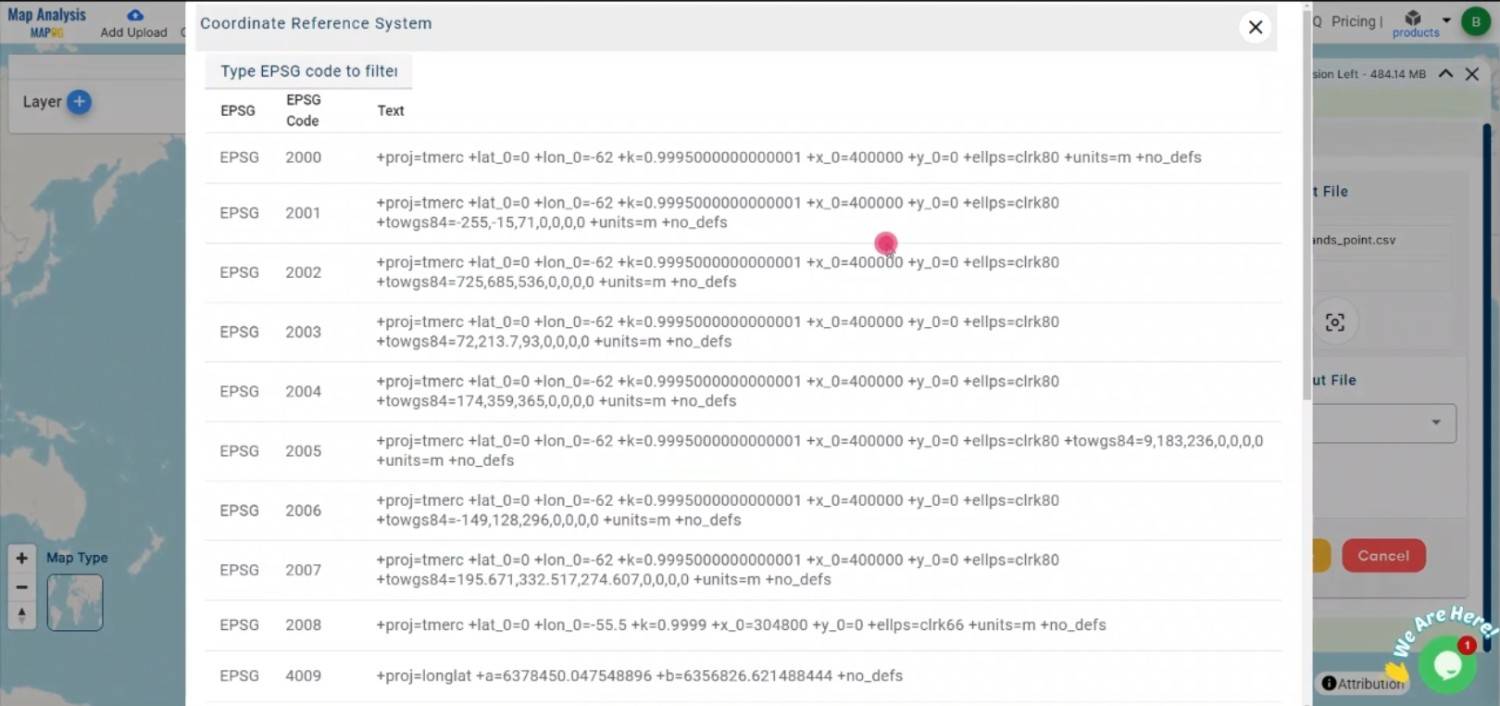
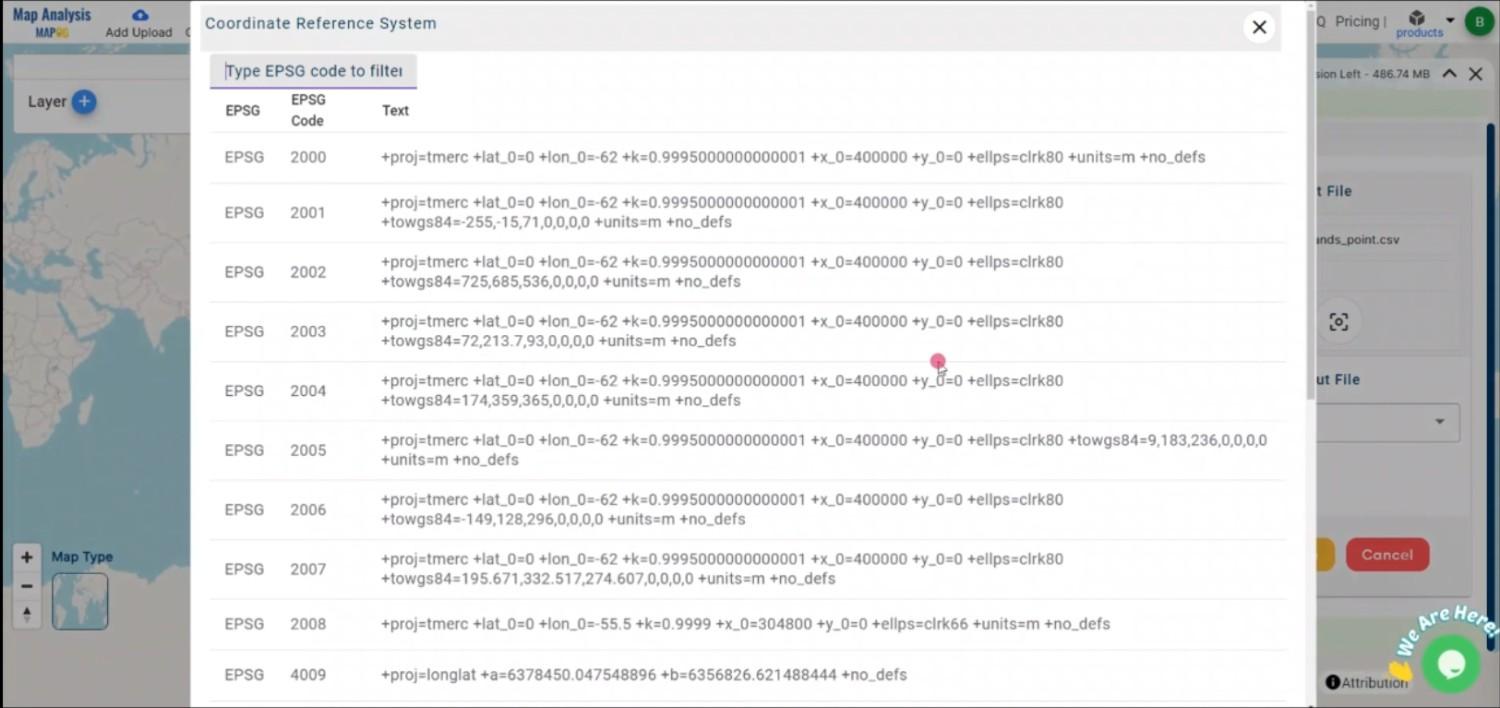
Step 3: Select the Output CRS
Choosing the appropriate CRS is crucial to ensure that your spatial data is accurately represented in the TOPOJSON file.
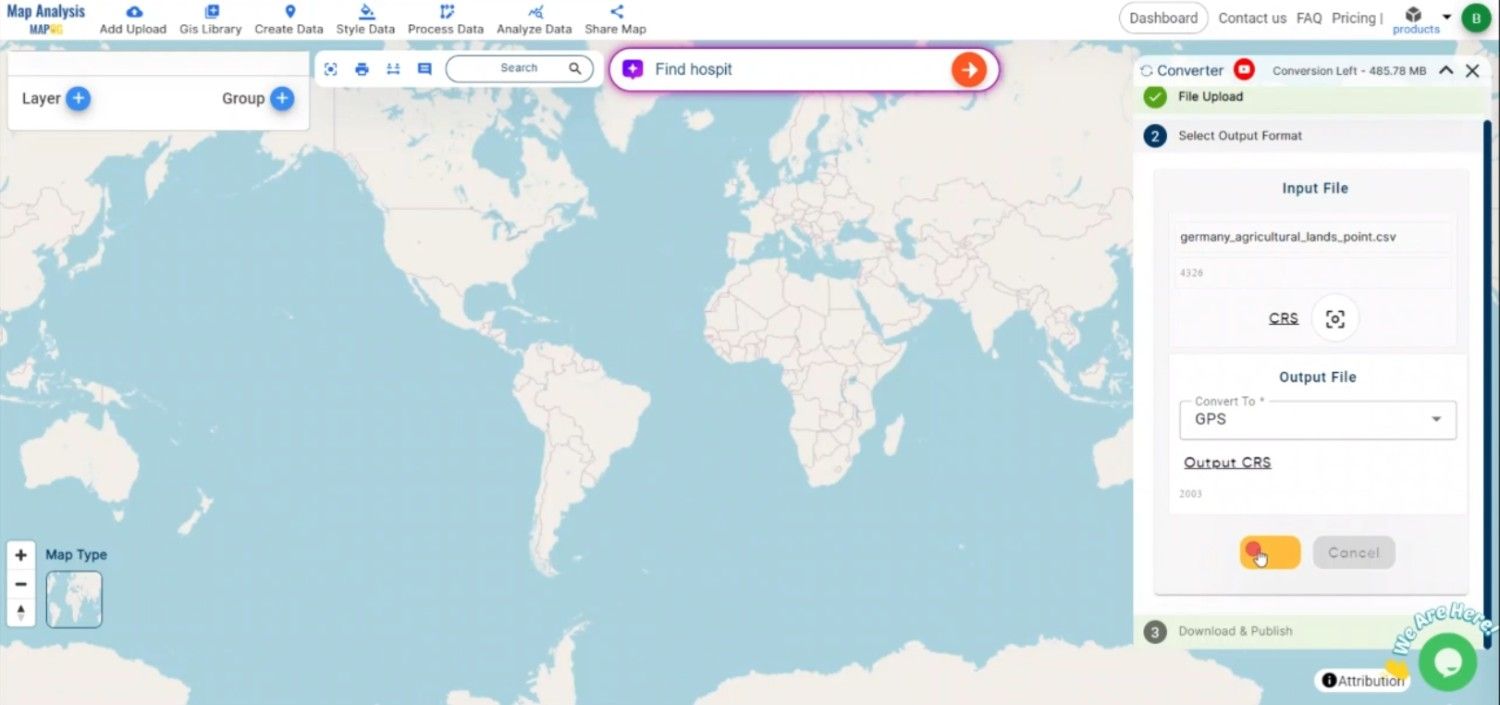
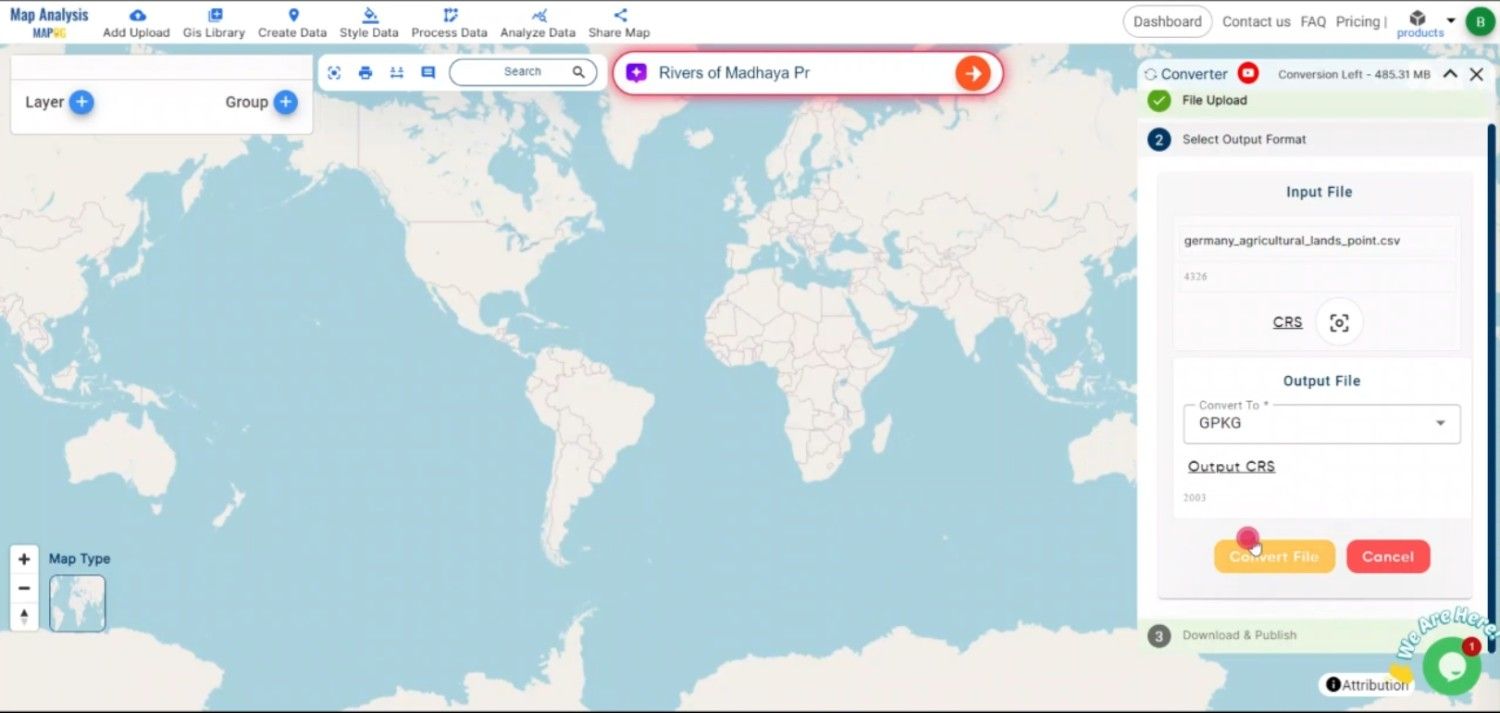
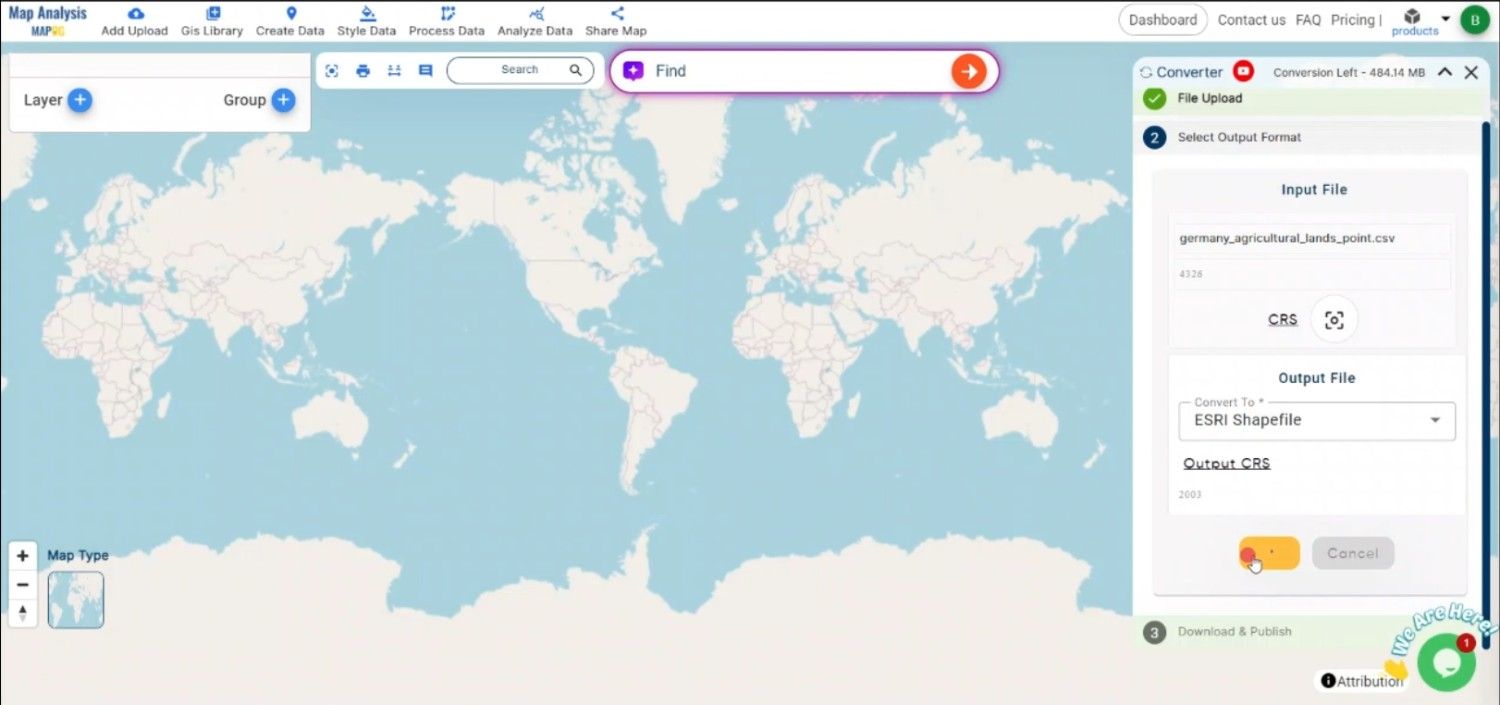
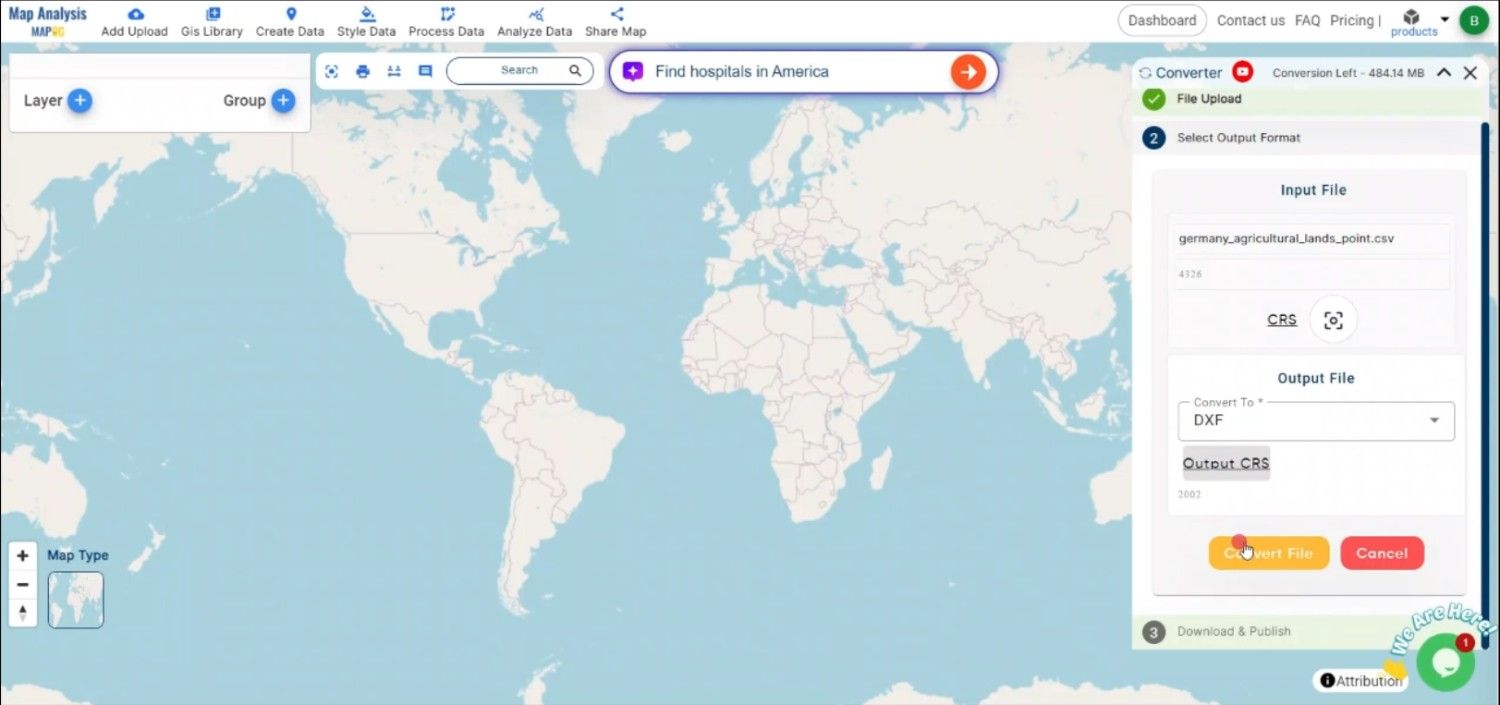
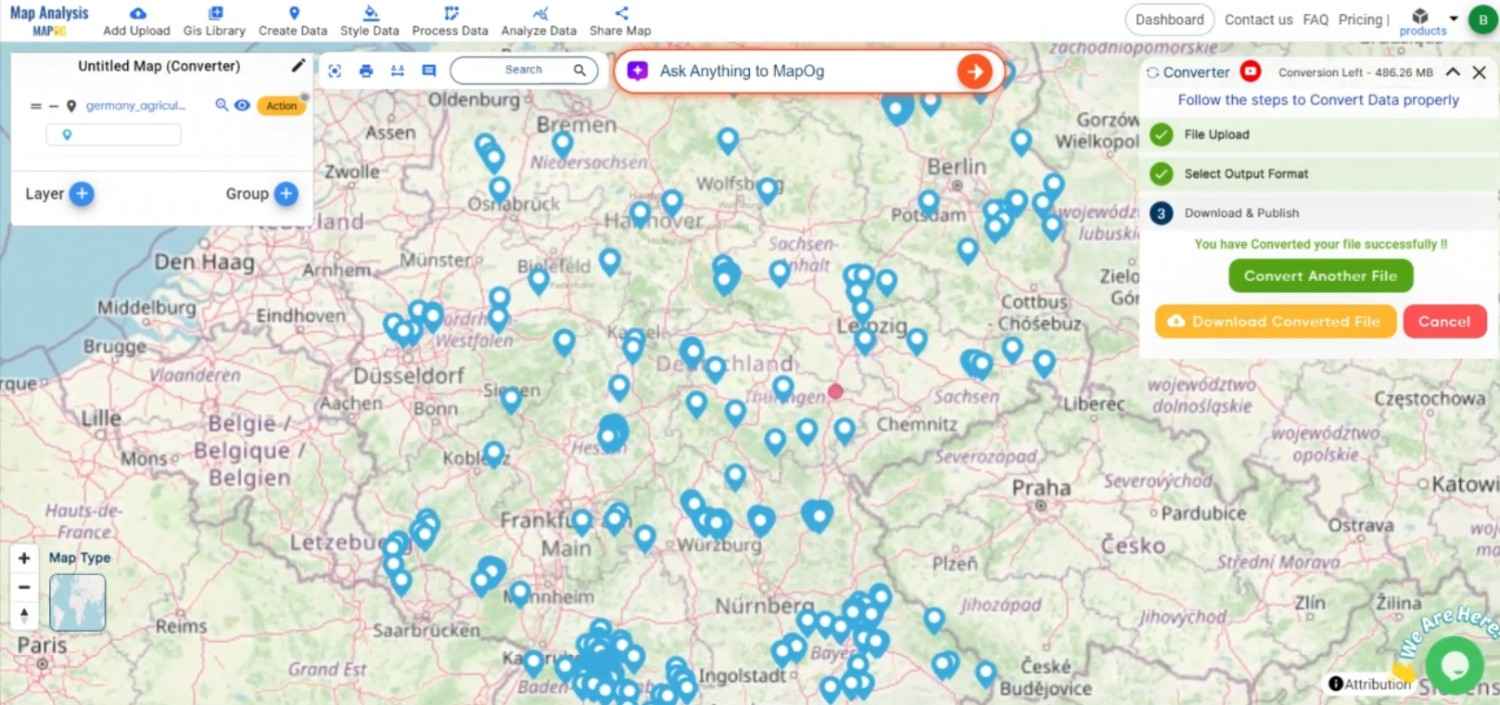
Step 4: Execute the Conversion
After configuring the necessary parameters, initiate the conversion by clicking the “Convert” button. The MAPOG tool will process the CSV file and generate a TopoJSON file that accurately reflects the geographic data.
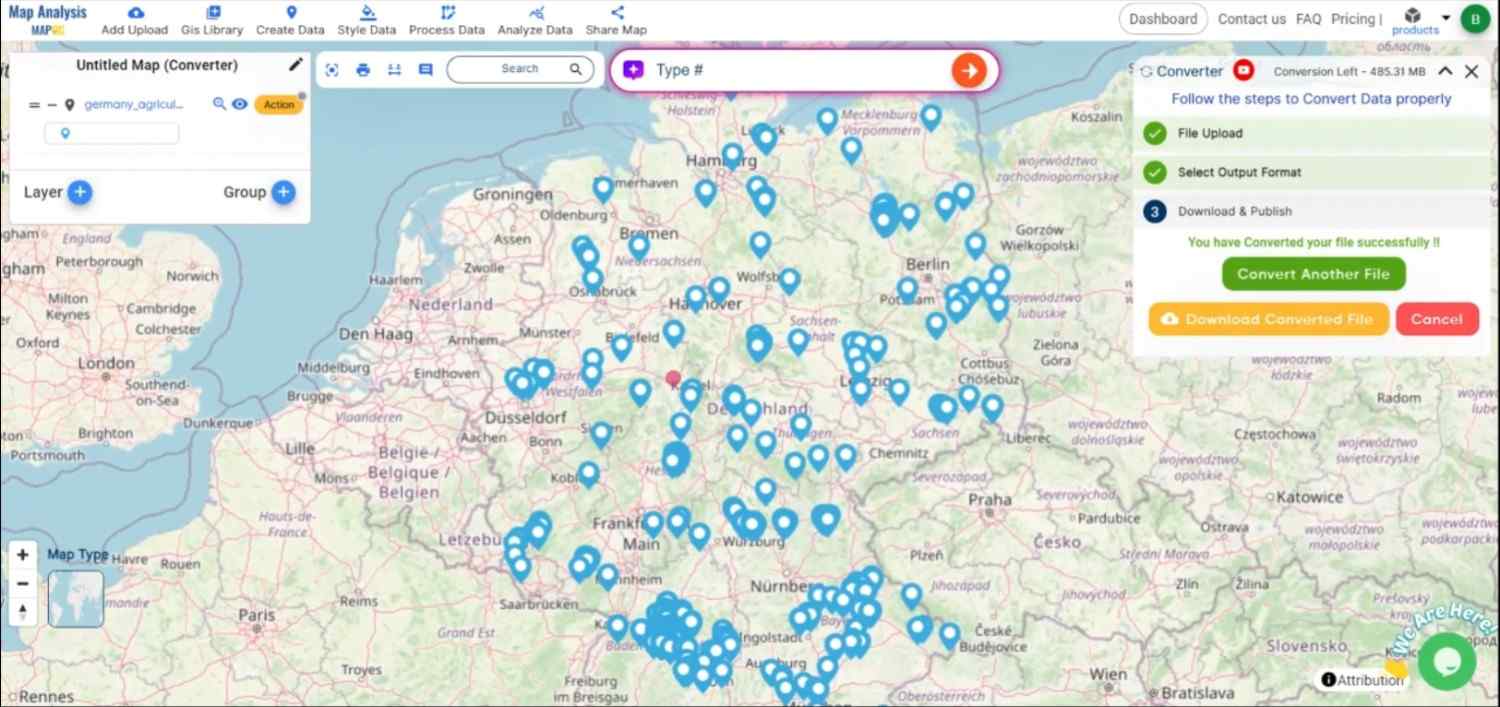
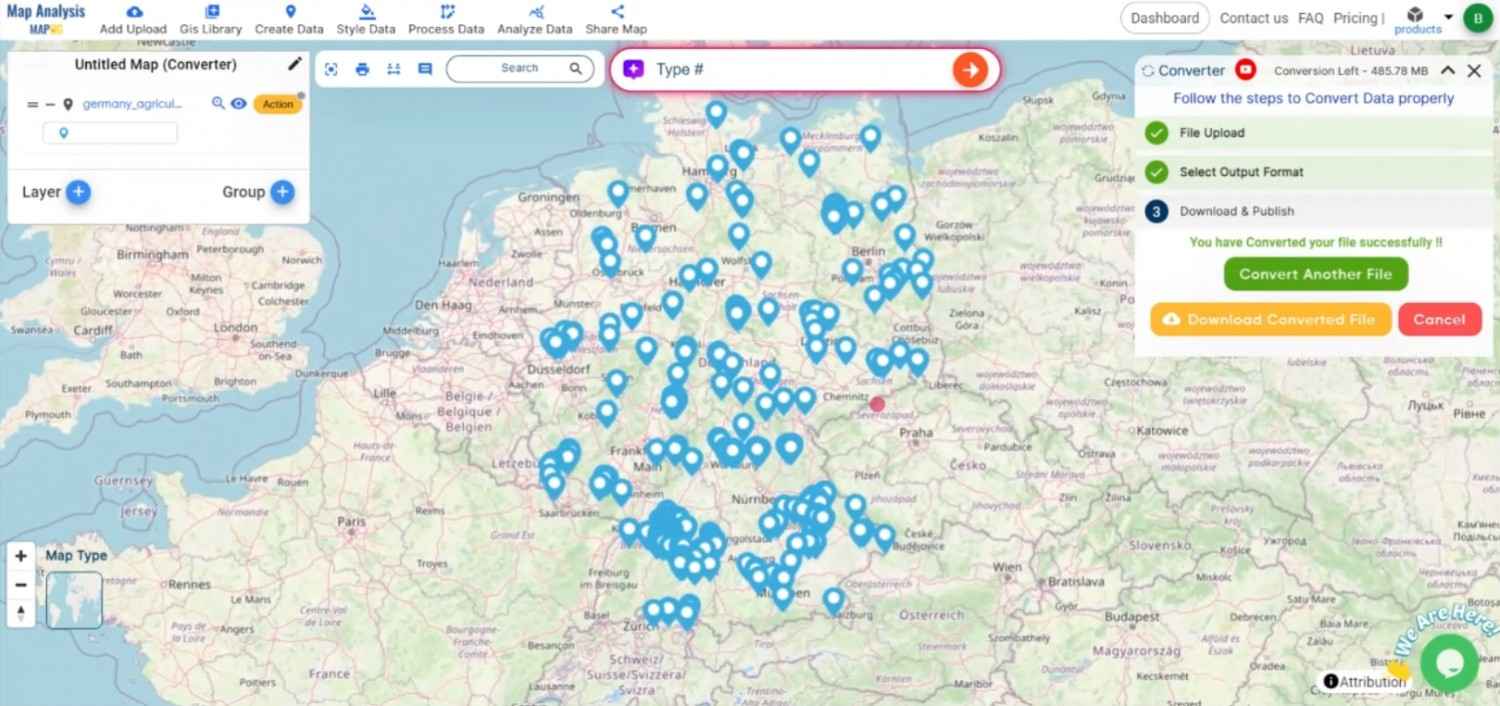
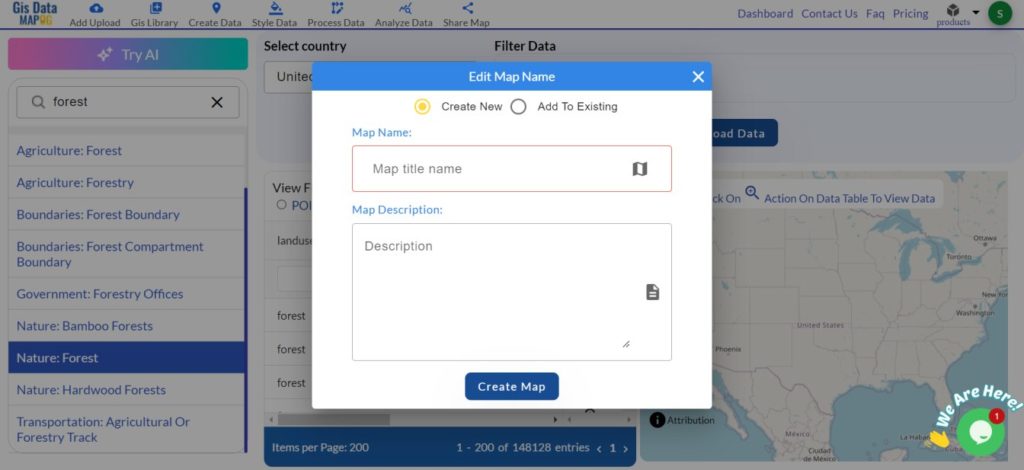
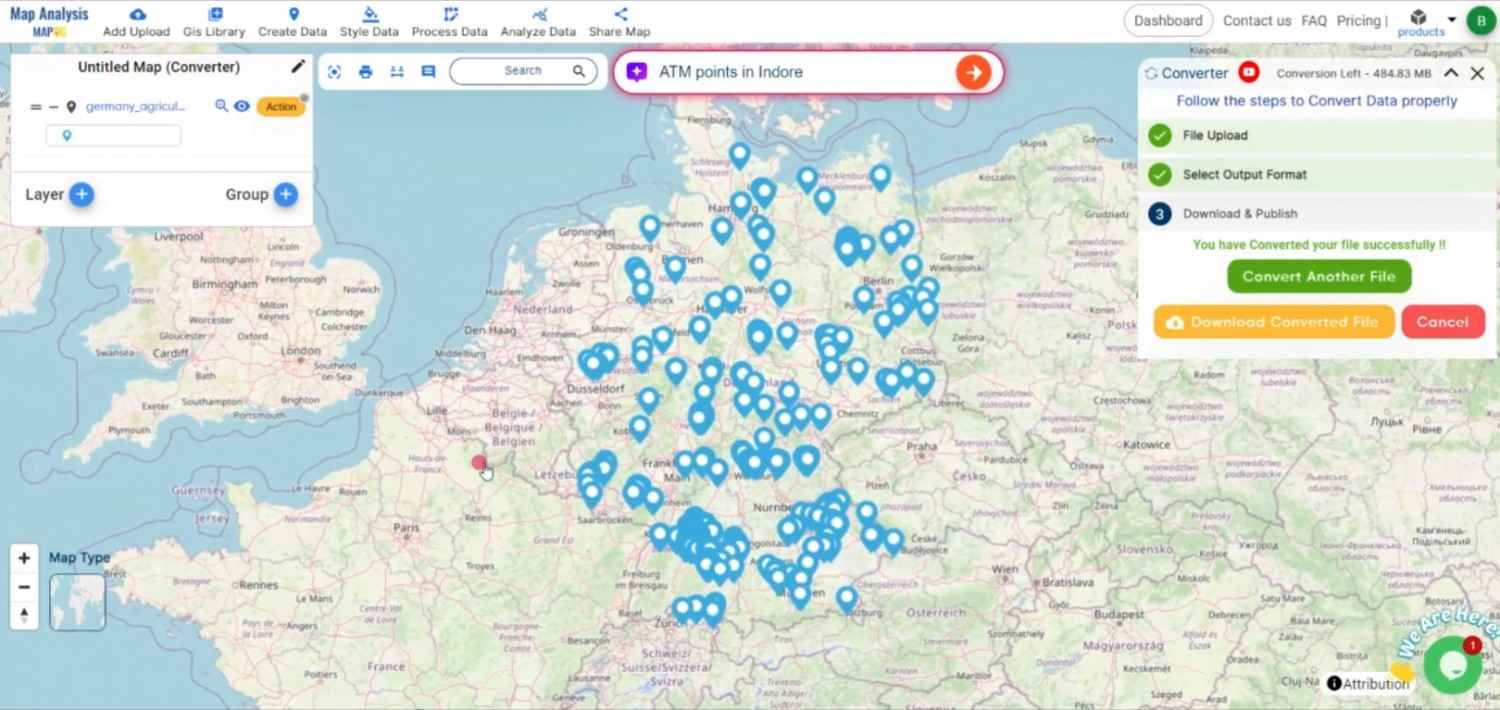
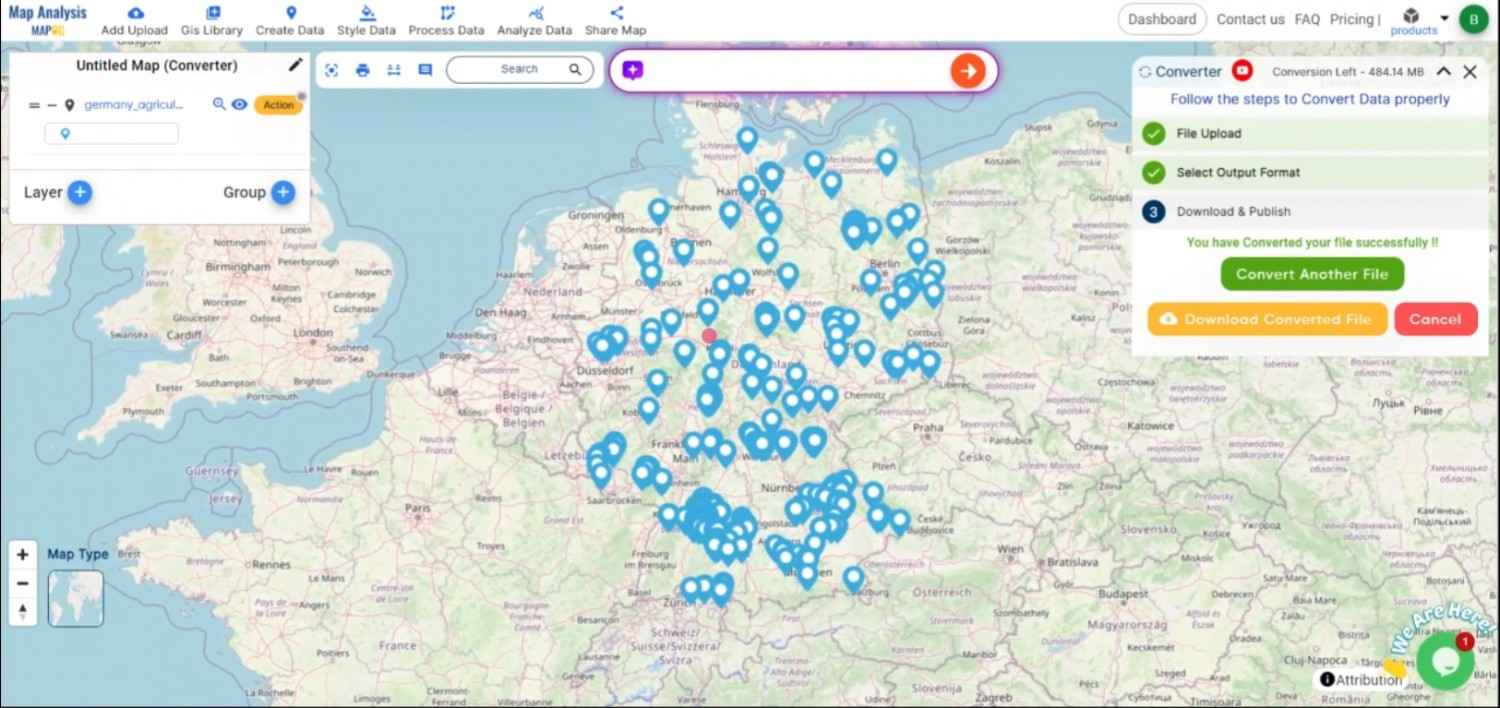
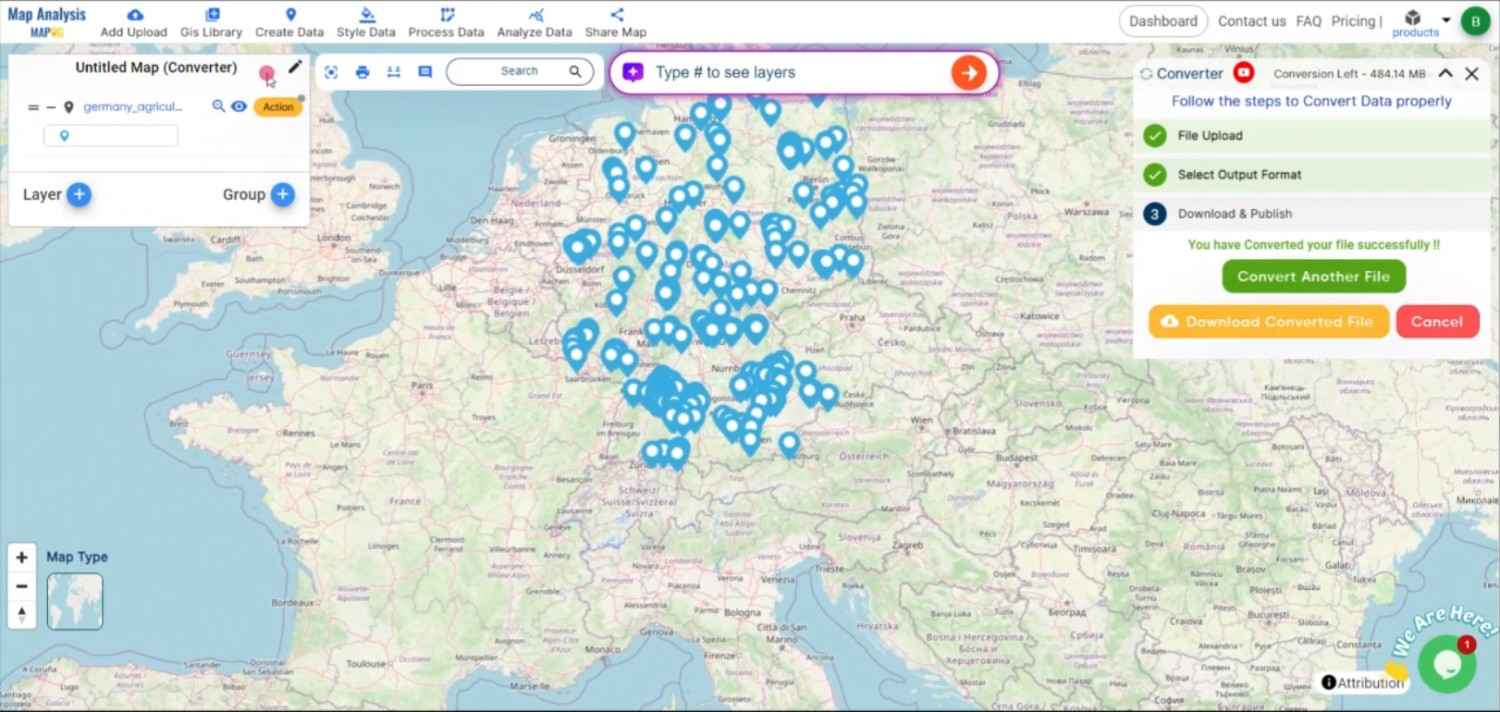
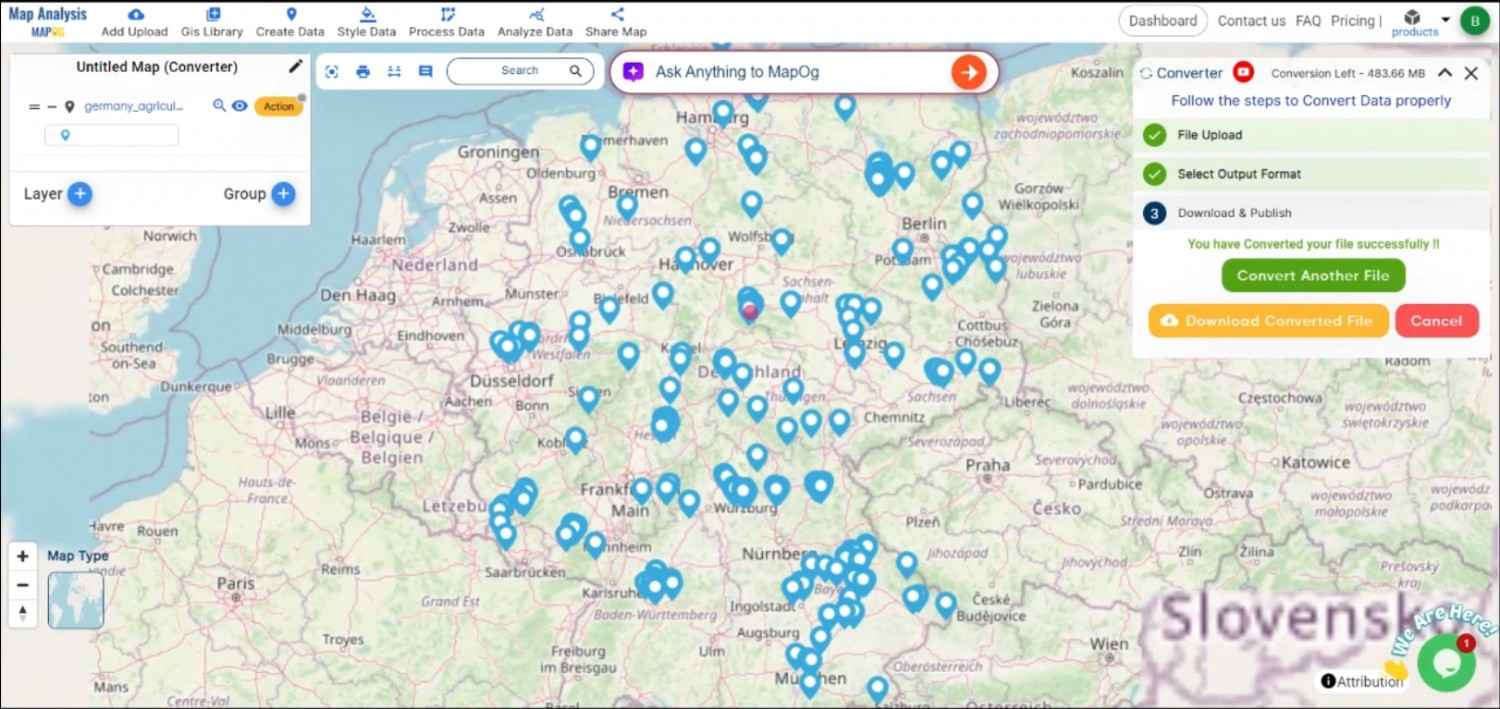
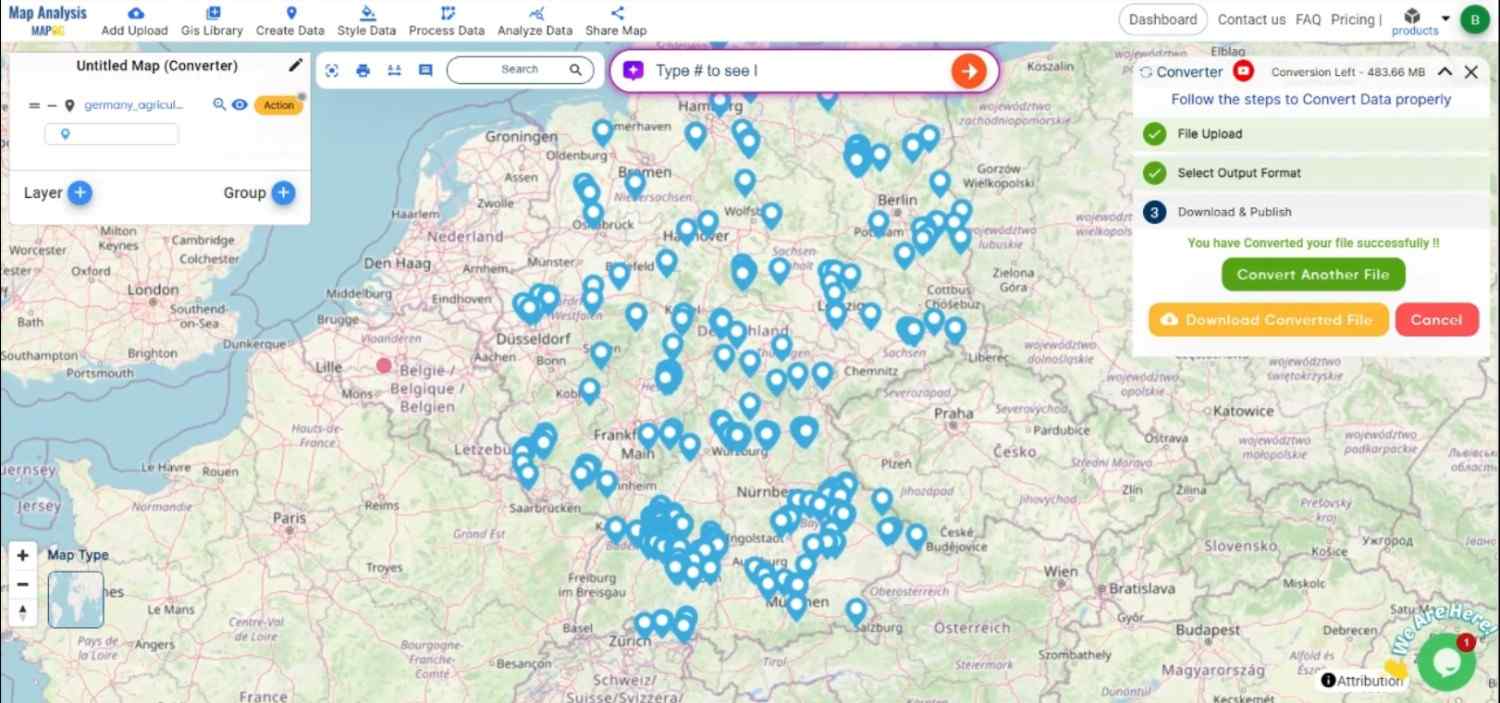
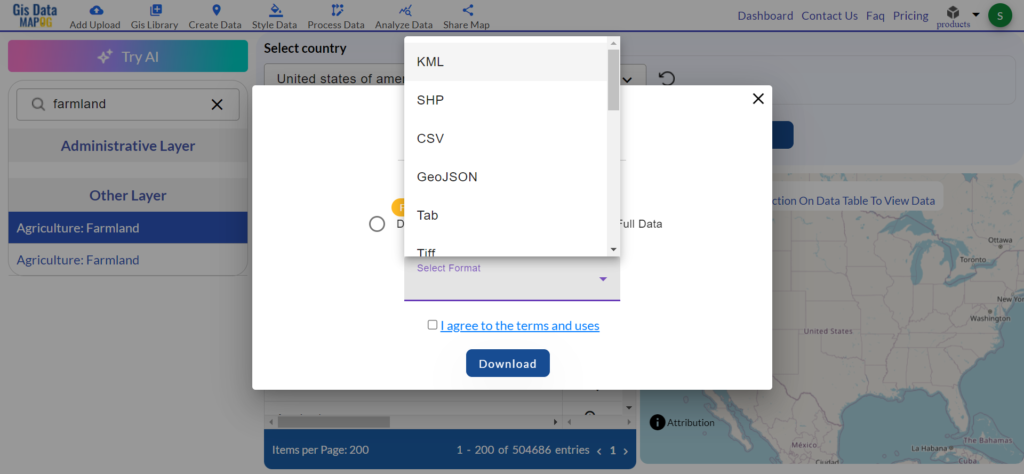
Step 5: Review and Download the TopoJSON File
Once the conversion is complete, review the TopoJSON file to ensure that all data has been accurately transformed. If satisfied with the result, download the TopoJSON file, which is now ready for use in web applications or any other platform that supports TopoJSON.
Conclusion:
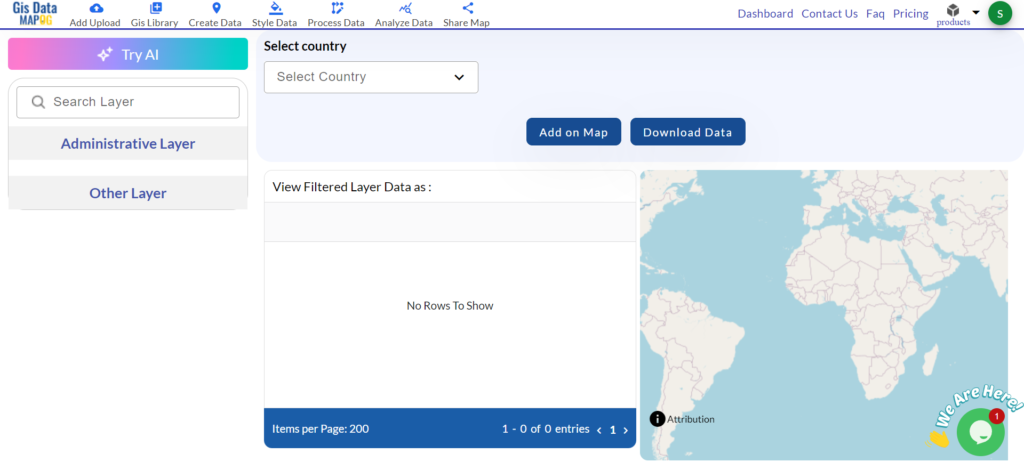
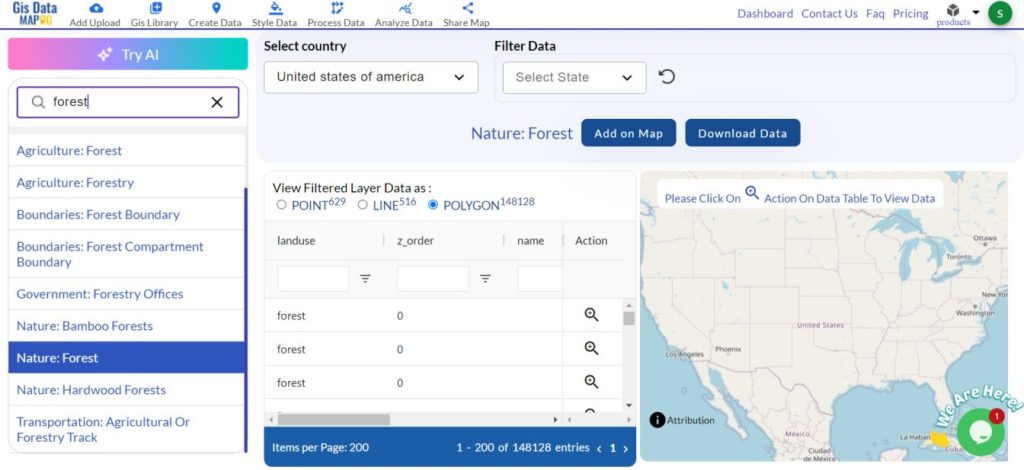
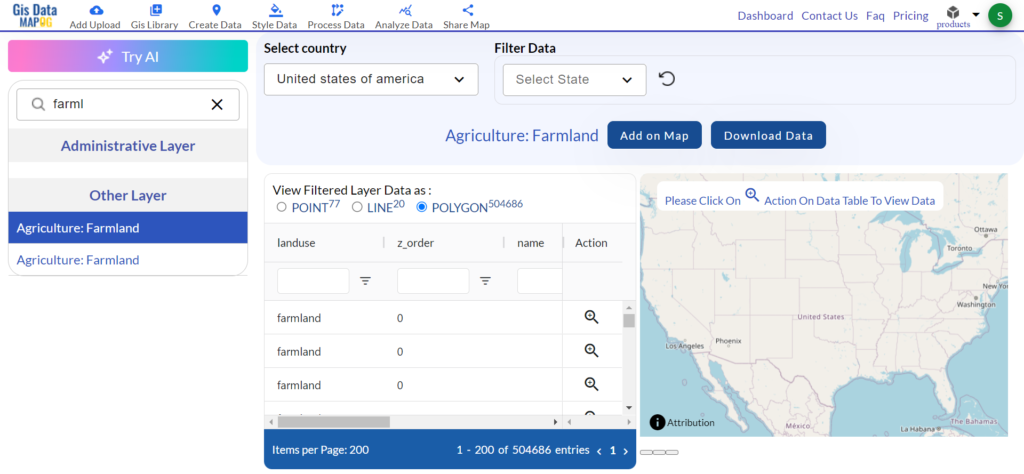
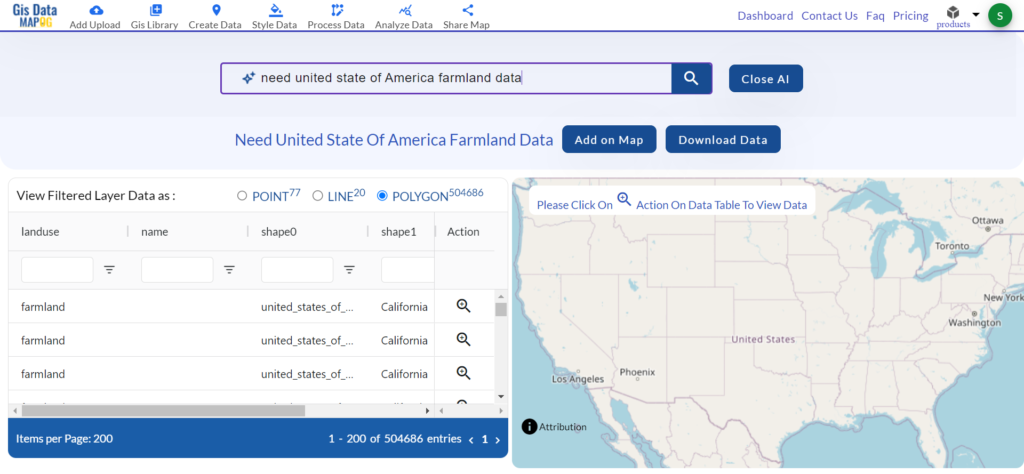
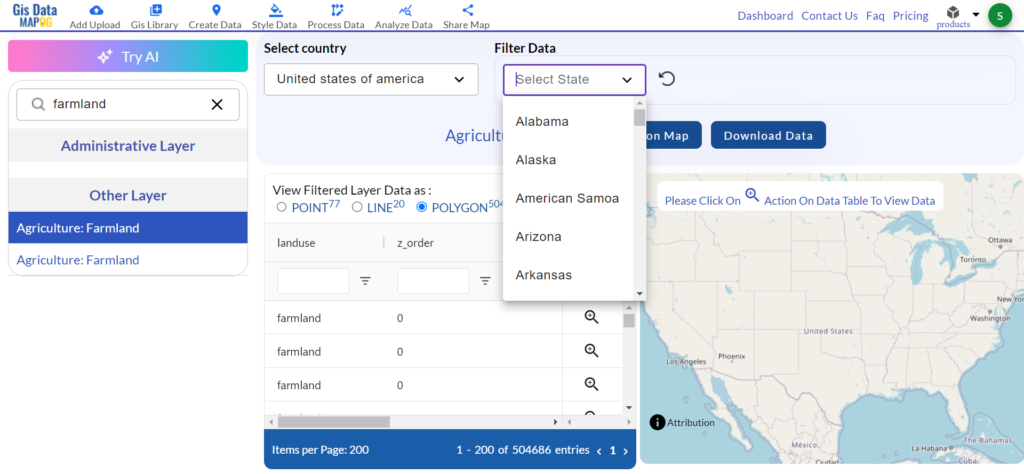
The MAPOG Converter Tool is an invaluable resource for GIS professionals and web developers, streamlining the process of converting data into efficient, web-optimized formats like TopoJSON. By following these steps, you can easily convert CSV files to TopoJSON, making your geospatial data ready for advanced web visualization and analysis. If you need to download any data file in CSV or in any other formats like KMZ, GML. visit GIS DATA. Here we have 900+ data layers for 200+ countries.
Feature Tool:
Story by MAPOG:
MAPOG is an interactive application that uses storytelling and interactive maps to bring geographical data to life. Imagine creating engrossing narratives about locations, occasions, or trends by fusing in-depth maps with images, text, and videos. With Story by MAPOG, it’s simple to take visitors on a visual journey, be it for tracking environmental changes, presenting stunning landscapes, or visiting cultural sites.
Here are some other blogs you might be interested in:
- Convert Online Gis data : KML to PDF file
- Converting KML to GeoTIFF , Online Gis Data Converter
- Converting KMZ to SHP : Online GIS Data Conversion
- Converting TopoJSON to SHP Online : GIS Data Converter
- Converting GeoJSON to TopoJSON with MAPOG
- Converting GeoJSON to CSV with MAPOG
- Converting KMZ to GeoJSON Online
- Convert KML to MID Online
- Online Conversion KML to MIF
- Convert KML to GML Online
- Convert KML to GPKG Online
- Convert GML to SHP Online
- Convert KML to GML Online
- Convert KML to GeoJSON file online
- Convert KML to TopoJSON Online
- GeoJSON to GeoTIFF – Vector to Raster Conversion
- Convert GeoJSON to KML
- Convert Geojson to MIF MapInfo file
- GeoJSON to Shapefile
- Convert GML to CSV
- Convert KMZ to GPX