Owner and Director of a Private Limited company which serves individual to large scale industries in the field of Maps and GIS. He is a Gold Medalist in M.Tech(Spatial Information Technology) and owns some famous Technology blogs and website... Know more
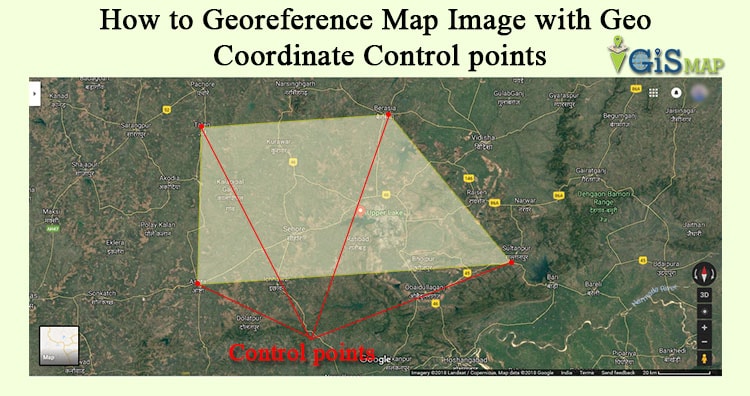
How to Geo-reference Map Image with Geo Coordinate points in QGIS (Quantum GIS). Georeference is a process to associate geographic location coordinates to any kind of physical object which is physically present over a Raster image map or to a physical map, with help of other georeferenced data or with know location coordinates of some points of image which is effectively called as control points. Georeference is one of the important concept of GIS (Geographic Information System). Here we will see how to Georeference map manually in QGIS. You can also see how to georeference from one map to another and other QGIS tutorial.
Here is the steps to georeference raster image map in QGIS:
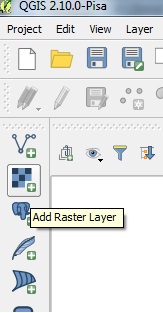
1.) Open QGIS and Import your image map using ADD RASTER LAYER in QGIS.
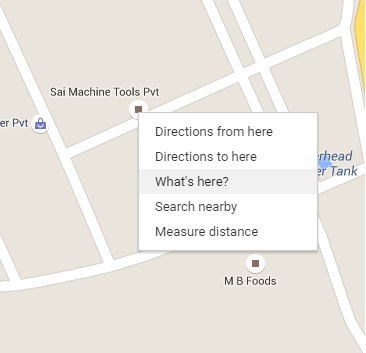
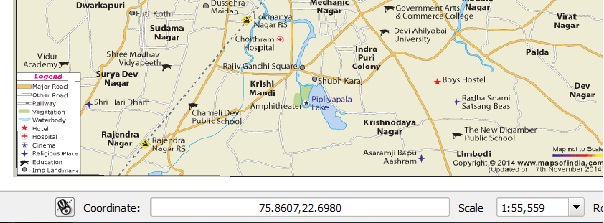
2.) We need to find the control point and known geolocation coordinates. I prefer Google Maps to get the Latitude and Longitude values.
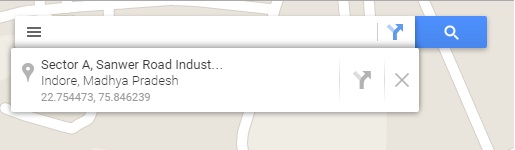
Go to google map and search the location which matches your image map location on it. Select a point in google map which matches in your map. You can also switch to satellite view. Select a point such as any land mark place as per your convenience. Right click on that point in Google Map and click what’s here you will see it will display latitude and longitude of the point.
Georeference Map Image with Geo Coordinate Control points in QGIS 1
3.) Latitude is written first and the second one is longitude. Also notice (-) sign (if present). Note down the points. Likewise select at least 4 points in different directions and note down the latitude and longitude of them.
4.) Moving to QGIS tool, Right click on the Raster layer and click remove.
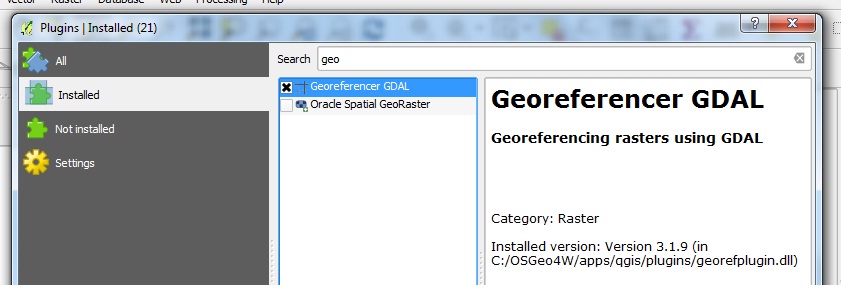
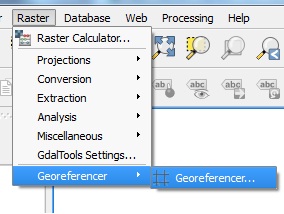
5.) Now go to Georeferencer, you will find it in Raster tab, if you already have installed georeferencer plugin. If you don’t see the option, click Plugins and then select manage and install plugins. Search for georeferencer and install the same as shown below.
Georeference Map Image with Geo Coordinate Control points in QGIS
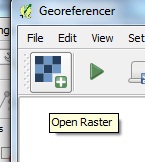
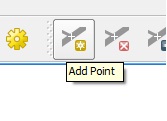
6.) Import your map here and click add points. You can pan and zoom here.
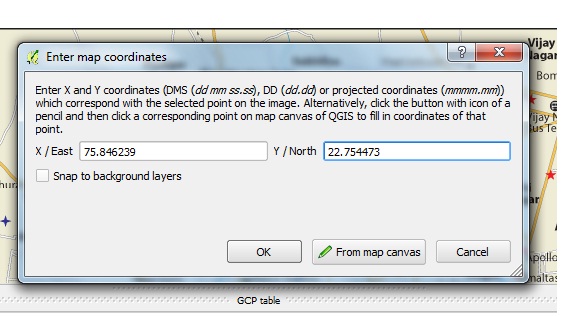
7.) Click on the location on your map which you selected on google map as control points. You will see a window demanding X,Y values. Put longitude value in X and latitude value in Y.
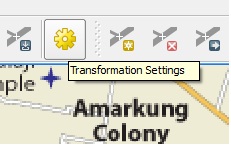
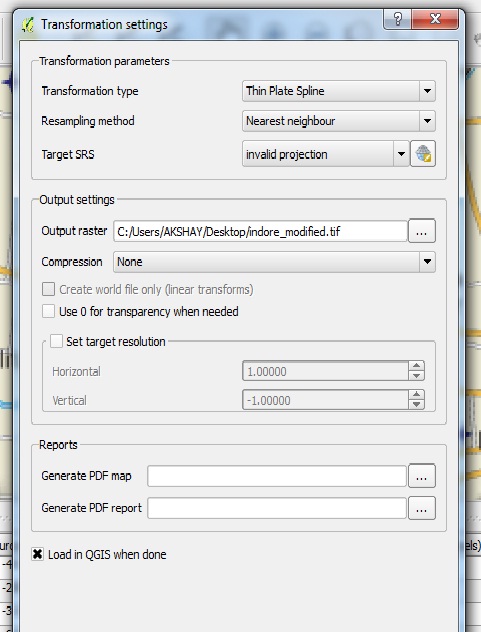
8.) Like wise add all the points. Go to Settings and click Transformation Setting.
9.) Select any one Transformation Type and Give your output raster name.
Georeference Map Image with Geo Coordinate Control points in QGIS
10.) Click load in to map canvas when done or if you forget to do so you can import the georeferenced map from the location where you saved it. The extension for the map will be .GeoTiff.
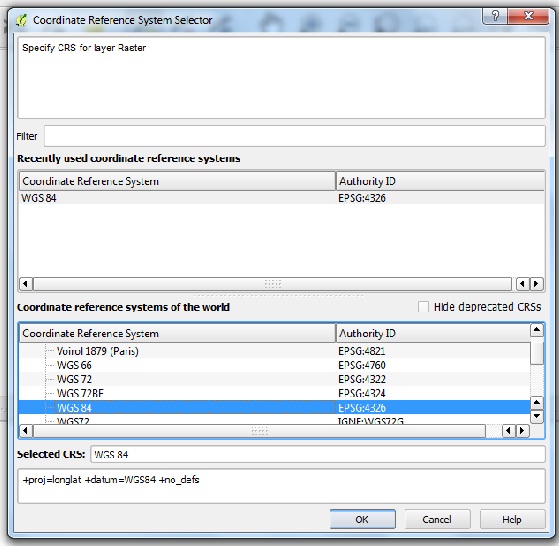
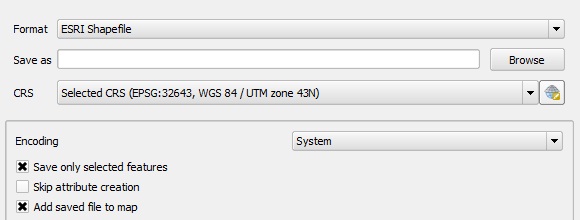
11.) Select CRS WGS: 84 because we are using Latitude and Longitude.
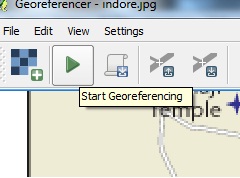
12.) Now click start Georeferencing symbol as shown below:
13.) Close georeferencer. You will see georeferenced image in canvas. Note the coordinates.
I hope this article would be helpful for you to know the basics of how to georeference raster image with the help of control points. You are getting problem in implementing the process do comment below, so that we can discuss over it.
Alternatives to Google Map Engine API. You might be looking for this, as Google have announced earlier in January 2015 for Map Engine API depreciation and deactivated after January 29, 2016. This would also result in all your account Geo-referenced data losses, which you should have already exported.
GME as a Google product provides mapping services to many individual and organization. This leads us to explore for more alternative with features which is provided by GME, which are listed. Many of the below listed mapping services have different pricing plans, which you can choose after experiencing free trial plan and options from them.
Following are few of the listed services provided by Google Map Engine, which you may look before comparing the alternatives:
List of 8 Best Alternatives of Google Map Engine API
IGIS Map – An Alternative to Google Map Engine
MapOG Analysis (Earlier named as IGISMAP now changed to MAPOG) is a web based GIS application. Here you can create your own map, convert GIS format into other format, share your created map. IGISMAP tends to be number 1 choice for many GIS and all other industries users who want to create, share, analyse and embed map.
Feature of IGISMAP :
No coding skills required – Just drag and Drop and Few clicks to create Map
Simple and Easy User Interface
Multiple Base map supports
Ultimate Query and Analysis Tool
Best Data security and User access control feature
Multi roles support – Admin, Developer or Business User
User Cloud data security is our first priority – Scalable and reliable
Cost Effective and simple pricing – much cheaper and more storage with data hosting on AWS secured servers.
All Major GIS Spatial files support – Shapefile, CSV, Excel, MapInfo, GPX, KML, KMZ, TopoJSON, GeoJSON, GeoTiff, DXF etc.
Digitise map by creating point, line and polygon layer – only available feature in IGISMAP Analysis.
Mango Maps -Alternative to Google Map Engine
Without writing a single line of code you can easily make web map application which are hosted of a secure cloud server of Mango Maps. Even non technical users can quickly create stunning interactive web maps and can be shareable easily with private groups or to the public around the world. Mango Map provides maximum features which GME tends to provide to their users.
You can try their free account that allows you to make upto 3 maps with unlimited number of layer and 200 MB of data storage.
Over 20,000 and more users are using Mango Map. You may look on map gallery of Mango Map which users of Mango explored.
CartoDB is a Geo-spatial database on cloud. It is capable to quickly create map application on top of Google map platforms. CartoDB provides Interface to manage data and create maps and with help of APIs create applications. As Google Map Engine provides a simple interface, you would also look over to CartoDB Editor interface which also tends to be very simple interactive and User friendly.
They also provide a free plan to access unlimited datasets, unlimited mapviews, limited to upload 4 layers with 250 MB of vector data and 10,000 tweets per month, while if you may opt for other enterprise plan too.
Maximum GIS data are supported in CartoDB for uploading i.e csv, .tab, .shp, .kml, .kmz, .xls, .xlsx, .geojson, .gpx, .osm, .bz2, .ods as Vector and tif as Raster data.
CartoDB also provides MAP API, SQL API and Import API which also uses PostGIS to provides lots of GIS processing function. They provide the service on Google Cloud platform.
Mapbox is an another cloud based solution which we can look as an alternative to Google Map Engine to some extent. Its scalable, cheap and uses open source technology. User can easily choose nicely designed base map from their predefined maps and can add them to their own custom application easily.
They also provides Android and iOS SDK along with Javascript API for development of map application. Their tools and APIs will help you to add location to any application.
uMap is an OpenStreetMap Project which help you to “create maps with OpenStreetMap layers in a minute and embed them in your site”.
It lets you choose the layers of your map, add POIs as markers, lines or polygon with managing colors and icons, import geo-reference vector data like geojson, gpx, kml, osm etc, choose and add license from your data and finally embed and share your map.
Simialy to uMap which made over openstreetmap, you may also look geojson.io which is also a fast, simple tool to create, change and publish maps. You may try geojson.io from here.
Both uMap and geojson.io is opensource project and can be treated as an alternative to Google Map Engine (GME).
Esri – ArcGIS Online – Alternative to Google Map Engine
Esri is an international supplier of Geographic Information System software, web GIS and Geo-database management applications. ArcGIS online is product of ESRI and is used for creating interactive maps for website and applications which gives an ability to discover, use, make and share maps from any device from anywhere, anytime. ArcGIS online provide ready to use Maps comprised of authoritative maps with data, visualize large amount of data, brings power of analytics, API tool for developers and many more.
Esri also provide 60 days free trial, which you can opt for before subscribing the tool. You can try ArcGIS online from here.
GIS cloud is a cloud storage platform where you can easily create, edit and customize your maps and can share and publish maps in web and applications. It provides to quickly integrate with Google base Map, customize your application like layout, style, and custom logo effortlessly, use data collection and populate your data into a map layer in real time and can share your data in a blink of eye. GIS Cloud can be considered as a good alternative to Google Map Engine, for further detail, you may look to this link explaining how it can be an alternative to GME.
iSpatial – Alternative to Google Map Engine
iSpatial uses Google Maps and Google Earth product in a task based approach to solve complete problems. It is used to create, annotate, add layer data, combine all datasets and search and manage real time updated data. You can easily share your data, communicate effectively and export data to other users or systems. You can opt iSpatial as one of an option for being an alternative to GME. Have a look of iSpatial from here.
espatial – Mapping software – Alternative to Google Map Engine
While eSpatial cannot be treated as a direct alternative to GME, but you take a look on it if you are working mostly with Excel data and wanted to convert the excel spreadsheets into maps in a go, then, this tool can become one of the most powerful mapping software for you. eSpatial uses Google Maps as a powered base map. Here is the link to visit eSpatial website.
Are we missing any other best alternative which should be in the list above. Have you tried any of the above services before and whats your experience with the same, do provide a review below as comment so that we could discuss and make some gist out of it. I hope you would figure out the best alternative mapping services.
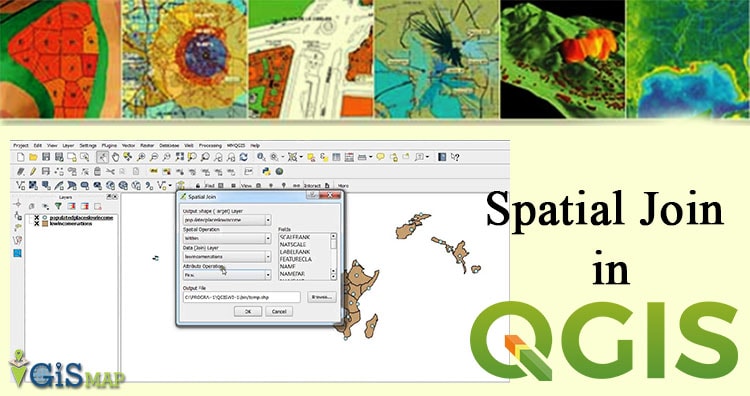
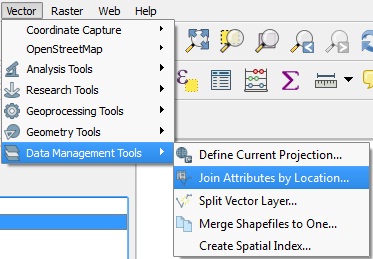
Spatial Join in QGIS – Quantum GIS an open source software. Spatial join is used for joining or transferring attributes of two vector layer based on their spatial relationship. In QGIS we can perform this task using Join Attribute by Location tool.
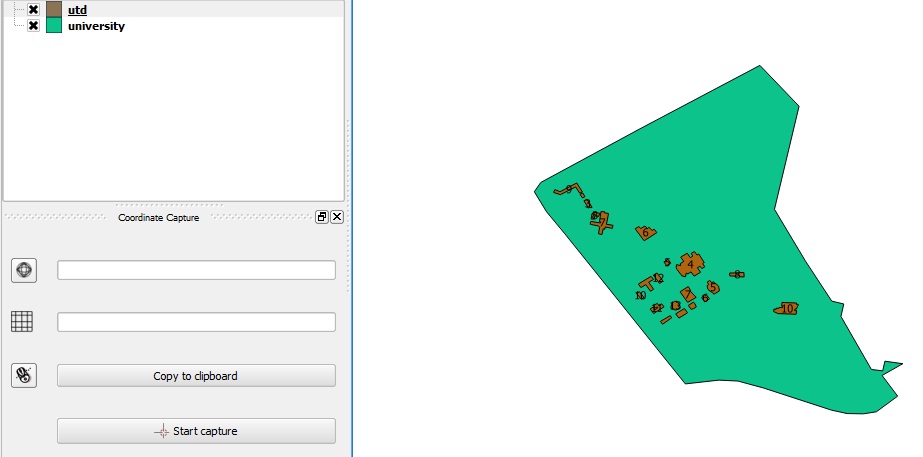
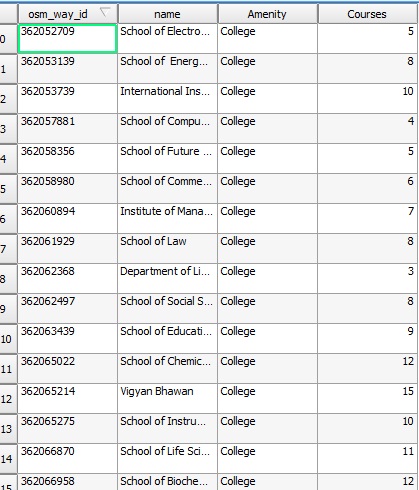
Here we have a university spatial data where, there are 21 teaching departments in this university. Each department runs a number of courses. The no. Of courses of each department is given. We want to find out total no. Of courses run by the university. We can find this by simply adding all the numbers, but here we will see how to use Join attribute by location tool.
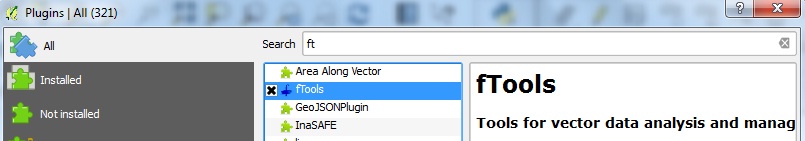
If these tools are not enabling by default you can enable these tool by going into plugin manager, as shown below in image.
Spatial Join in QGIS
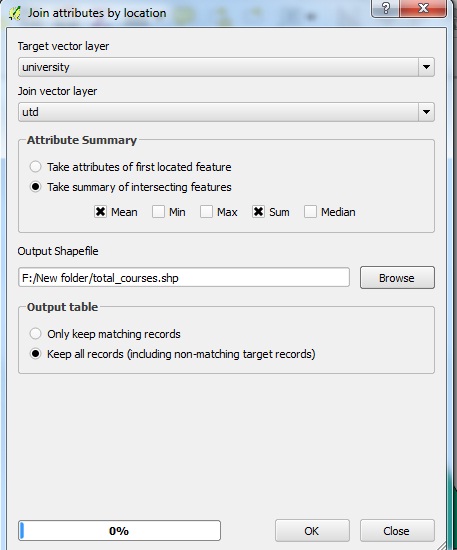
2.) Set the Dialog box as follows: Target vector layer is the layer to which we want to add the attribute. The join vector layer is the layer from which we are transferring the attributes. Click on take summary of intersecting features because we want all features covered by the location and we want to keep all the records as there are no matching records. Click OK.
Spatial Join in QGIS
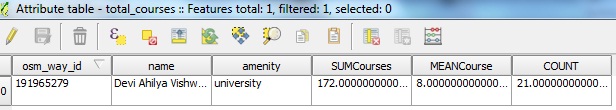
3.) A new layer is added to the table of contents. Open the attribute table of new layer. where you will get the Count Column as total number of University department, which was our desired result.
4.) Here we have got some unwanted fields also. As we only want SUM of courses as a field, so we will delete the other fields. We can delete column only in editing mode. So click on toggle editing tool and click on delete column. Select the column which you want to delete and then click ok. Click save edits, and again click on toggle editing tool.
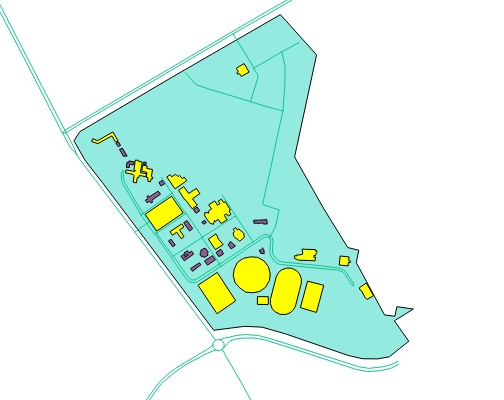
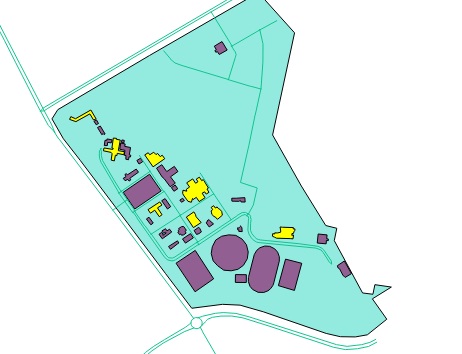
Select and calculate features according to area, length and perimeters in QGIS. Let us explore some selection technique and also how to use calculation in QGIS. To calculate these parameters we have to change the unit of the calculation to meters. If the layers are in WGS84 CRS we will get measurement in degrees, so first we have to change the CRS of our layers as well as our project. You can also look over other tutorials in QGIS.
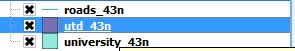
To do this, we will import the vector layers which are in projected CRS and change the project CRS by changing project properties. For this map we have selected WGS 84/ UTM Zone 43N CRS you can select zone as per your region.
Select and calculate area, length and perimeters of features
Let us select the features which have area greater than 1000 meter square and save these features into different layer. To complete this task we need to implement following steps:
1.) Open QGIS and open a polygon shapefile layer in QGIS. Select the opened layer for which you want to calculate area.
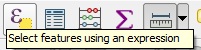
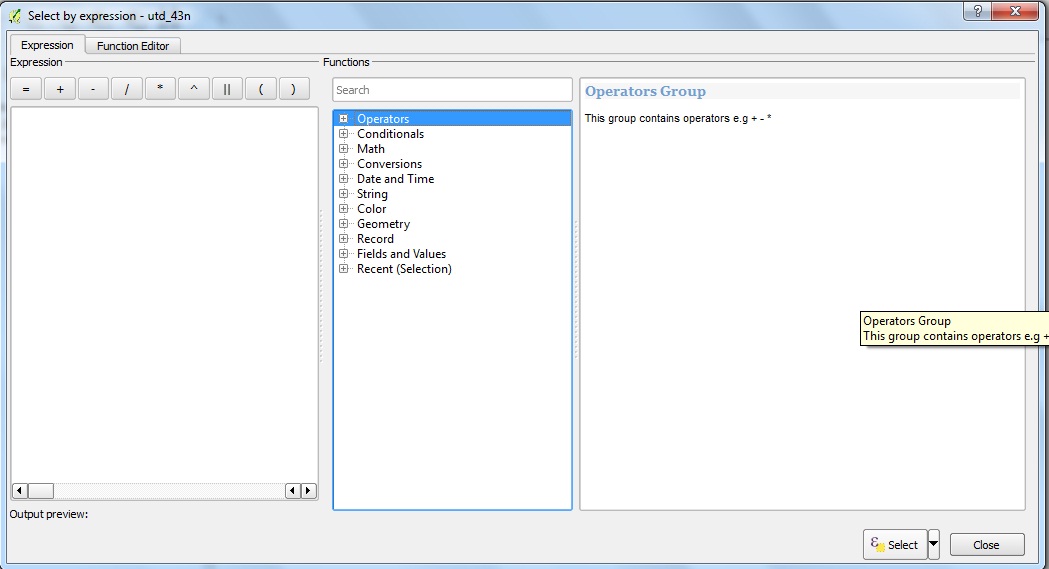
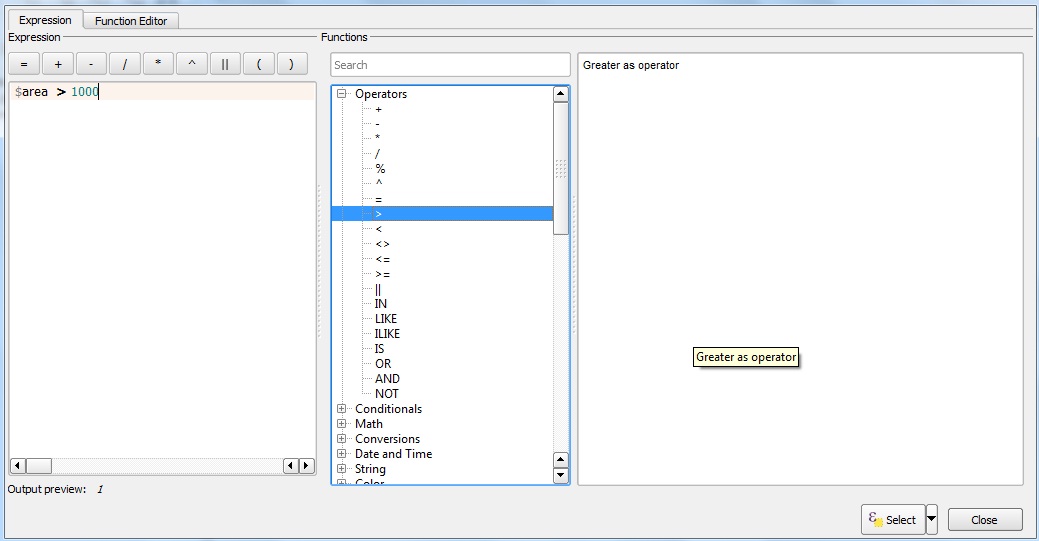
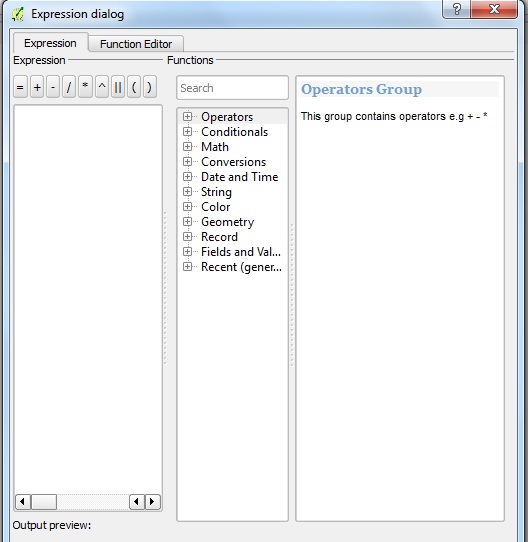
2.) Now click select feature using expression, from the tool box. This will open up one window as shown below.
3.)Find $area by going into geometry and select it by double clicking on it.
Select and calculate area, length and perimeters of features
4.) Set the query as shown in image. Click select and then close.
5.) Feature which have area > 1000 have been selected and highlighted as yellow color.
Select Within Selection Filter
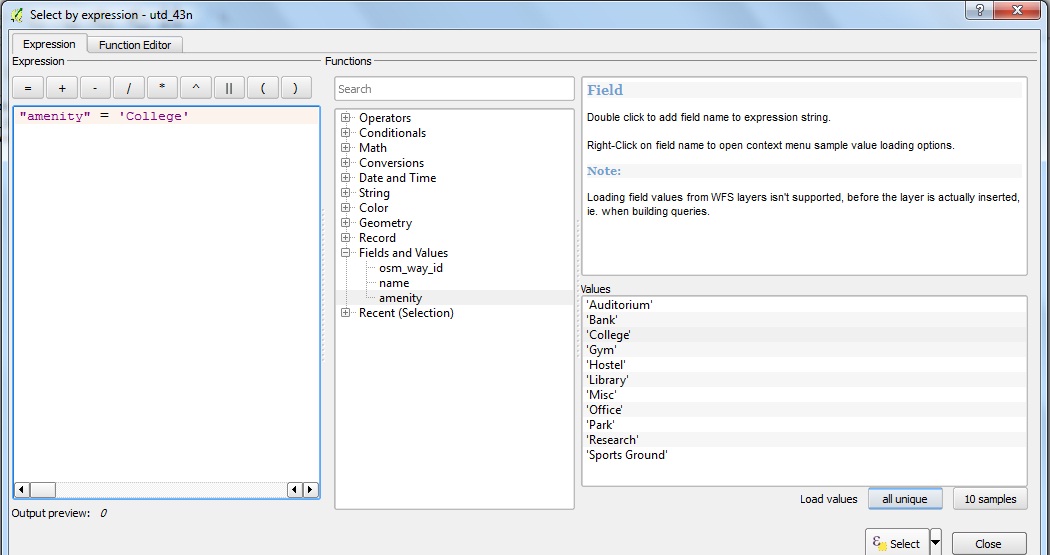
1.) Now we want our selection to be more specific. We don’t want grounds in our selection but only buildings specifically which are university teaching department. To do this, lets implement steps.
2.) Again open select feature using expression tool. We will go to fields and values and select amenity. On clicking it we will get all unique values in the amenity field. We set the query as shown in the image.
Select and calculate area, length and perimeters of features
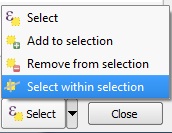
3.) Don’t click on select instead click on drop-down near it and click select within selection and then close.
4.) Look at the results.
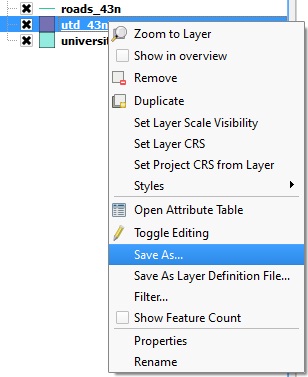
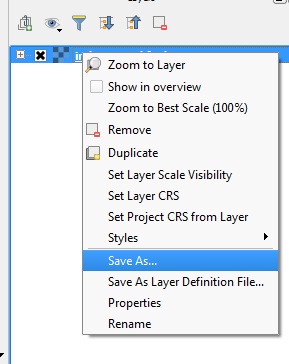
5.) This selected layer can be saved as another file by just Right click on the layer and click save as.
6.) Click on the option save only selected features. Click on browse button and save the layer to the desired destination. The layer will be saved and added to your canvas.
Select and calculate area, length and perimeters of features
Calculate Length of features
There are many ways to calculate these Length, area, perimeter etc parameters. It depend on us which way we select. The result will be the same all the time. Let us check them one by one.
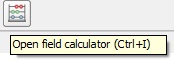
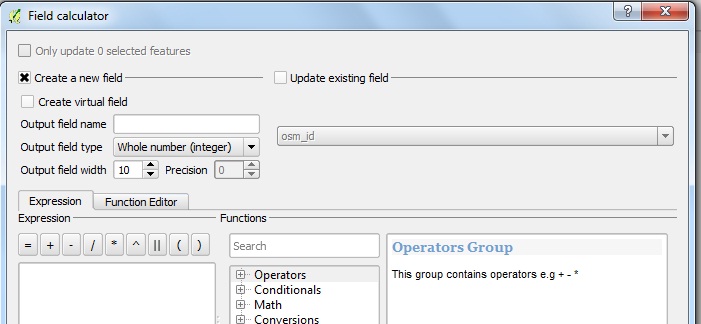
1.) Open the attribute table of the roads layer and then Click on the field calculator.
2.) You will find three options to calculate and take a look on values, as follows:
Create a new field: A new field will be created and editing will be automatically enabled so that you can save the new field.
Create a virtual field: A new field will be created and editing will be automatically enabled so that you can save the new field, and if you don’t want to save it will automatically delete the column when you close the attribute table.
Update existing field: This will update the existing field with the new data.
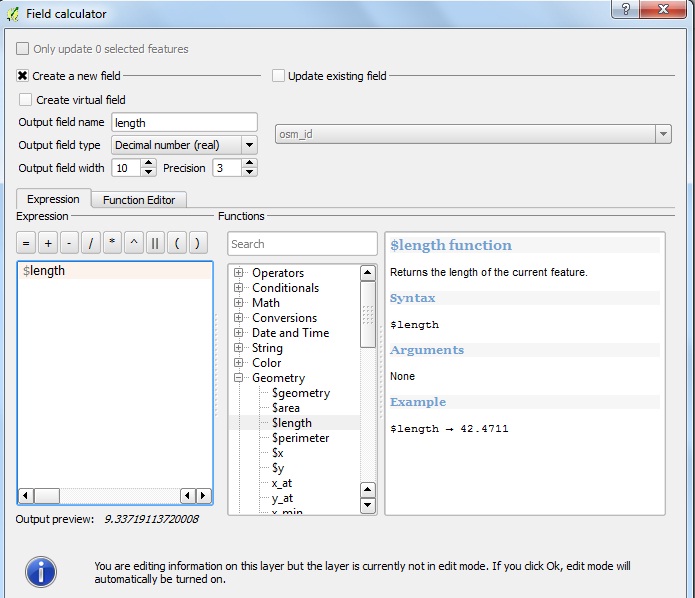
3.) Set the calculator as shown in image. Click OK and take a look at the attribute table.
Select and calculate area, length and perimeters of features
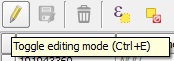
4.) You can see that the toggle editing tool has been activated automatically. Save edits. And close the attribute table.
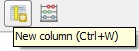
5.) Now let’s calculate length with another method. Click on toggle editing tool in the attribute table. Then click on new column.
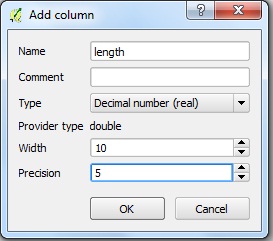
6.) Fill the text boxes and click ok. And then click save edits.
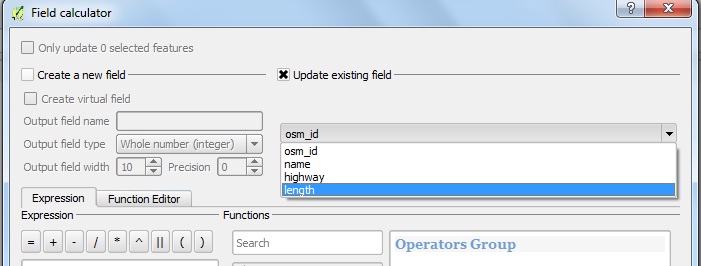
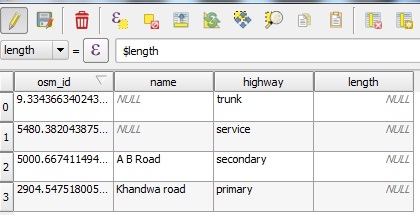
7.) Now again click on the field calculator and click on the update existing field, select length from the Drop-down menu.
8.) Calculate the length as above and click ok.
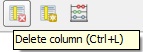
9.) The field is updated. Click on save edits and then click toggle editing to disable editing. You can also delete a column or two by going into editing mode and click delete column.
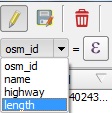
10.) Now let’s take a look at another method. We can calculate length without going into field calculator also. Create a new column as shown above and then select the column here as shown in image.
11.) Click on the expression dialogue sign in front of the column name.
Select and calculate area, length and perimeters of features
12.) Now you can calculate the length by selecting $length. Click ok. You will see the column is not updated.
13.) Click on update all button.
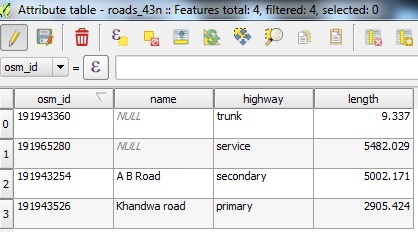
14.) Now the column will be updated. Click on save edits. Then disable editing.
15.) If you want to calculate length for a particular feature only for example length of primary roads only so first select the row which contains primary roads and then calculate length and then click on the button update selected.
Similarly you can select filter features and also calculate length, area, perimeter etc in QGIS. If you are getting any problem in following the steps provided, do comment below with the problem statement. This will let us to discuss over it.
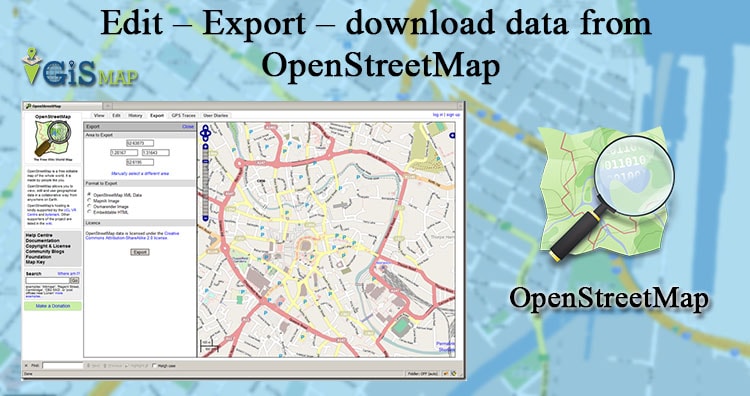
Edit – Export – download data from OpenStreetMap (OSM). Open Street Map is a free editable map of the world, and is very easy to handle. Here in this post we will see how to edit and create geometries on open street map. Also how to export, download and convert the .osm file to any other file.
Steps to Edit – Export – Download data from OpenStreetMap:
1.) Sign in – Before starting editing you need to have one Account in OpenStreetMap to your, so create the one if you don’t have any and login with your account.
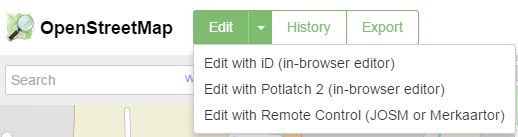
2.) Click the Edit dropdown menu button, placed at the upper left of the map, where you will find following three options:
Edit – Export – download data from OpenStreetMap
Where In-Browser editor are used to edit online and JOSM is used for offline editing.
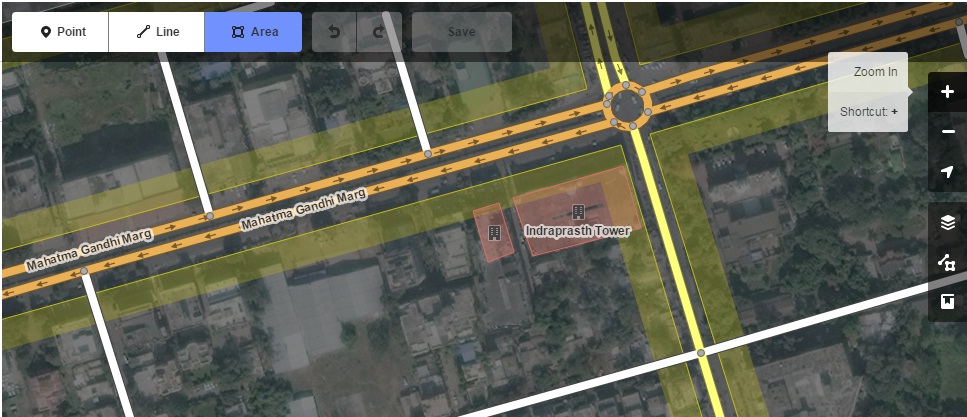
3.) Lets try with iD In-Browser editor for demonstrating editing here. So click Edit with iD option.
4.) Screen will shows up as follows:
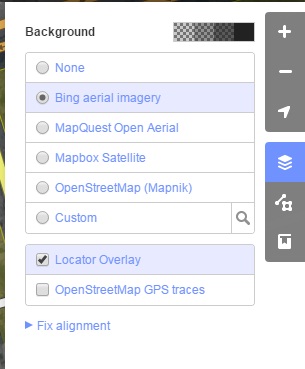
In right hand side you have various option which you can explore one by one and is very easy to understand. Bing Ariel imagery is preferred in background which is by default is in background however you can select any background you want.
5.) Now we can start editing. You can select either Point, Line or Polygon from your screen.
6.) Click on the screen on the location where you want to edit. If you selected a point then just click on the location and press enter and then fill the entries on the left hand side and give necessary information.
7.) Click save and your edits will be saved, which you may see it again by opening the osm in another session. Likewise you can digitize lines and polygons.
8.) You can export the map from osm and it will be downloaded to your computer with extension .osm.
Edit – Export – download data from OpenStreetMap
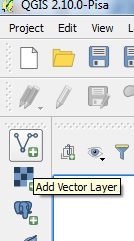
The exported .osm file can be opened in QGIS or many other GIS tools.
Here I am showing you how to open .osm file in QGIS. Select Add Vector Layer icon as shown below, and browse to the location where you saved the downloaded file and click open.
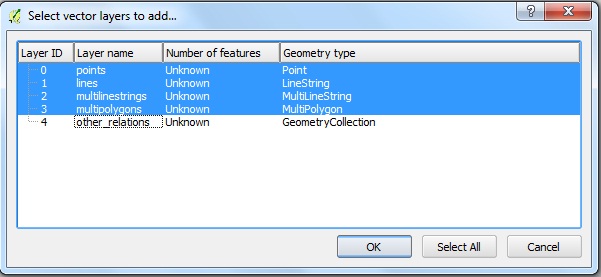
A pop-up will open. Select layers as shown in figure.
Edit – Export – download data from OpenStreetMap
Now select OK. The downloaded map will be imported on the map canvas. In the layers space, you can see four layers which was exported as an example which are .osm layers and can be easily converted to any other GIS vector file like shapefiles.
Download OpenStreetMap OSM data directly from QGIS:
1.) We can also download osm map of our desired location to our computer using QGIS.
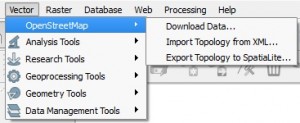
2.) In QGIS click vector and click openstreetmap and click download data.
3.) Enter the coordinates. Click … and give the name of the output file and click download.
4.) Downloading will take some time depending on the size of the data.
After downloading map you can convert back the osm data to any other spatial data, preserving database attributes too. You can also use some advance plugin given in repository of QGIS. I hope this post would have helped you to export Spatial data with the help of OpenStreetMap. If you are getting any problem in performing the steps do comment below also, if have any other tricks to export spatial data from openstreetmap or any other source do provide us the reference by commenting below.
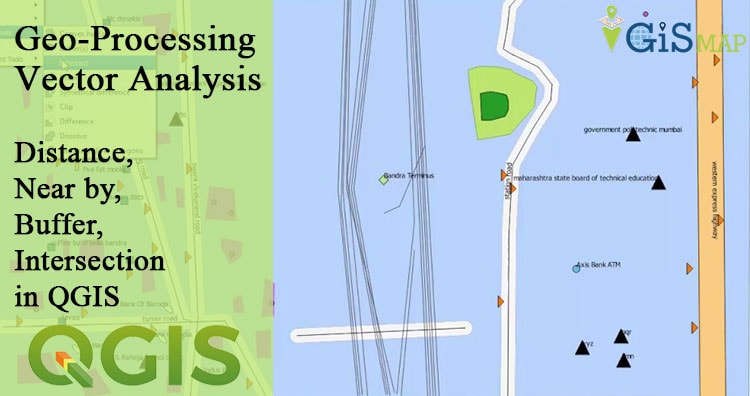
Geo-processing Vector Analysis – Distance, Near by, Buffer, Intersection in QGIS. Vector analysis is one of the important part of GIS. There are many vector analysis operation which we can discuss on another article theoretically. Here you will learn how to perform vector analyssis with QGIS too. Suppose, you want to select and find some places which are within some distance from main road or near to some landmark places for analyzing the location. All this can be done by GIS Geo-processing Vector Analysis operation. Finding schools which are near to main road within a distance of 1km or finding a hospital or police station within a distance of 1km are some of very basic example of Vector Analysis Operation. Here, we will see a small demo of how to use some vector analysis tool like Distance, Near by, Buffer, Intersection in QGIS.
Let us download some osm free available data for performing operation. We have downloaded some data from a Very well known university. The downloaded comes is in WGS 84 CRS or Pseudo Mercator CRS. To calculate distance in meters the data must be in projected coordinate system. For our region it is WGS 84/ UTM zone 43N. You can choose CRS according to your area.
Converting CRS – For Easy calculation:
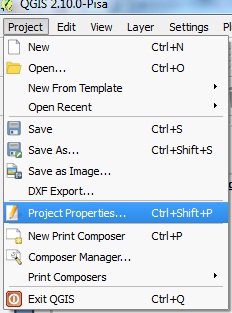
If your data is already in CRS projection, then you may proceed to see the below article and perform some vector analysis operation. Now we will first change the CRS of our project in QGIS tool. Go to Project click project properties.
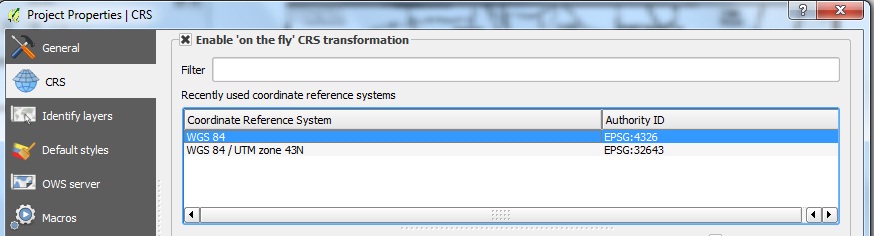
Select CRS and find out the CRS which suits your region. Notice the coordinate displaying on the screen.
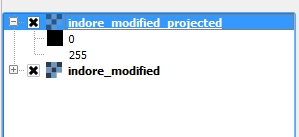
Our layers are not in projected CRS. So now right click the layer and click save as.
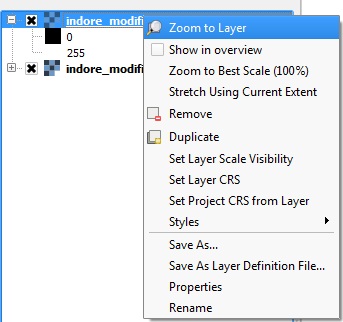
Save the file in shapfile format and change the CRS of the layer to projected CRS and click load in to canvas when done. Click OK. If you don’t see the layer in canvas. Then right click on the layer and click zoom to layer. Now turn on the “On the fly projection”. And now you will see the layer disappears. Again right click on the layer and click zoom to layer. You will see the layer appears with other layers on the map. Remove the layer with WGS 84 CRS. Now do the same with all the layers. Which are not in projected CRS.
Geo-processing Vector Analysis – Distance, Near by, Buffer, Intersection in QGIS
Lets Select Schools from the polygon Layer:
Go to properties. You can also open the properties dialogue box by double clicking on the layer. Select general tab and click query builder.
Geo-processing Vector Analysis – Distance, Near by, Buffer, Intersection
2. Double click on the field which you want to select and then select the operator i.e =, >, < , LIKE, != etc as per the requirement and then click sample to find out the values in that field, as can be seen in the image provided below.
Geo-processing Vector Analysis – Distance, Near by, Buffer, Intersection
3. Click ok in query builder and then select ok in general tab. You will see only the features you have selected according to query.
You can rename the layer, export and import the projected layer again or make a copy of the layer and clear the query by going back to query builder to get the original layer.
500 meter Buffer operation Around Schools :
Now we will create a 500m buffer around schools. QGIS will automatically calculate the result in meters because we have changed the projection to CRS system and the basic unit in projected CRS is meters.
Now click vector and click Geoprocessing tool and click buffer.
We have selected ‘Dissolve buffer results option‘ to dissolve overlapping buffer zones. Now Click ok, and close window after completion of the process.
which provides result as the provided below image in QGIS canvas.
Geo-processing Vector Analysis – Distance, Near by, Buffer, Intersection
Similarly, we can create buffer on the roads also, as shown in another example below.
Intersection – Vector Analysis in QGIS:
Lets compute the intersection area of the above two buffers i.e one buffer for schools and other over the roads. Lets start intersecting:
Click on the vector and then geoprocessing tool and then select intersect.
2. Click ok and then close the window after completion of the process. You can see the result showing intersection between two layers.
Find some point which are falling within the buffer boundary:
Now let us find some point which are falling within the buffer boundary of the schools. We are not selecting specific values here for this case. But you can do if needed.
Go to vector, click research tool and click on select by location.
2. Observe the options here. You can choose any number of options according to your analysis. Click ok.
3. The result is highlighted.
Similarly you can perform operation like, finding distance, search near by etc. Hope this article would be helpful for you to make some understanding about vector analysis. Obviously, you need to perform over the tool to become more familiar with vector analysis operation. If you find any difficulties or have any suggestion, do comment below.
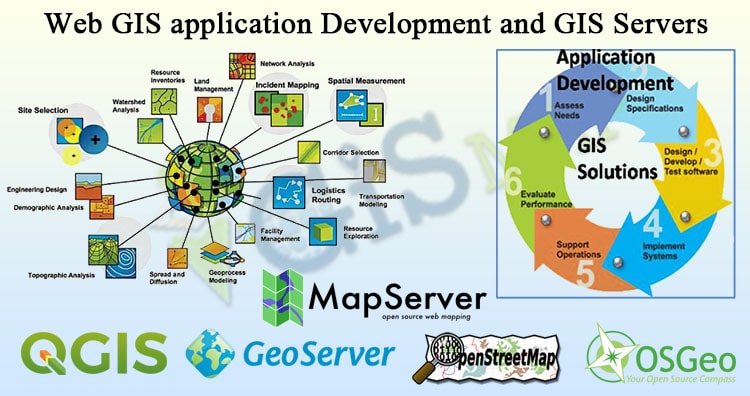
Web GIS application Development and GIS Servers. The Increasing popularity of internet, from online surfing to e-commerce to interactive chatting, has made internet an integral part of our society. Many applications in journalism, science, publishing and other fields have been changed by and adapted for use on internet. Likewise, the internet has changed how GIS data and processing are accessed, shared and manipulated. The internet is affecting GIS in three major areas: GIS data access, spatial information dissemination, and GIS modelling/processing. The internet provides GIS users easy access to acquire GIS data from different data providers.
Four Components of Web GIS: Web GIS application Development and GIS Servers
Client
Web server and application server
GIS server
Data Server
Client: The client is a place for users to interact with spatially object and analysis functions in web GIS. It is also a place for Internet GIS programs to present outputs to the users.
Web server and application server: The web server responds to request from web browser via HTTP. When the web server passes the requests to other programs, it requests service from application servers. An application server acts as a translator or connector between the web server and the GIS server.
GIS server: A GIS server is a major workhorse component that fulfills spatial queries, conducts spatial analysis, and generates and delivers maps to the client based on the user’s request.
Data server: A data server serves data, spatial and non-spatial, in a relational or non-relational database structure.
In this post we are focusing particularly on GIS servers. There are many GIS servers available on the internet such as GeoServer, MapServer, Mapnik, MapGuide, QGIS server etc. all these servers are open source servers i.e. freely available. ArcGIS also provides server but it is not available for free, but with many add on features. All the open source servers can be freely downloaded from their respective websites.
List Of Some Open Source GIS Servers:
1. GeoServer: You can read the documentation here http://docs.geoserver.org/2.7.1/user/. GeoServer is written in JAVA so JRE 7 must be installed on the machine. A step by step guide on how to start is given here. GeoServer works best with Tomcat application server.
2. MapServer: you can read about MapServer here http://mapserver.org/introduction.html. it works well with Apache application server. We need to configure apache and MapServer to use for development. A mapfile is the heart of MapServer. It defines the relationships between objects, points MapServer to where data are located and defines how things are to be drawn. To read more about mapfile here.
Web GIS application Development and GIS Servers – Mapnik
4. MapGuide: Read about MapGuide here https://mapguide.osgeo.org/. Read developer’s guide and installation guide here. MapGuide supports almost all major programming languages. MapGuide supports apache and IIS application server.
Digitization in QGIS – Exploring tools for Digitizing. Digitization is one of the important tasks for a GIS specialist. Digitization is a process of converting raster data to vector data. For this task QGIS provides many tools for efficient digitization. Digitization (or vectorization) should be clean and a copy of the raster data so that the information of the map does not change. Also consider to see other QGIS tutorials.
Digitization in QGIS – Exploring tools for Digitizing
Check if Digitizing Toolbox is activated
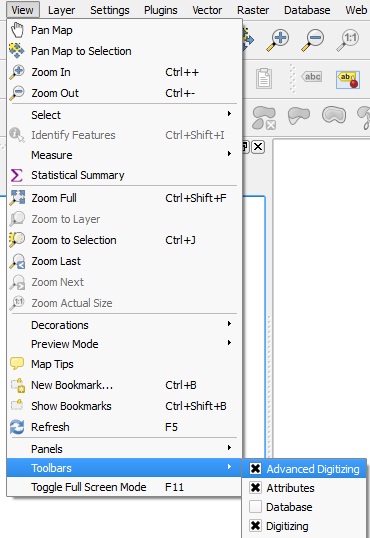
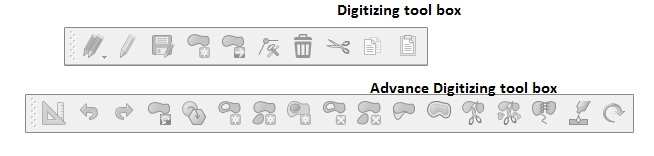
Here we will explore tools provided by QGIS for efficient digitization. First check your digitizing tool box is activated, if not then you can activate it using following process.
Click view tab in the menu bar and click toolbar and then check digitizing and advance digitizing tool box.
Create Layer:
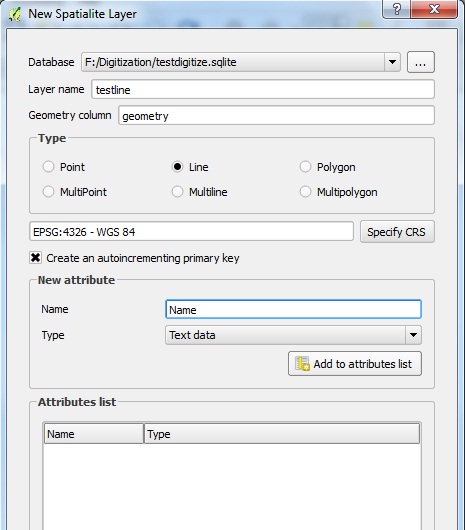
Now add some layers for drawing. Click layer in the menu bar, select create layer and select new spatialite layer.
You can select new shapefile layer if you have to digitize a single feature like some places or roads or buildings. We are selecting new spatialite layer because we will be drawing more than one feature in single file and it is easy to transfer this file.
Click ‘…’ browse button and save your database. Give name to your layer, select type of layer and specify attributes and their type such as text or numerals and click add attributes to the list and click OK. Specify CRS of the layer same as the CRS of Raster data.
Digitization in QGIS – Exploring tools for Digitizing
Snapping Tool :
Snapping is an operation to move, match and coincide exactly between two features.
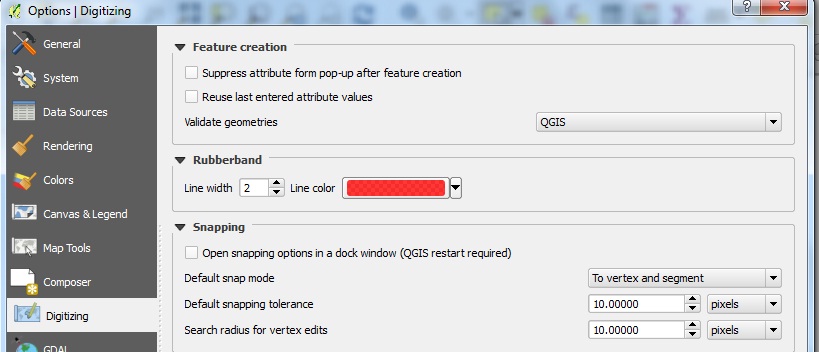
To set snapping option, Click setting in the menu bar and click options then select digitizing and in the box of snapping select default snapping mode, snapping tolerance and search radius for vector edits.
Draw Create and Edit Features:
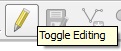
a.) lets draw some feature. If there are more than one layer then select the layer which you want to edit and Click toggle editing in digitization toolbox. As you click a pencil will appear with the name of the layer which you are editing.
b.) Click on add feature tool in digitization tool box.
c.) After drawing your feature right click to stop drawing, as you stop a pop up will ask you the value for the attributes, give appropriate value to the attributes and click OK. Click on save layer edits to save your edits.
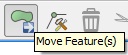
Move Feature:
You can move your feature completely by selecting the tool image provided below.
Delete or Join Node feature:
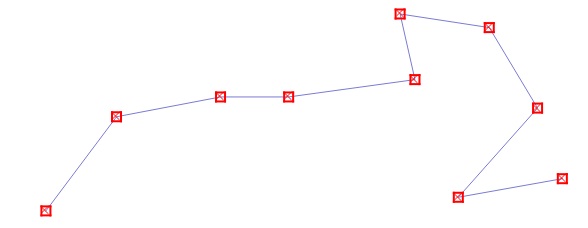
To Delete any node or you want to Join two nodes then you can use node tool as shown in the image below. Click on the node tool in the digitization tool box.
Now select the feature you want to edit.
Digitization in QGIS – Exploring tools for Digitizing
All the vertex(nodes) are highlighted with red color. Select the vertex or node you want to delete. Simply press the delete button.
To join two nodes select a node and drag the node to the other node and it will snap to the other node. Since we have set default snapping option it will snap to the other node properly. If snapping was not set it would never snap to the feature properly. You can also snap to any segment of line also.
Exploring Advanced Digitizing Tool in QGIS:
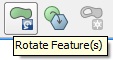
Now let’s explore advance digitizing tools. We will start with rotate feature tool.
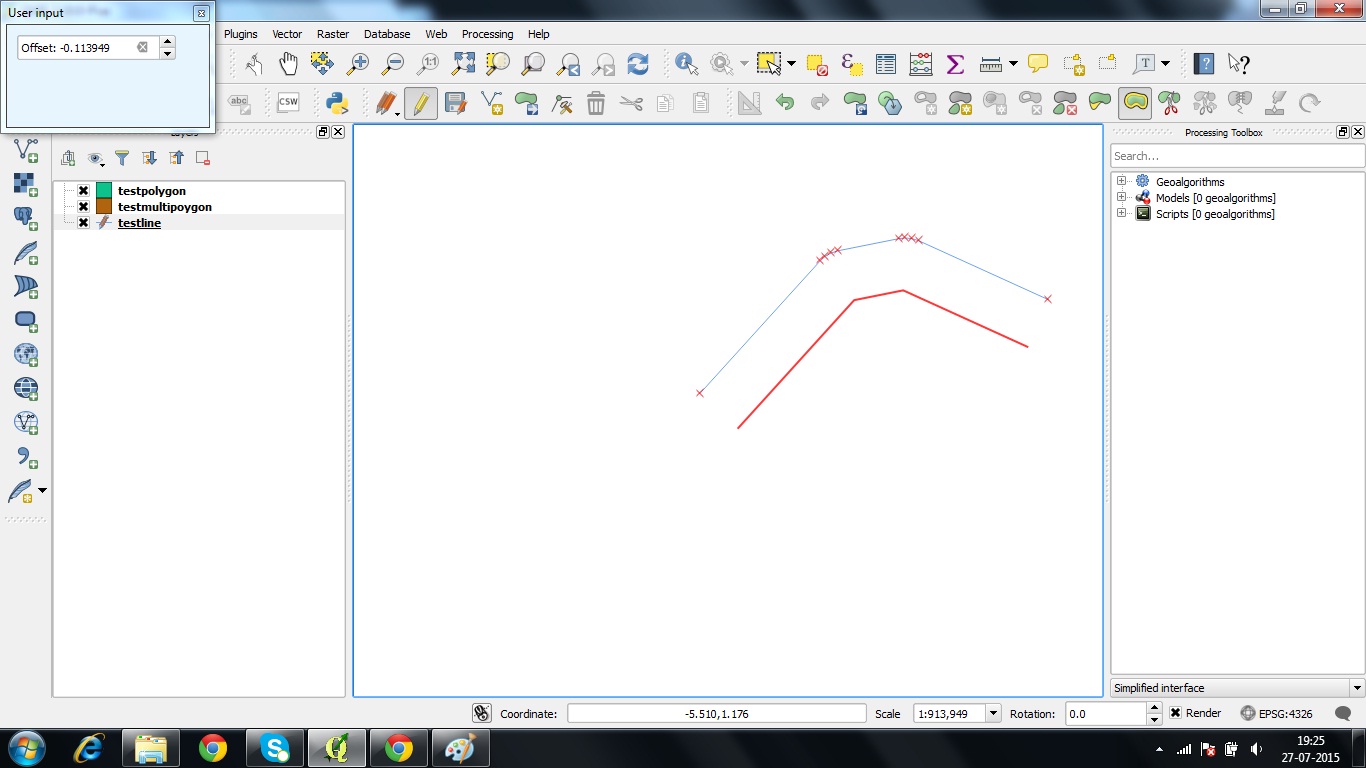
Rotate Feature Tool:
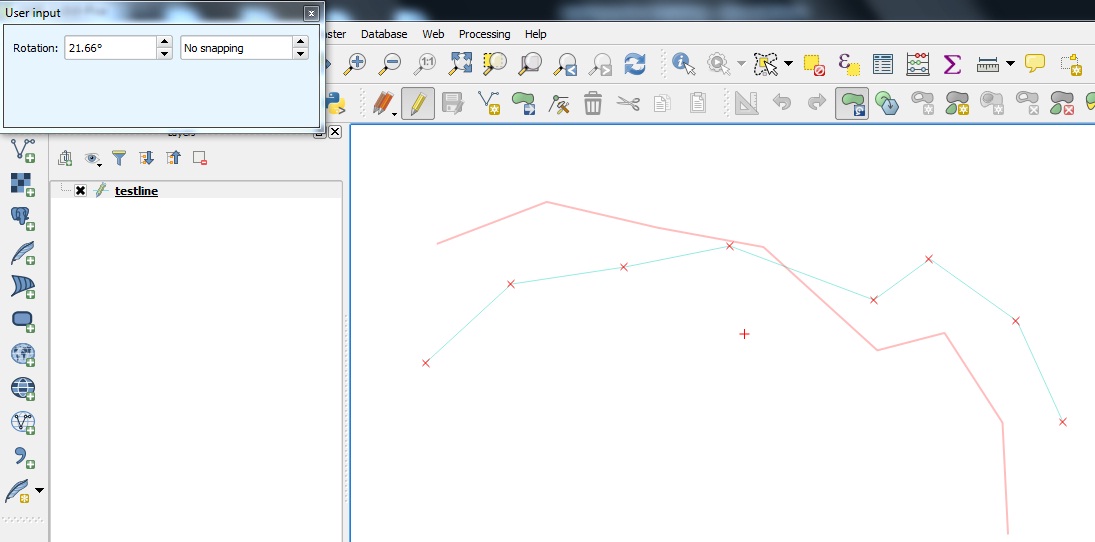
a.) First of all save your edits if any, then select the feature or features and click rotate feature tool. As you click on the tool a plus sign or anchor point is generated around which feature will rotate. If you want to change the anchor point press ctrl and click on the place where you want the anchor point. To rotate drag the feature selected.
Digitization in QGIS – Exploring tools for Digitizing
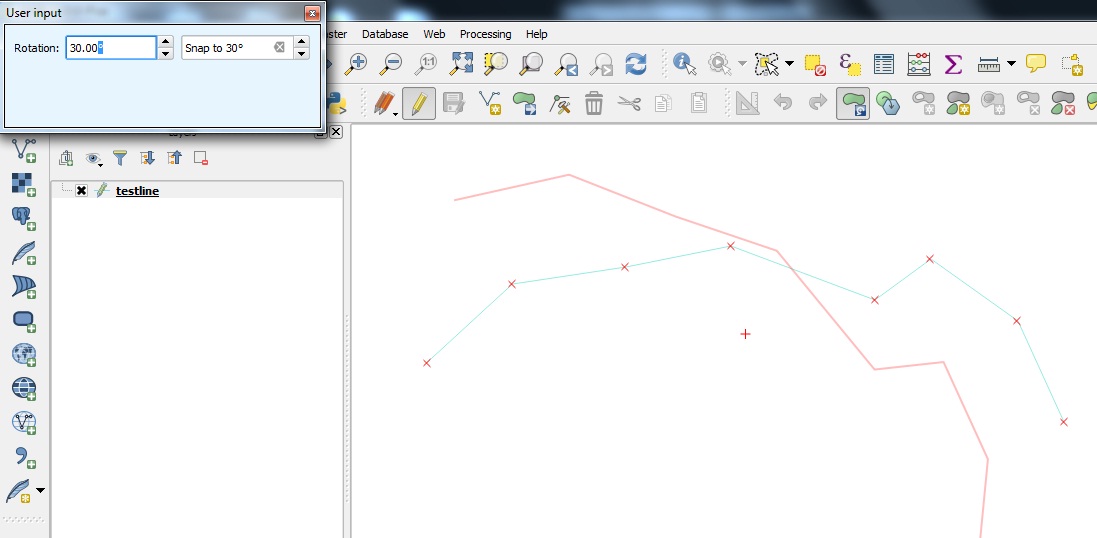
b.) You will see a popup when you start rotating the feature named user input. In first text box you can enter the angle manually with which you want to rotate and in the second text box you can select difference between two shifts.
c.) After rotating click save edits.
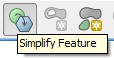
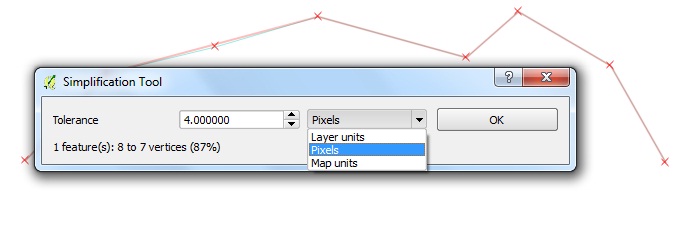
Simplify feature tool
a.) Next is simplify feature tool. If you want to reduce some nodes from your feature you can use this tool.
b.) Click on the feature you want to simplify. A popup named simplification tool will open.
Digitization in QGIS – Exploring tools for Digitizing
c.) You can select tolerance and unit as per your convenience.
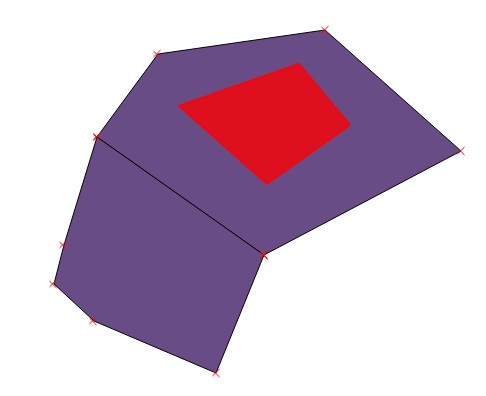
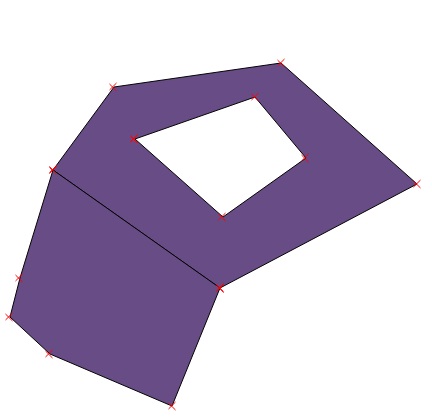
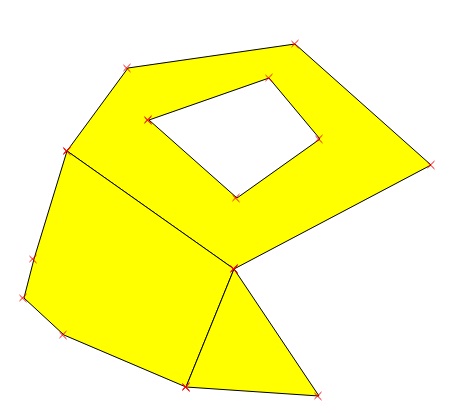
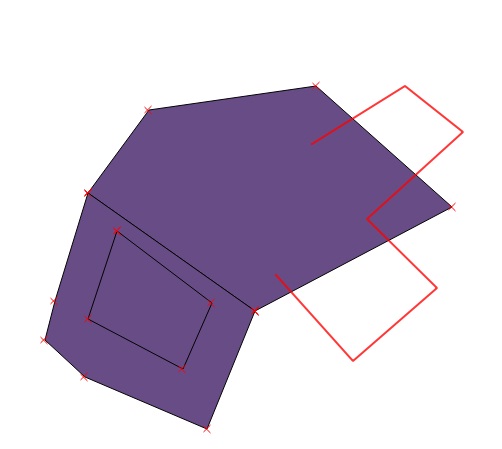
Add Ring Tool:
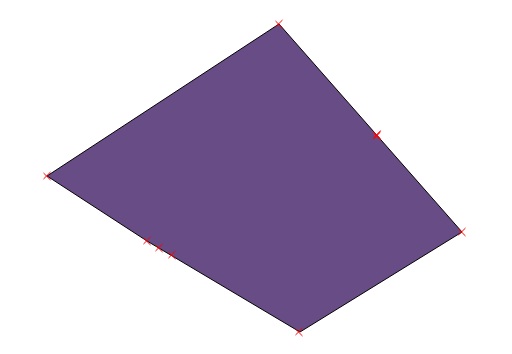
a.) Ring can be add only to polygon or multipolygon feature. Inside the polygon draw the shape.
Digitization in QGIS – Exploring tools for Digitizing
b.) Finish the shape by right click. Save your edits.
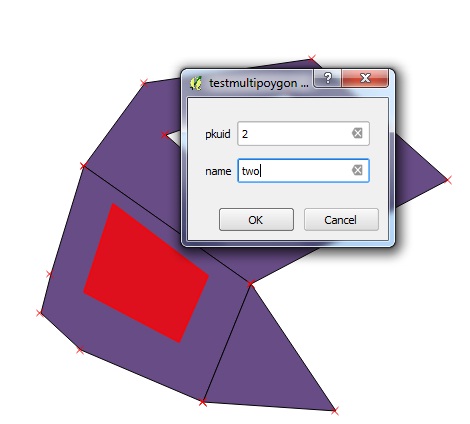
Add part tool:
To use Add Part tool your feature type should be multipolygon. If you add part to the polygon it would draw the feature but won’t save the edits.
a.) Select the feature first and then click add part tool.
Digitization in QGIS – Exploring tools for Digitizing
b.) Draw your part and to finish right click. The added part should be a polygon only otherwise it will show error. Save your edits.
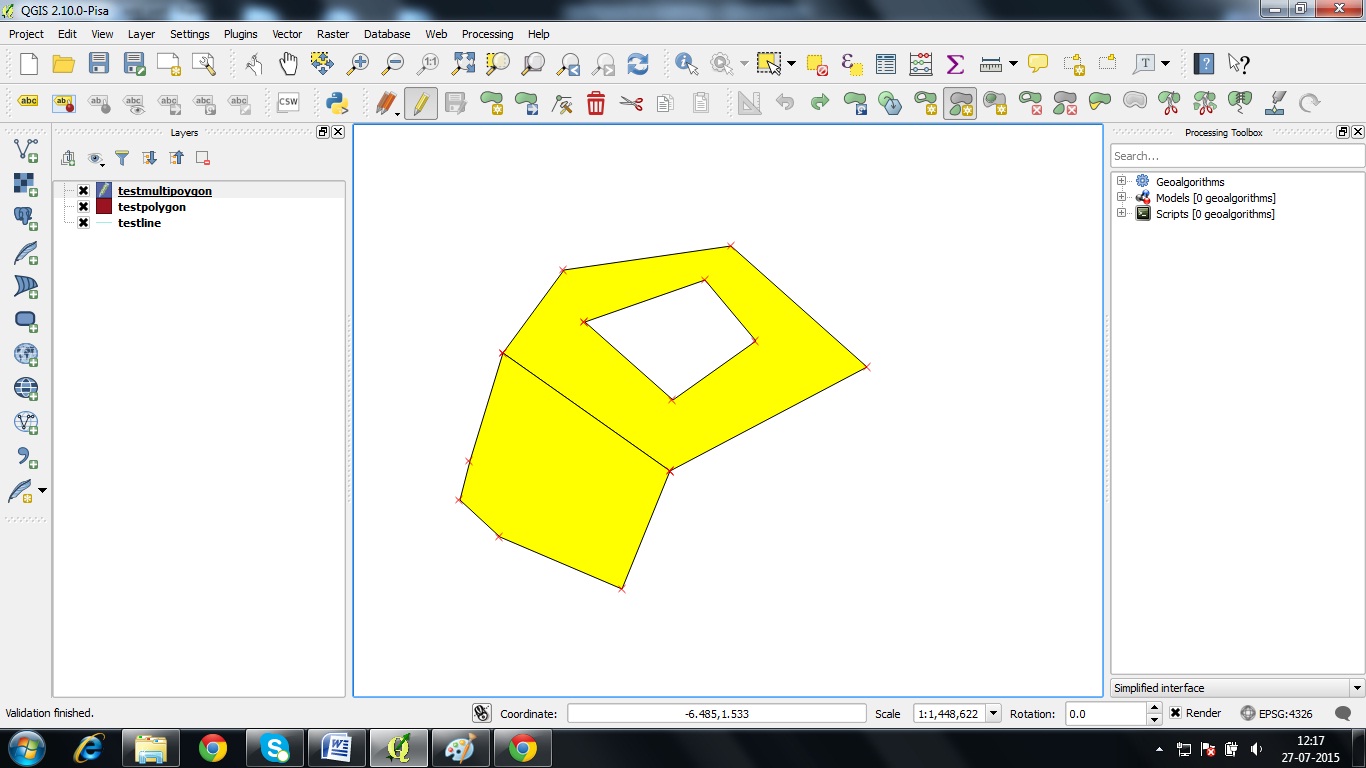
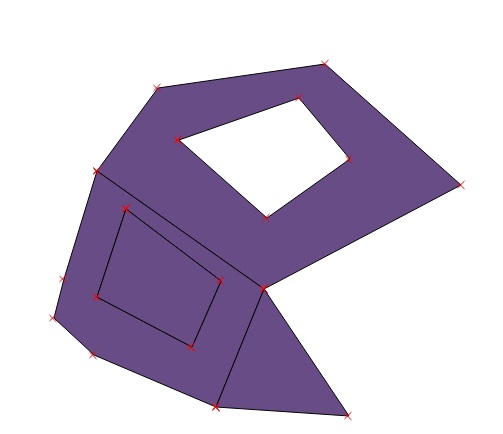
Fill Ring Tool:
Fill Ring QGIS
a.) Draw the shape. This shape should be inside a complete part.
Fill Ring Tool QGIS
b.) The shape you draw will be a different feature.
Fill Ring Tool QGIS – Digitization in QGIS – Exploring tools for Digitizing
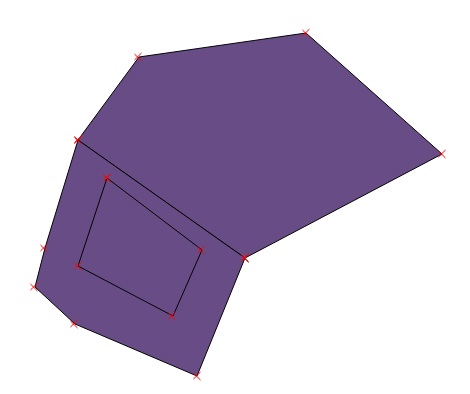
Delete Part Tool:
Click on the part you want to delete.
Delete Part – Digitization in QGIS – Exploring tools for Digitizing
Reshape Feature Tool:
Draw shape as shown in figure. First click inside the feature and then click outside the feature and then inside the feature. We don’t need to complete the shape.
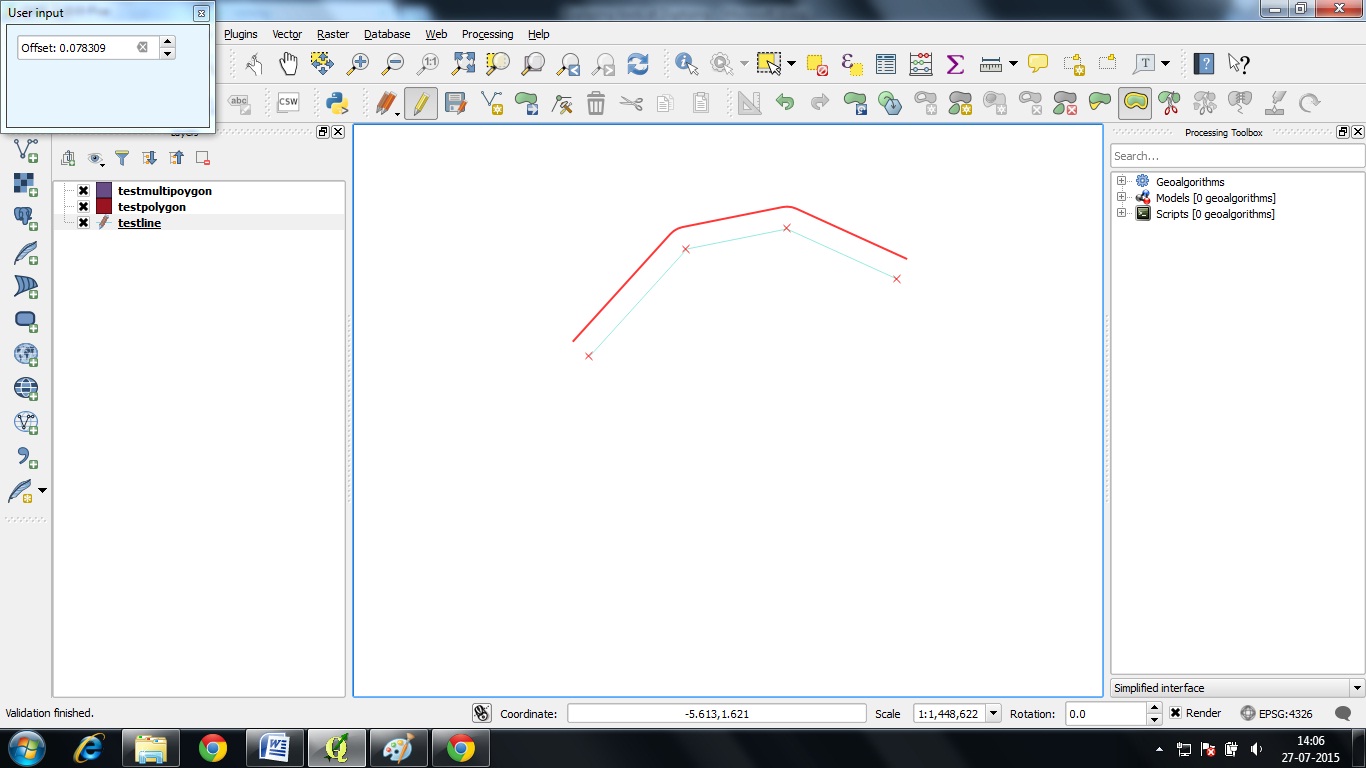
Offset Curve Tool:
Offset curve is used to create parallel shift of line feature. In edit mode click offset curve and click on the feature then drag the feature to your desired position.
Offset Curve Tool – Digitization in QGIS – Exploring tools for Digitizing
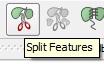
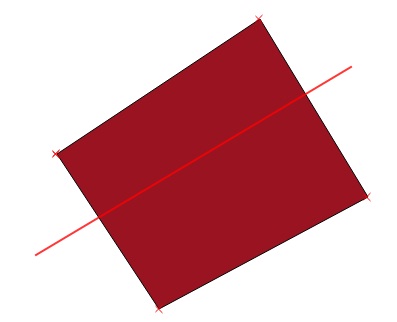
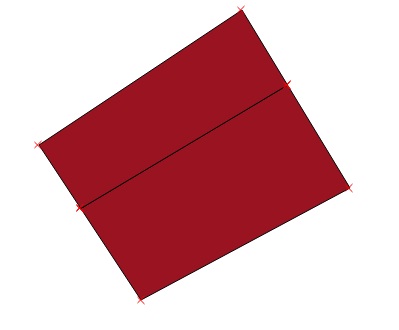
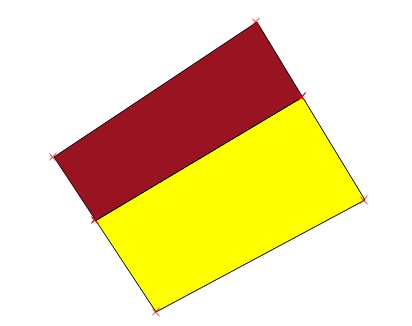
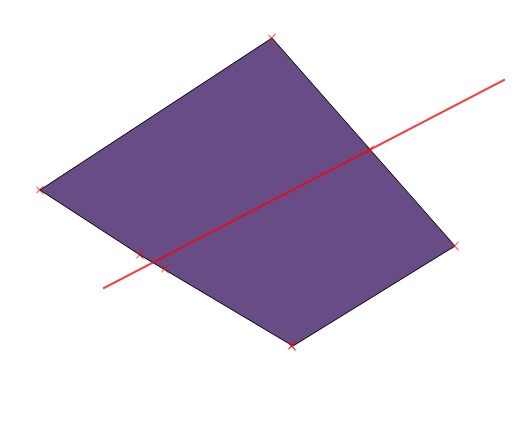
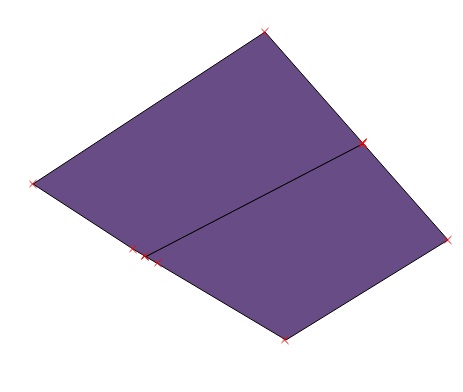
Split Feature Tool:
Draw a line across the feature.
Split Feature Tool – Digitization in QGIS – Exploring tools for Digitizing
You can see the feature is splitted.
Split Part Tool:
Split Part tool is used to increase parts in a feature.
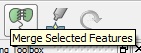
Merge Selected Feature:
To merge different feature into one feature we can use this tool. To use this tool select the features you want to merge and click on the merge selected feature tool.
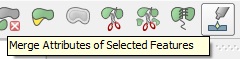
Merge Attribute of Selected Feature:
That’s all. This is really a large set of tools provided in QGIS for Digitizing. Hope this article would be helpful for you, to introduce the digitizing tools. If you want to add more, which i might be missing you may comment below. Also if you have any doubt related to any tool, do Comment below so that we may discuss over it.
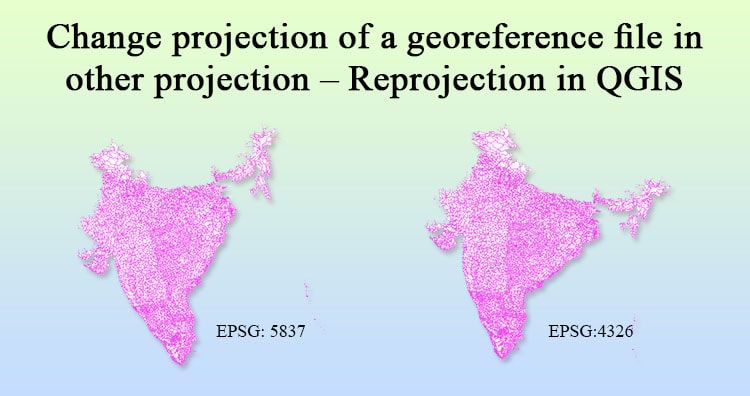
Reprojection in QGIS – Change projection of a georeference file in other projection. Earth is not a complete sphere; it is referred to as spheroid. Generally QGIS use by default Latitude and longitude (WGS 84) coordinate reference system which gives measurement in degrees. Projection is a very vast topic but we will discuss some basic concept of projection and see on the fly projection in QGIS and re-project a georeference file in other projection.
When we want to calculate distance or area over a surface of earth we will get result in degrees when CRS lat lon in degree. We cannot change degree to meters directly as it changes for different places with reference to Earth as it is not in perfect shape. To make this calculation easier, we need to transform this coordinate system to get unit of measurement in meters. Here comes a word projection which is a method by which curved surface of the Earth is portrayed as flat surface.
Change projection of a georeference file in other projection – Reprojection in QGIS:
Lets start by reprojecting Geographic Reference System(WGS-84) to projected reference system(UTM). It will work for both raster and vector data.
We are taking a georeferenced Image in WGS84 map as an example. Hereare the steps to change projection or reproject in QGIS:
1.) Import the data in QGIS.
2.) Right click on the layer and click save as:
3.) Click browse and save your map with a different name. You can use a naming convention as Map-name_projection.
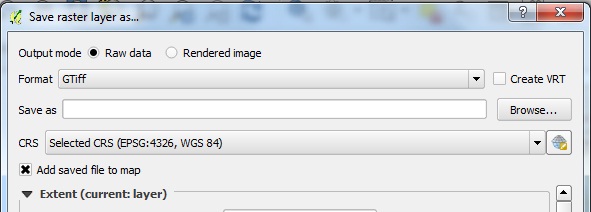
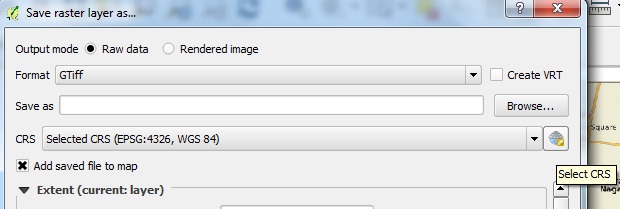
4.) Now click and select the desired CRS.
Step 4 -Change projection of a georeference file in other projection
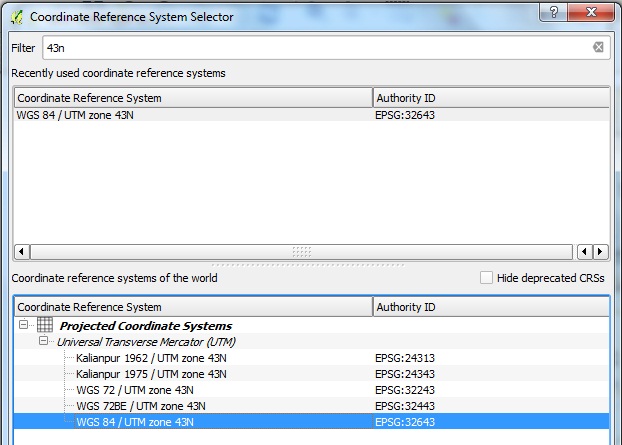
5.) Search for desired UTM zone of the your map, here I have a map of zone 43 N. Select it and click OK.
Note: We are converting the file to UTM zone. The Universal Transverse Mercator (UTM) conformal projection uses a 2-dimensional Cartesian coordinate system to give locations on the surface of the Earth. It has divided Earth in 60 zones.
6.) Check add saved file to map. Click ok button.
7.) You will see a projected map in layers but you won’t see the geographical map in the area as if on the fly projection is not enabled by default.
8.) Right click on the projected map layer and click zoom to layer.
9.) Now you will see your projected map. Notice the coordinates in the bottom.
Step 9 -Change projection of a georeference file in other projection
10.) If you want to see both maps. Go to project properties.
11. ) Enable on the fly projection and select WGS84 and click ok. You will see both maps overlapping each other.
Enable On the fly projection
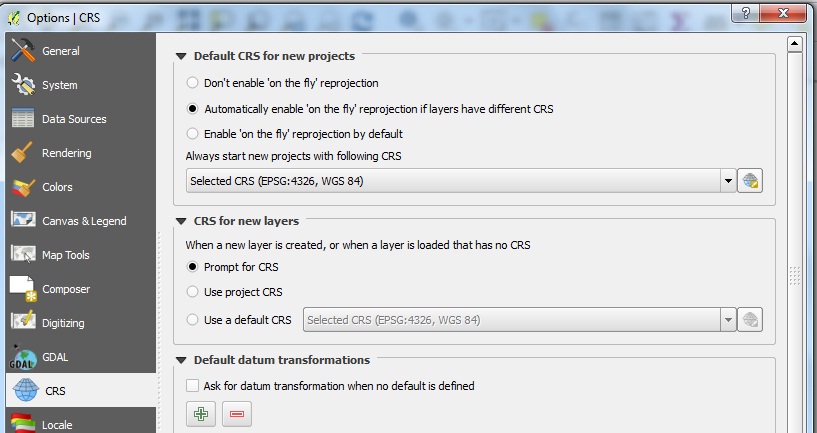
You can enable on the fly projection by default also so that if two maps have different CRS you will be able to see both maps by following the steps given:
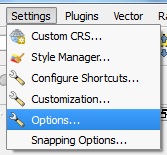
1.) Go to options.
2.) Select Automatically enable ‘on the fly reprojection if layers have different CRS.
Hope, you are now able to convert and change the projection of already georefernced file. If you find any problem in performing steps or if you think there is any steps you want to add on to this tutorial. then do comment below in the section provided, so that we may discuss over it. Also we would like to get your views on how you Change projection of a georeference file in other projection.
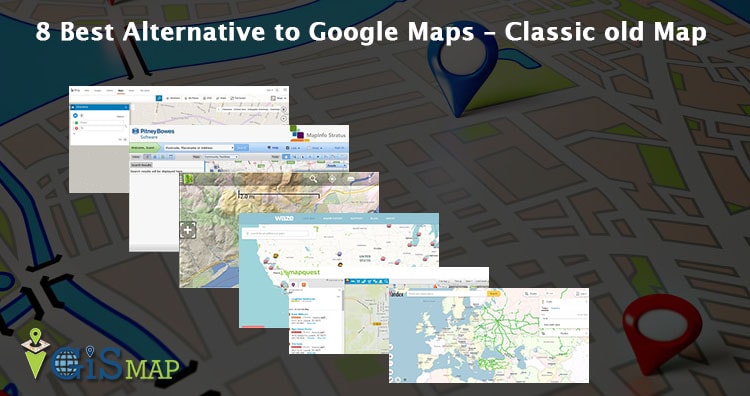
Why to look for Alternative to Google Maps – Classic old Map? Recently (around 29, April 2015) Google shut down their old classic Map and replaced it with New Google Map and lite mode. While there are many people who dont like the new Google Map as they are facing some problems like lazy loading and slow rendering of Graphics and are finding difficulty in exploring Map features, which they can easily use in Old classic Map. There are few alternative Maps to Google Map, which millions of people are already using in their daily life. Do try all of the listed Map and compare it with New Google Map.
List of 8 Best Alternative to Google Maps – Classic old Map:
1.)Google New Maps and Google Lite Mode: This is my first best alternative choice to old Classic Google Map, as you can easily access and edit the previous data which you might have saved in classic Google Map. With this advantage, I found that Google Map provides deep level of information of many places with their huge database. Without writing much about New Google Map here, you may find this link to explore Lite mode and also some of the articles, which will help you to access different features in New Google Map like, finding real time or live traffic, Measure Straight line distance, Get the route with Route planner in Google new maps orSearch nearby places.
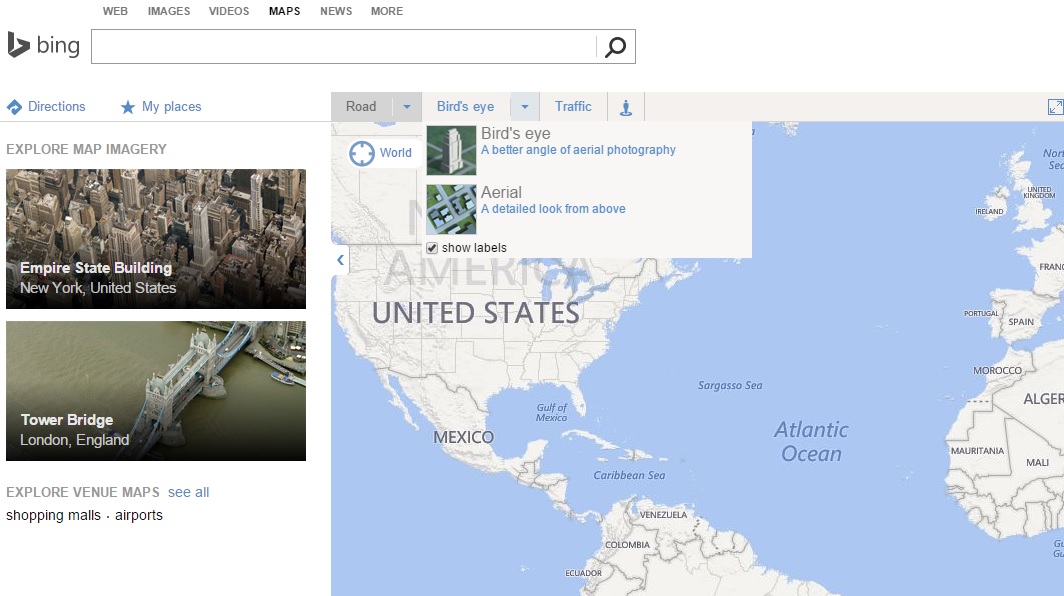
2.) Bing Maps: Bing Map is a part of Microsoft Bing suite, which we can considere as the best competitor of Google Map, featuring Street Maps, 3D Maps, Driving or transit direction, Traffic information and clearFlow, sharing and embedding maps and many more.
Bing Maps – Alternative to Google Maps – Classic old Map
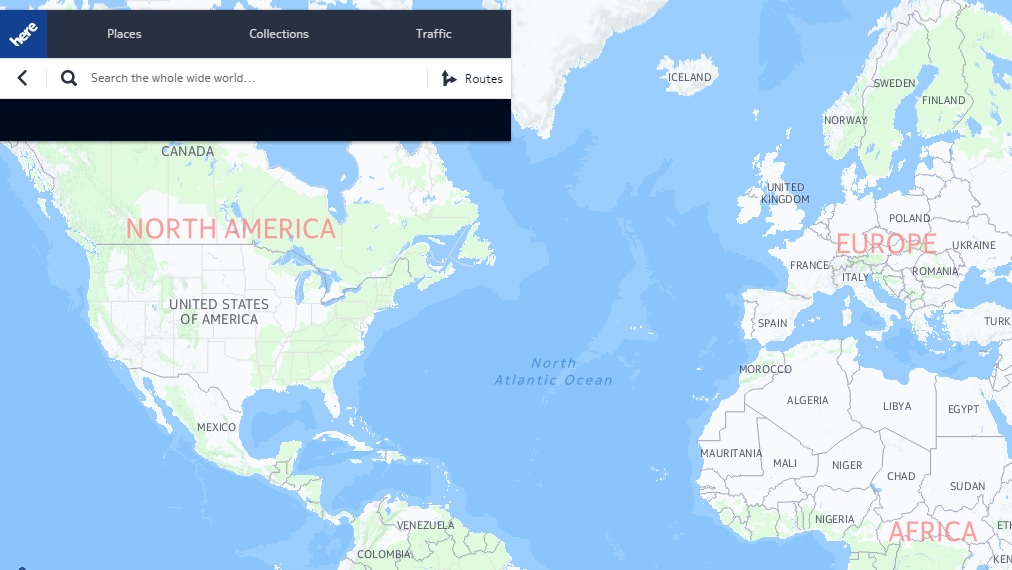
3.) Here Map by Nokia: ‘Here‘ uses cloud computing model, which made location data and services to be stored on remote servers which enables users to get access to it regardless of type of device. Here map is available, for Web, Android, iOS, Windows phone etc. Services like turn by turn direction navigation, public transit information of many cites, 3D maps, etc are provided by Here map.
Here Maps – Alternative to Google Maps – Classic old Map
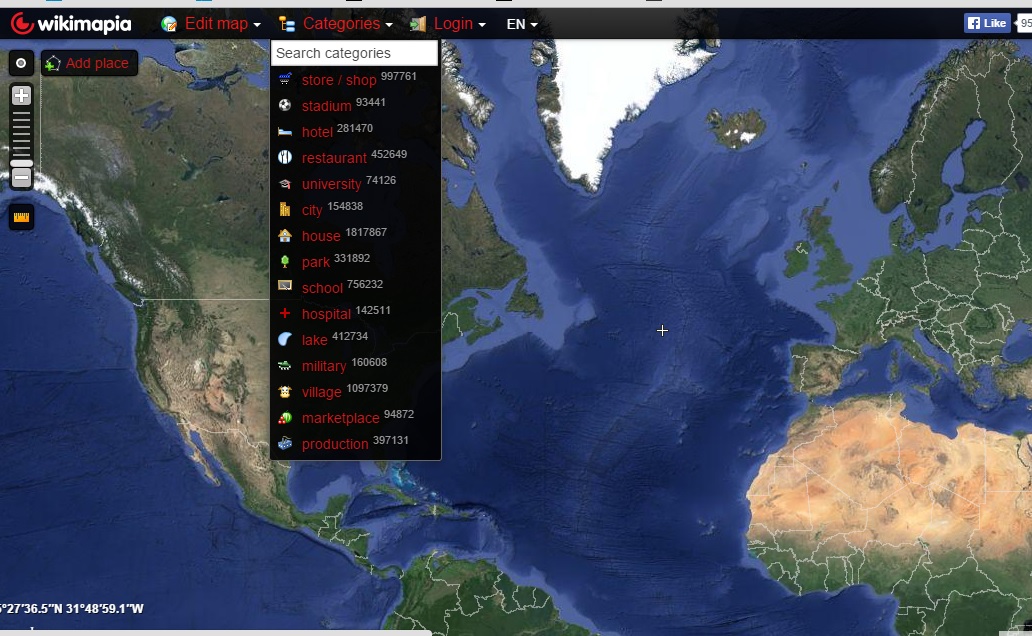
4.) WikiMapia Map: WikiMapia is a privately owned commericial mapping site, which aims to create and maintain a free, complete, detailed and up to date map to the whole world. Over 2 million people uses and around 24 millions objects have been marked by users, according to the information presented by wikipedia. With wide category and easy editing of Map, you may think of WikiMapia as an Alternative to Google Maps.
WikiMapia – Alternative to Google Maps – Classic old Map
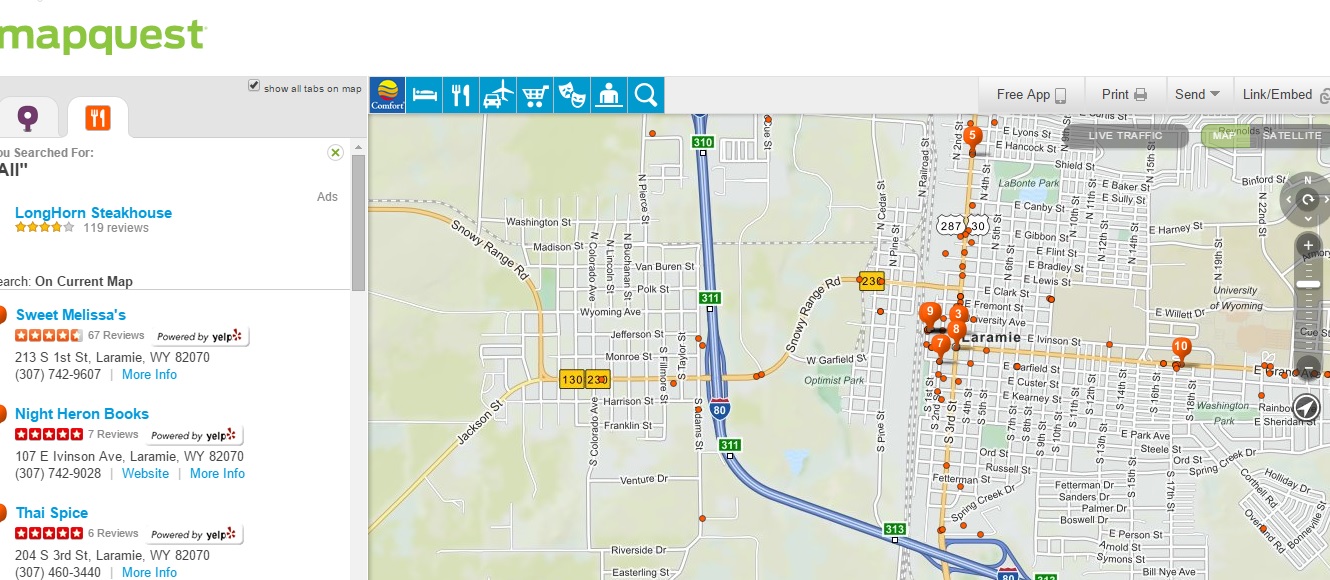
5.) MapQuest Map: MapQuest is owned by an American based Company AOL. It is using OpenStreetMap project for displaying the data providing services like information to some extent of street level detail as well as dirving direction to some countries, rela time traffic estimation etc. With Web, they also provides mobile app for android and iOS. Customizable GasPrice page feature is a new feature where users can type their address and compare the gas price of nearby gas stations.
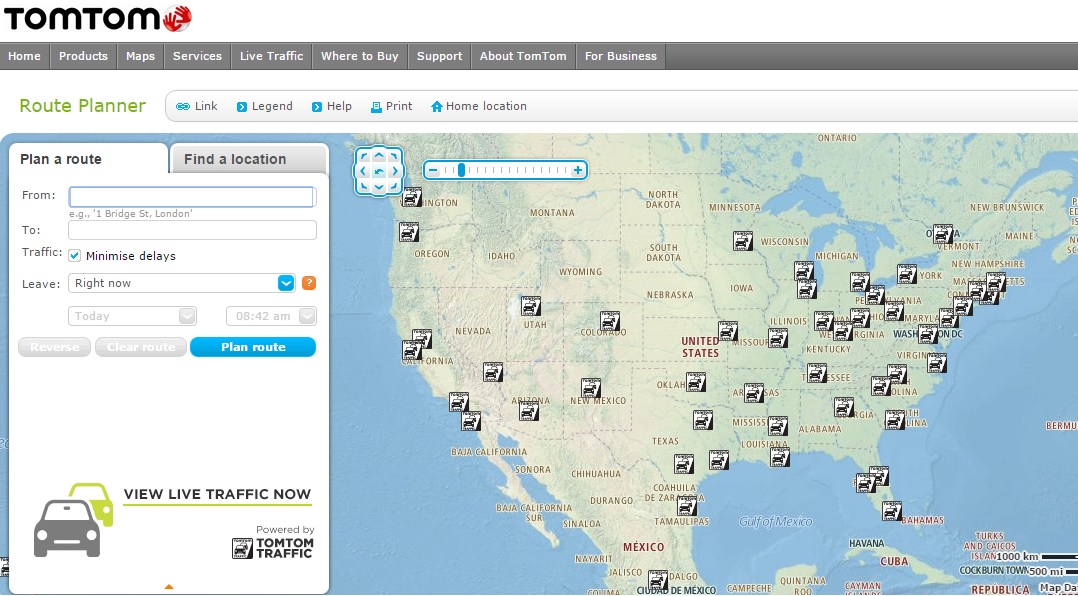
6.) TomTom Map: TomTom Maps is owned by a Dutch Company providing mapping services. It was announced as the main mapping data provider for Apple iOS 6 Maps app, replacing Google Maps. TomTom provides many products and services, like navigation, IQ Routes, traffic data, map sharing, some live services and other mapping services. With Web, you may also use TomTom from Android and iOS devices.
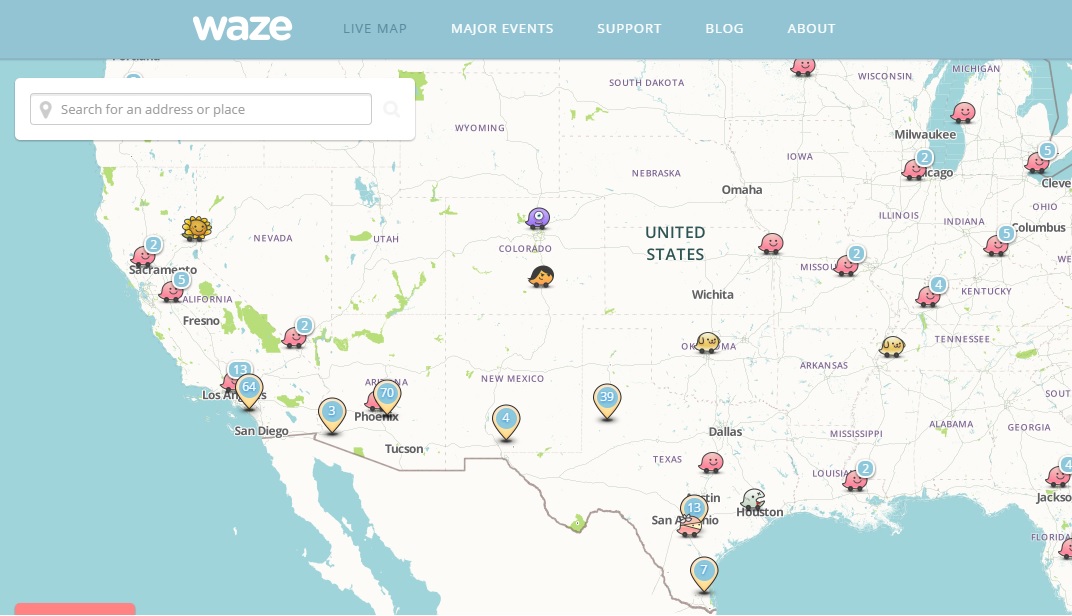
7.) Waze Map: Waze was developed in Israel and then later acquired by Google. It helps you to navigate route turn by turn, knowing the real time traffic stats. With Web, Waze supports, Android, iPhone, Symbian, Blackberrry and windows mobile phone version.
Hope this list helps you to get more alternatives to Google old classic Map. Change is important for improvement. while I still uses Google Map for most of the time. Which Map you are using? Do you have more list of Maps, which i am missing to list for alternative to old classic Google Map. Do share your view by commenting below.