Geographical Information System (GIS) is a computer-based tool that is designed to capture, store, manipulate, analyze, manage, and present spatial or Geographic data, usually in a map. GIS application is a tool that allows users to create user-created searches, integrate and analyze spatial information and present the results of all these operations. GIS describes any information system that integrates, edits, analyzes, shares, and displays geographic information. GIS technologies are using digital information, for which various digitized data creation methods are used. Here in this post we will check FAQs of Geographical Information System (GIS) and Common Question asked during Interview Question.
GIS Interview Question – Frequently Asked Question GIS
Que. What is GIS?
Ans. GIS is a blend of S/W and H/W used to collect, manipulate analyst and produce geographical data
Que. What is the difference between geo-coding and geo-referencing?
Ans. Geo-coding is when you associate a place name or an address with map coordinates. Geo-referencing is the process of associating plain digital images taken from a satellite or a plane with map coordinates so that they can be overlaid on street maps.
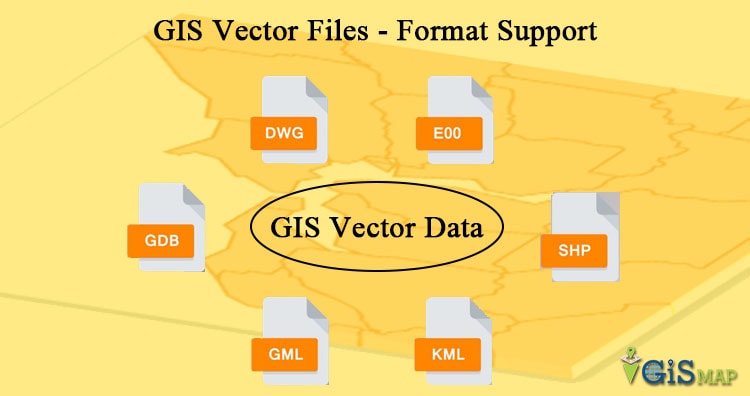
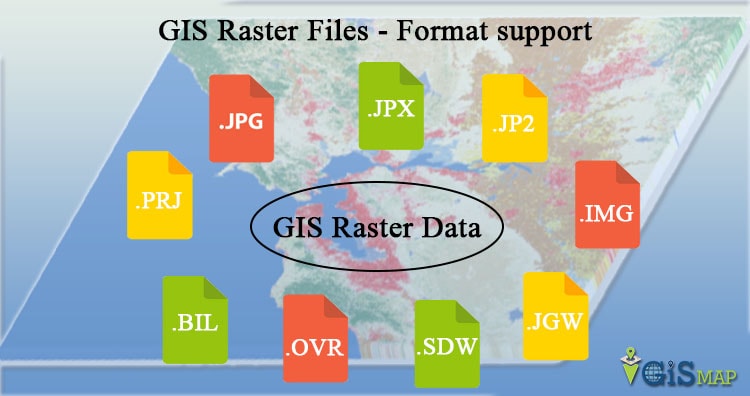
Que. Name the two data structures that have the capacity to hold spatial data.
Ans. The two data structures that can hold spatial data include raster and vector.
Que. Differentiate between GIS commands and tools?
Ans. Commands do not require interaction with the map, they just rely on surface. Tools on the other hand require interaction with the map canvas.
Que. Name applications of the Arc GIS desktop.
Ans. Arc Map, Arc catalog and Arc toolbox.
Que. Define remote sensing?
Ans. Remote sensing refers to detection and classification of objects on or in earth without physical contact, generally attained through aerial sensors.
Que. What is the role of GPS in GIS?
Ans. Competent decisions can only be rendered by reliable data and though GIS is an amazing data management tool, using it with GPS helps in validating the data analysis and results.
Que. What is a globe?
Ans. A sphere shaped model of the Earth
Que. What are the 7 large land massses found on a globe called?
Ans. Continents
Que. Name the 7 continents.
Ans. Asia, Africa, Europe, North America, South America, Antarctica, and Australia.
Que. Latitude and Longitude are measured in ____ .
Ans. Degrees
Que. What does the scale on a map shows?
Ans. Where you are,How the size of the map relates to the size of a real place and direction as North,east,south,west.
Que. What does the legend or map key tell?
Ans. Direction, What the symbols on the map mean and The distance between the equator and a point north or south on the earth’s surface
Que. What is GPS ?
Ans. Global Positioning System(GPS) is a space based satellite navigation system that provides location and time information in all the weather conditions, anywhere on or near the earth.
Que. List the satellite navigation systems ?
Ans. The navigation systems are as follows:
- GLONASS(Globalnaya navigatsionnaya sputnikovaya sistema) : Russia’s global navigation system.
- IRNSS ( Indian Regional Navigational Satellite System), COMPASS : People’s republic of china’s global system.
Que. Explain briefly the working principle of GPS ?
Ans. A Global Positioning System’s receiver calculates its position by precisely timing the signals sent by Global Positioning System satellite high above the earth. These distances and satellite location are used to compute the location of the receiver using the Navigation Equations. Although 4 satellites are required for normal operation, fewer apply in special cases.
Que. Explain the structure of GPS ?
Ans. The structure of GPS have three main segments. These are as follows: Page segment, Control segment and User segment
Que. Explain the space segment of GPS ?
Ans. Space segment is composed of 24 to 32 satellites in medium Earth orbit and also includes the payload adapter to the boosters required to launch them into orbit.
Que. Explain the control segment of GPS ?
Ans. Control segment is composed of a master control station , an alternate master control station, and a host of dedicated and shared ground antennas and monitor stations.
Que. Explain the user segment of GPS?
Ans. User segment is composed of thousands of U.S and allied military users of the secure GPS Precise positioning service and millions of civil and scientific users of the standard positioning service.
Que. What Is Gps Rollover?
Ans. This document contains information about GPS Week 1024 Rollover.
Que. What Is The Status Of Selective Availability (sa)?
Ans. Effective as of Midnight 01 May 2000, Selective Availability has been set to zero
Que. Explain Portable Gps?
Ans. Although any small global positioning system could be referred to as a portable GPS, the term generally refers to those units which give driving directions and are meant to be mounted in cars. Others, used for outdoor activities, are generally referred to as handheld GPS units. Still, there could be some times when the terms are confused and a portable GPS and handheld GPS are synonymous.
Que. What’s The Status Of The Gps?
Ans. The Global Positioning System reached full Operational Capability (FOC) on July 17, 1995
Que. What is a project (.mxd) file?
Ans. You can think of a project file as a database management tool. GIS users often must work on the same files for long periods of time, and the .mxd file is the management file that remembers which files you use, where they are located, the projection the file is stored in, the colors you have set, etc.
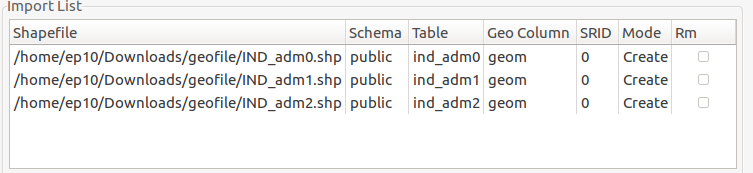
Que. What is a shapefile?
Ans. Shapefiles are computer files that produce images for users in a GIS environment. There are three basic types of shapefiles: line poin and polygon.
Que. How do I prepare spatial data for use with ArcGIS?
Ans. If you have data with spatial locators (e.g., census FIPS codes, zip codes, street addresses, etc.), you can link your data to shapefiles within a GIS environment. Furthermore, you can join tables in a GIS project.
Que. What are ArcMap, ArcCatalog and ArcToolbox?
Ans. ArcMap is the application in ArcGIS that you use to create, visualize, and manipulate maps, whereas ArcCatalog is the application in ArcGIS that you use for browsing and organizing data files. ArcToolbox is the application in ArcGIS that contains data management and conversion tools and wizards (e.g., projection tools).
Que. What are some of the functions of the Spatial Analyst extension?
Ans. The Spatial Analyst extension can help you find slopes and directions, least cost paths, and best locations for a new facility based on multiple criteria. This is useful for analyzing raster data as well as feature data.
Que. What are some of the functions of the Geostatistical Analyst extension?
Ans. The Geostatistical Analyst extension can help you with the production of statistical surfaces for exploratory spatial data analysis, structural analysis (calculating properties of neighboring areas), and surface prediction and results analysis.
Que. Is there any way to change or expand existing ArcGIS functionality?
Ans. ESRI makes a number of scripts and other downloads available for users. Scripts work with the existing software to extend functionality or to automate common tasks. The scripts on ESRI’s site come from both ESRI itself and from other ArcGIS users; you can even upload your own scripts for other people to download.
Que. How do you edit a project (.mxd) file? Why do you need to edit a project file?
Ans. Once you open your project file, editing is simple. The last saved version of your files will appear on your computer screen, and you can manipulate the existing settings to update the file. (Always remember to save it!) Project files must be edited in order for changes to be reflected in your work. You often work on GIS projects over long periods of time, and as you work, new data, shapefiles, etc. can be added to keep your project current.
Que. What is the MSD file and can I edit it?
Ans. The map service definition (MSD) file is a new file used by the fast map service drawing engine introduced at ArcGIS Server 9.3.1. The MSD file always starts with an MXD map document. You use the Map Service Publishing Toolbar to analyze your MXD in ArcMap. Once you’ve addressed issues returned by the analysis, you use the same toolbar to either publish the service or save the MSD file.
Que. How does GPS device work?
Ans. The orbits are arranged so that at any time, anywhere on Earth, there are at least four satellites “visible” in the sky. A GPS receiver’s job is to locate four or more of these satellites, figure out the distance to each, and use this information to deduce its own location.
Que. What is Selective Availability (SA)?
Ans. SA was a technique implemented by the DOD to intentionally degrade a user’s navigation solution. The single largest source of error for SPS users was SA. The net result of SA was about a five-fold increase in positioning error. DOD achieved signal degradation by altering (also known as dithering) the satellite clock. Another means designed by DOD to degrade GPS performance was to broadcast less accurate ephemeris parameters.
Que. Why was SA Necessary?
Ans. SA was used to protect the security interests of the U.S. and its allies by globally denying the full accuracy of the civil system to potential adversaries.
Que. Will SA ever be turned back on?
Ans. It is not the intent of the U.S. to ever use SA again. To ensure that potential adversaries to do not use GPS, the military is dedicated to the development and deployment of regional denial capabilities in lieu of global degradation through SA.
Que. What kind of orbits are the GPS satellites in?
Ans. The GPS satellites operate in circular 10,900nm (20,200km) 12-hour orbits at an inclination of 55 degrees. They are not in geo-stationary orbit.
How vulnerable are GPS satellites to jamming and interference?
GPS satellite signals, like any other navigation signals, are subject to some form of interference. The FAA is actively working with the U.S. Department of Defense and other U.S. Government Agencies to detect and mitigate these effects and make sure that the GPS and any related augmentation systems are available for safe aviation operations. As with all navigation aids, interference, whether intentional or unintentional, is always a concern.
Que. Is the basic GPS signal sufficient to meet all the needs of civil aviation?
Ans. This is not a simple yes/no answer. The answer is that it depends on the service requirements of each user or aviation authority. For many countries, GPS supplies a better capability than the existing ground-based systems or lack thereof. Yet for other countries with large infrastructures, the GPS signal does not meet the accuracy, integrity, availability, and continuity requirements critical to safety of flight. Enhancements to the Global Positioning System (GPS) such as the Wide Area Augmentation System (WAAS) and Ground Based Augmentation System (GBAS) provide the necessary corrections for meeting safety-of-life flight requirements.
Que. What is Differential GPS (DGPS)?
Ans. In the basic form of DGPS, the position of a reference receiver at a monitoring or reference station is surveyed in, that is, its position is known accurately. The user receiver should be no more than about 300 miles away from the reference receiver which makes pseudorange measurements, just as any user receiver would. However, because the reference receiver knows its position accurately, it can determine “biases” in its pseudorange measurements. For each satellite in view of the reference receiver, these biases are computed by differencing the pseudorange measurement and the satellite-to-reference receiver geometric range. These biases incurred in the pseudorange measurement process include errors arising from ionospheric delay, tropospheric delay, and satellite clock offset from GPS time. For real-time applications, the reference station transmits these biases, called differential corrections, to all users in the coverage area of the reference station. Users incorporate these corrections to improve the accuracy of their position solution.
Que. Will the GPS tracking system make the fleet management easier?
Ans. Fleet management involves managing vehicles and personnel available. It also constitutes route planning, route optimization, personnel management, asset tracking, vehicle maintenance, report generation, fuel management, etc.
Que. What are the gains of implementing student GPS tracking system?
Ans. You need to be clear about the potential gains of installing a vehicle tracker in the school buses before you start out on a GPS tracking system. Is it truly worth the cost and effort? Does it provide what it promises to offer? You should also consider getting a detailed demo run so that you will be able to understand the functioning of the system.
Que. Do you need a cost effective solution for vehicle fleet management?
Ans. The budget for each school to implement an effective solution would definitely vary. For this reason, you should consider the number of vehicles, data base needed (e.g. up to street level), additional facilities required, such SMS or PUSH notification facilities, etc. It should be decided whether all the features offered in a system is actually useful for you. There are advanced systems which even offer guided voice directions to make school bus trips less cumbersome for bus drivers and attendants.
Que. What is the potential for a gap in GPS service?
Ans. The Air Force is confident GPS will continue to meet existing service commitments. Several years ago, the Air Force recognized the potential for an availability gap and took action to institutionalize procedures and processes to mitigate the potential gap or minimize any impact. Air Force Space Command developed key processes within the operational community as well as the acquisition community to extend the life of on-orbit assets and to ensure capability is delivered in a timely manner. Users can employ GPS with confidence today and continue to do so in the future. As identified by the General Accounting Office (GAO) in testimony to Congress, “There have been times before where people have worried about gaps and the Air Force has managed them quite successfully.”
Que. Is GPS under U.S. military control?
Ans. Though acquired and operated by the Department of Defense, GPS is a multi-use system owned by the United States Government and paid for by the U.S. taxpayer. The outstanding performance of GPS over decades has earned the confidence of millions of civil and military users worldwide. The management structure and modernization efforts directed by U.S. policy continue this support for multi-user applications. Any misperceptions will be overcome as they have in the past, by a demonstrated record of service and performance to all users.
Que. What are the benefits of GPS tracking?
Ans. GPS tracking tells you which employees are on the clock and where they’re located. You’ll be able to see who is closest to a customer when scheduling a new job on the fly, more effectively manage employees at various locations, identify inefficiencies in workloads and routes, and build trust by adding accountability safeguards that benefit everyone.
Que. How accurate is the GPS location data from the GPS device?
Ans. Different GPS devices offer differing levels of accuracy so always ask the question. AVS GPS devices have a high level of GPS accuracy of between 5 and 10 metres or better with clear skies.
Que. What is a GPS locator?
Ans. A GPS locator does not record regular position updates, it will only log its position on command. Simply send a TXT to the tracker and it will TXT back its’ location. Some GPS locators will send GPS co-ordinates (Latitude and Longitude) which can then be entered into Google to bring up a map.
Que. What are the limitations of GPS tracking?
Ans. GPS tracking is not invincible and no GPS hardware will be able to guarantee position logs 100% of the time. GPS devices rely on being able to communicate with the satellites in space and so in highly built up areas or underground carparks reception can be blocked.
Que. What is GPS tracking?
Ans. GPS tracking is a way of determining the location of a vehicle, person or other asset. A GPS device is attached to, or installed into, the asset you wish to track. The device then uses the Global Positioning System to record the position of the asset at regular intervals.
Que. what is trilateration?
Ans. A GPS receiver uses trilateration (a more complex version of triangulation) to determine its position on the surface of the earth by timing signals from three satellites in the Global Positioning System.
Que. What is the difference between triangulation and Trilateration?
Ans. As GPS satellites broadcast their location and time, trilateration measure distances to pinpoint their exact position on Earth. While triangulation is associated with surveying, no angles are actually involved in GPS positioning. Surveyors usetriangulation to measure distant points – not GPS receivers.
I hope this Question answer might have helped you in understanding Geographical information system and in clearing the Basics interview question of Geographical information system. Let us know if you have any other list of questions answer available in Geographical information system by commenting below in the space provided.

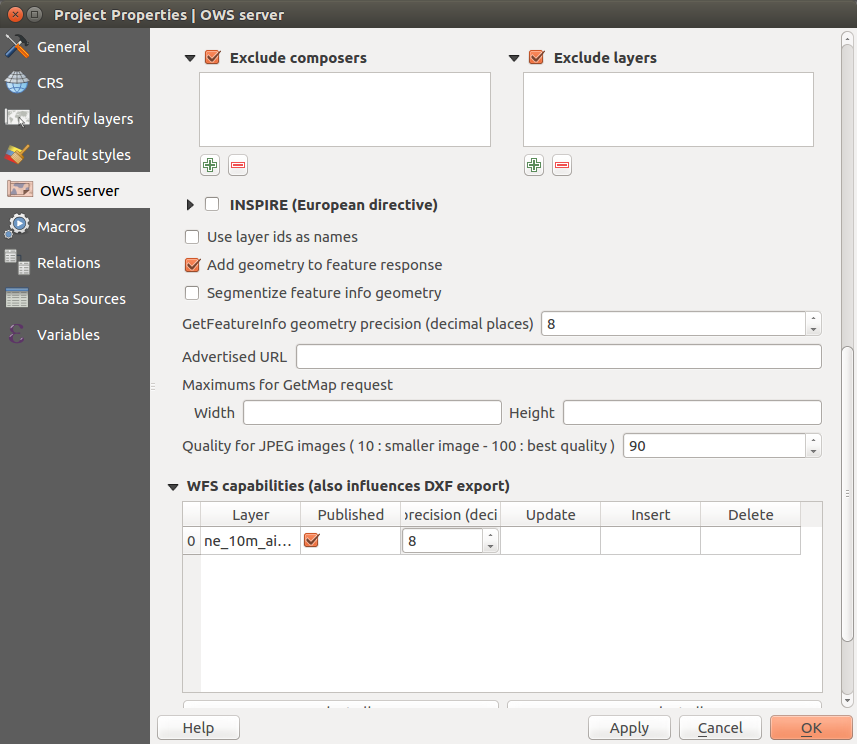
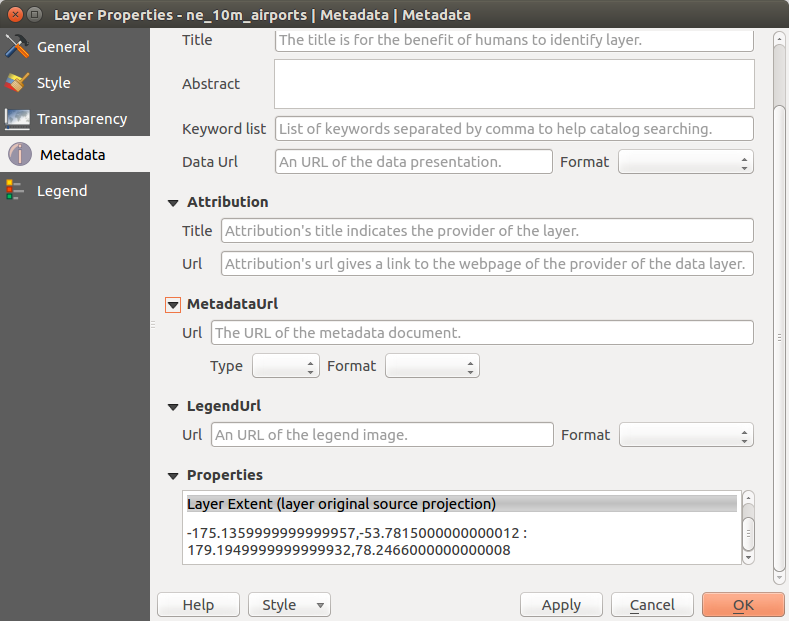
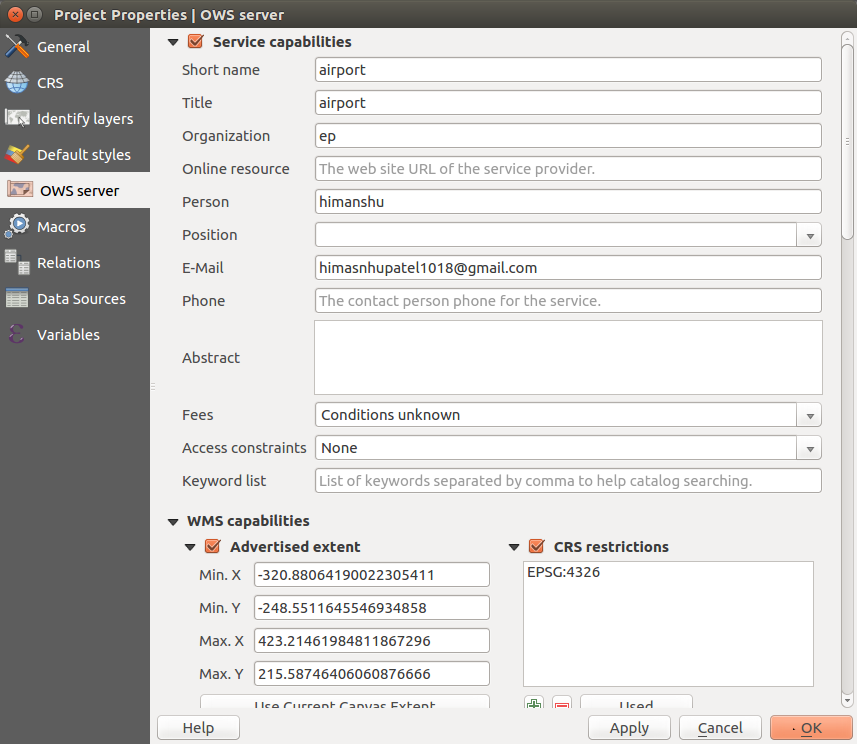 and here is the bottom portion of the Properties page.