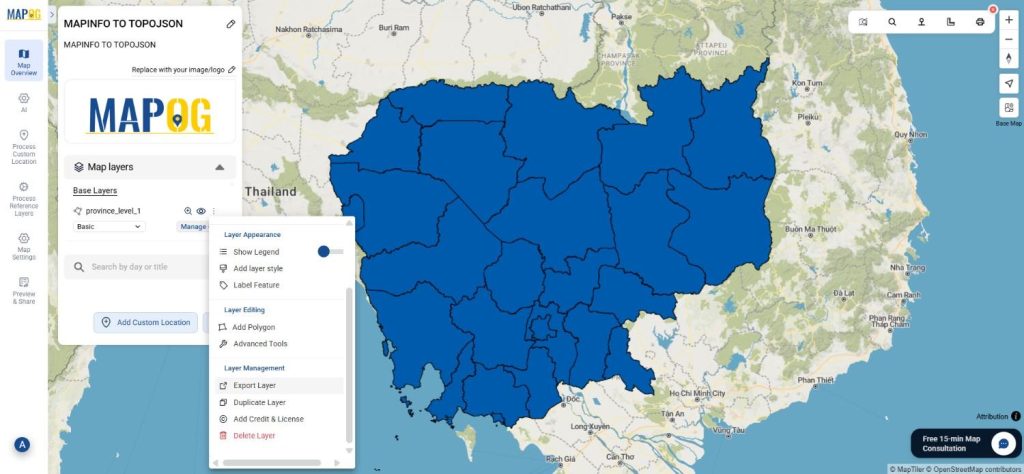
File conversion is the first phase of the GIS process, ensuring that data is suitable for usage in a variety of applications. The MAPOG Converter Tool makes this procedure with quick and simple data conversion between formats.
What is MapInfo File?
The geographic information system software MapInfo Professional uses a file format called a MapInfo file. You can use it to build and analyze maps, and it stores geographic data such as boundaries, points of interest, and maps. Environmental studies, urban planning, and other applications using spatial data frequently use it.
Online GIS Data Conversion
Key Concept for Conversion MapInfo to PDF:
An easy platform for converting data between different formats is provided by the Converter Tool in MAPOG. Because of this tool’s simple use, users of every level of skill may complete the converting procedure with ease. Here’s how to convert MapInfo files to PDF using MAPOG:
Step-by-Step Guide to Converting MapInfo to PDF
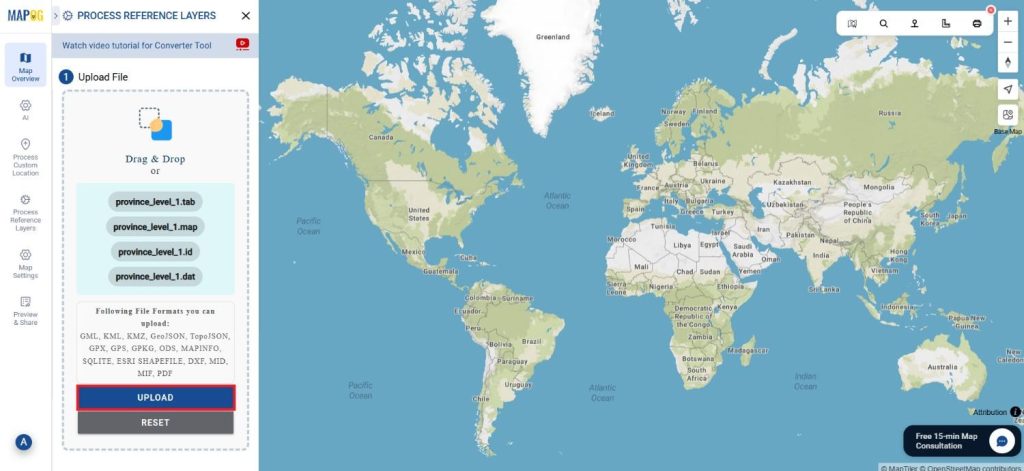
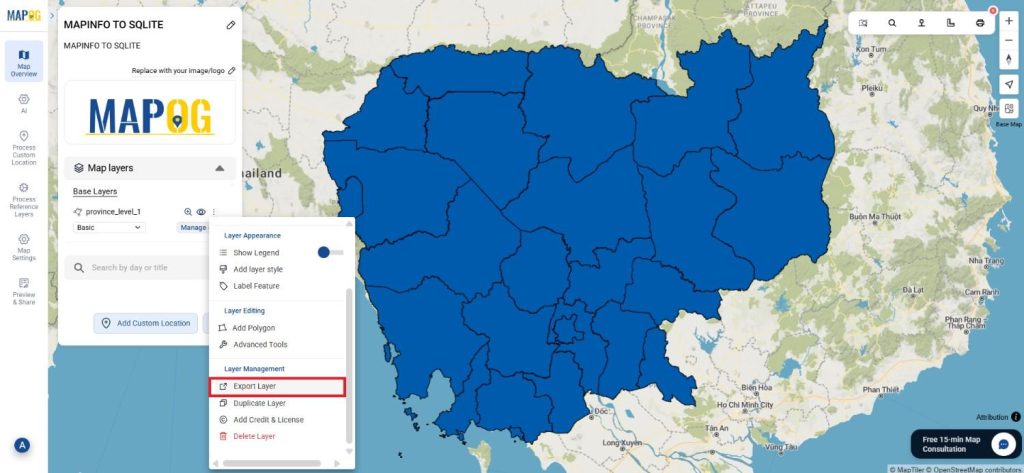
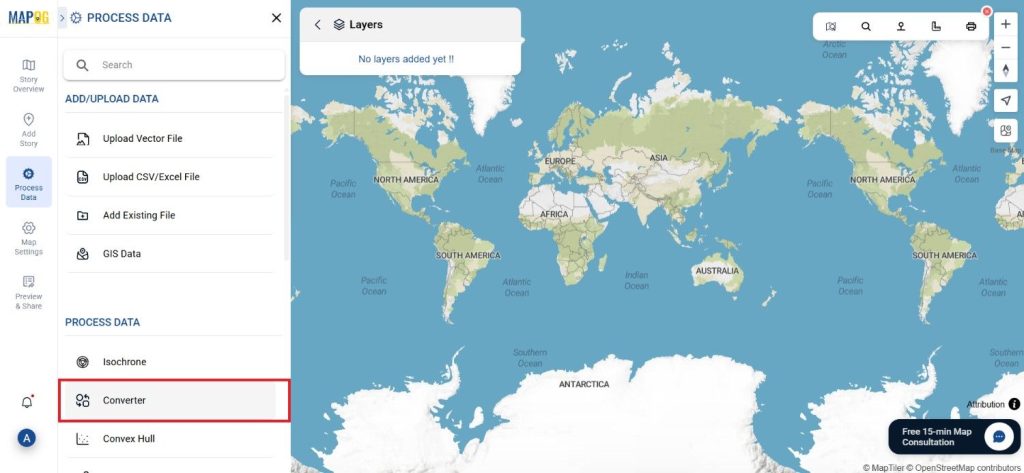
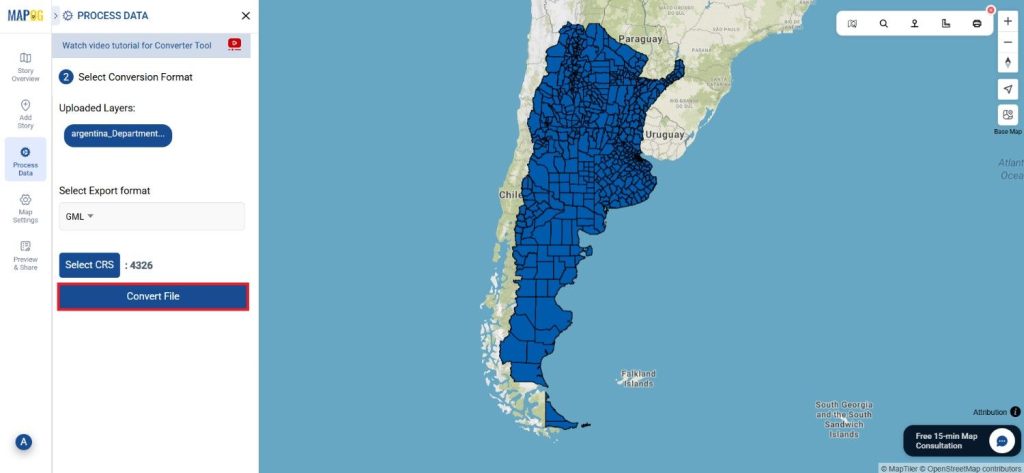
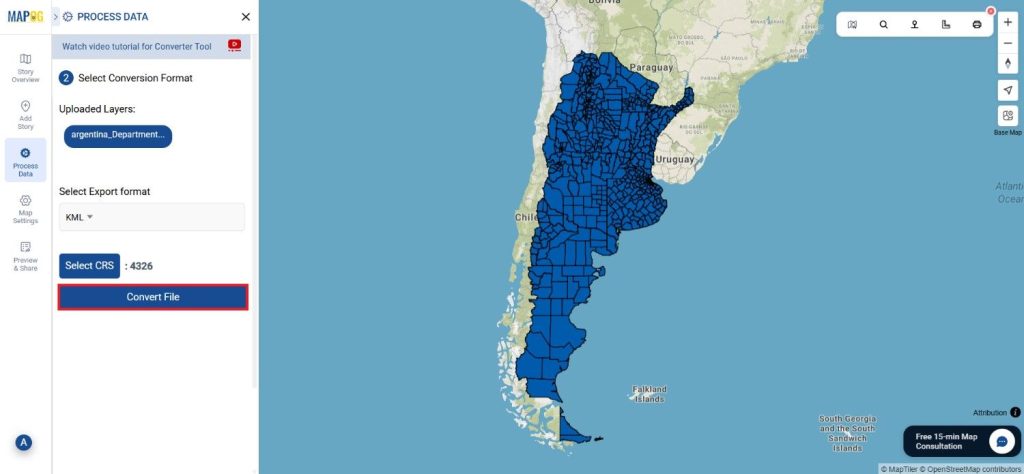
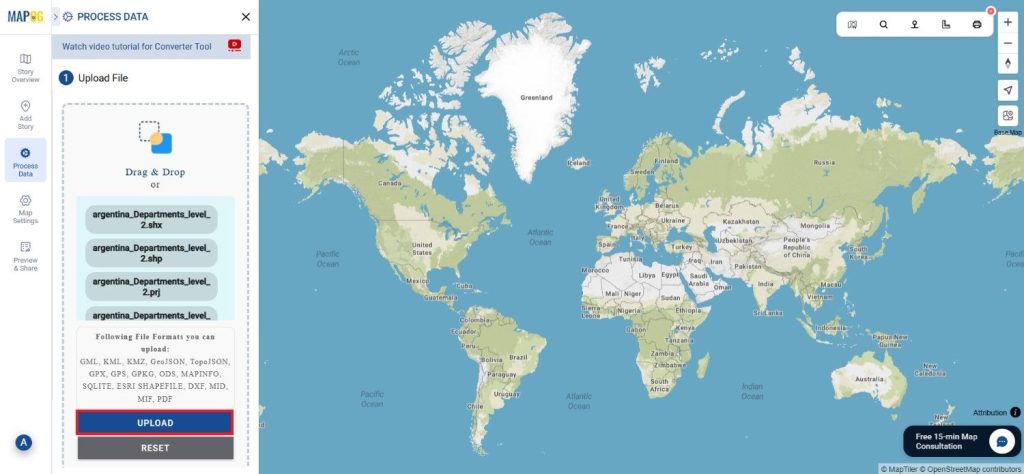
Step 1: Upload the Data
Open MAPOG and select the Process Data. Choose the “Converter Tool” menu item.

Prepare your MapInfo file for conversion before uploading it to the application.

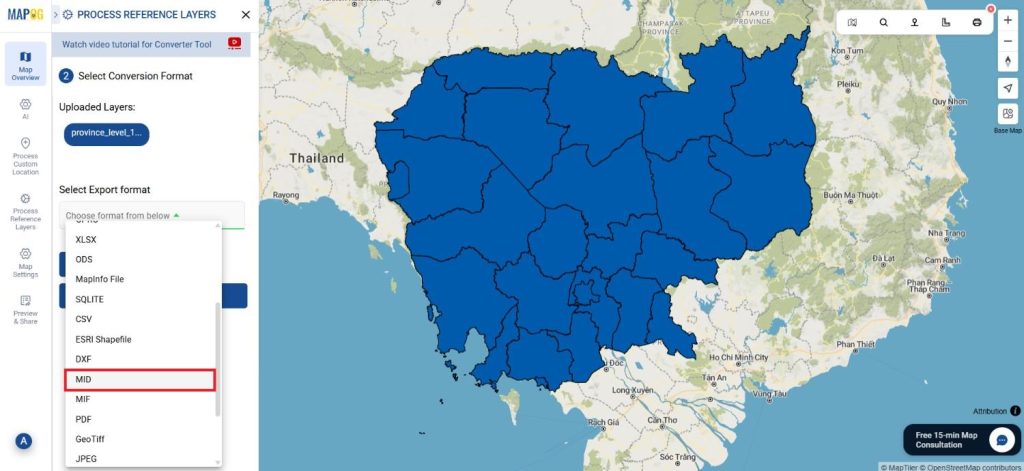
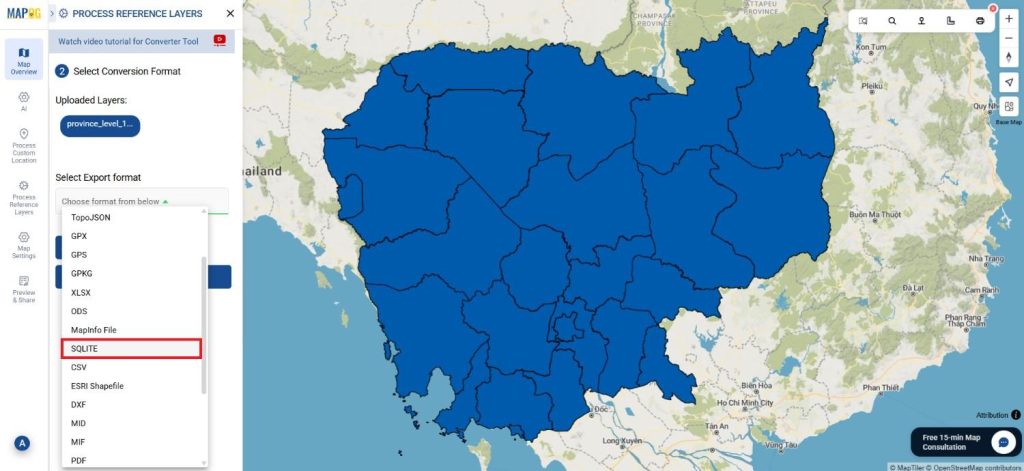
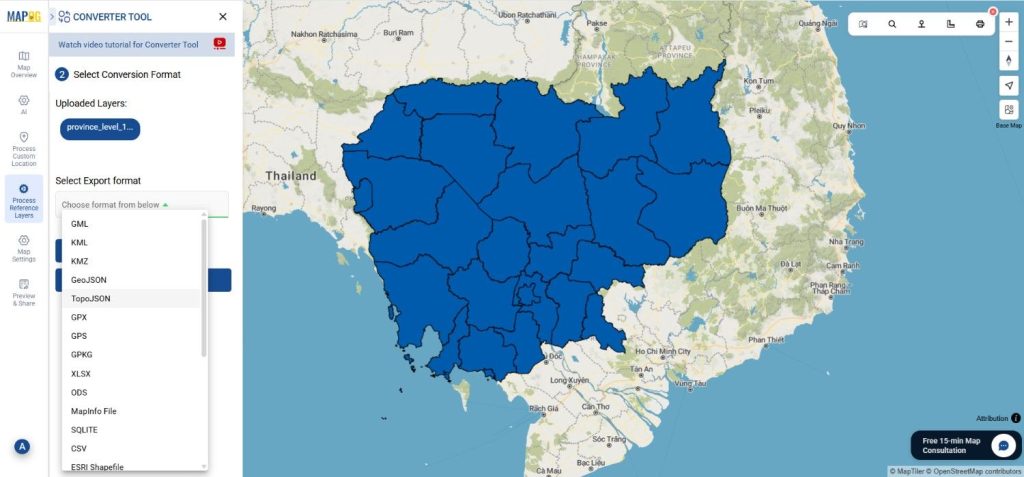
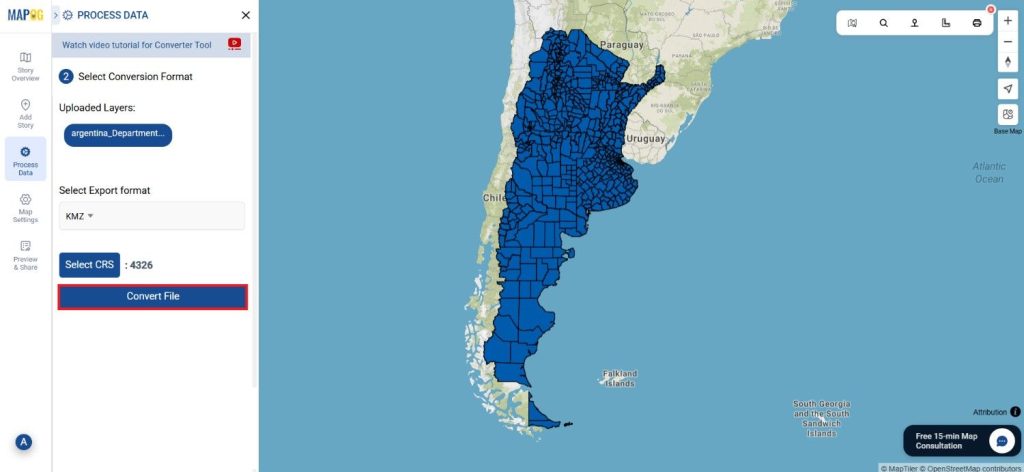
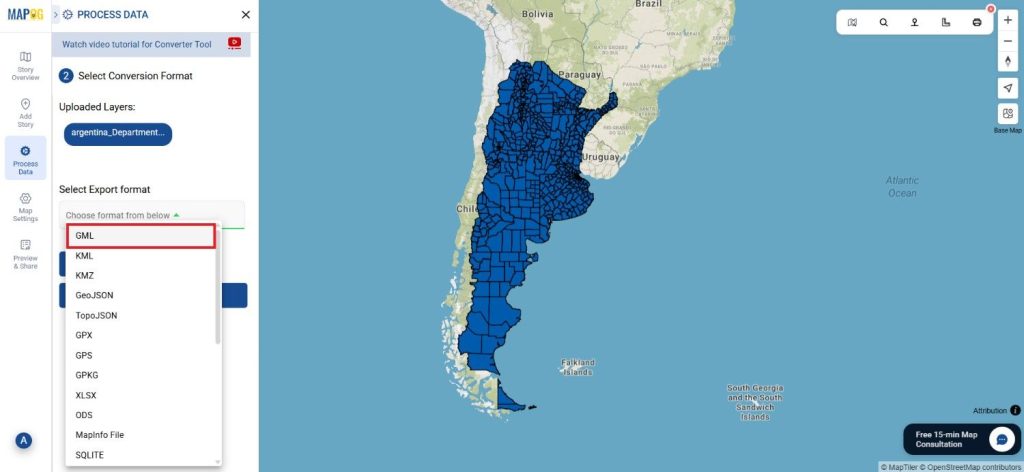
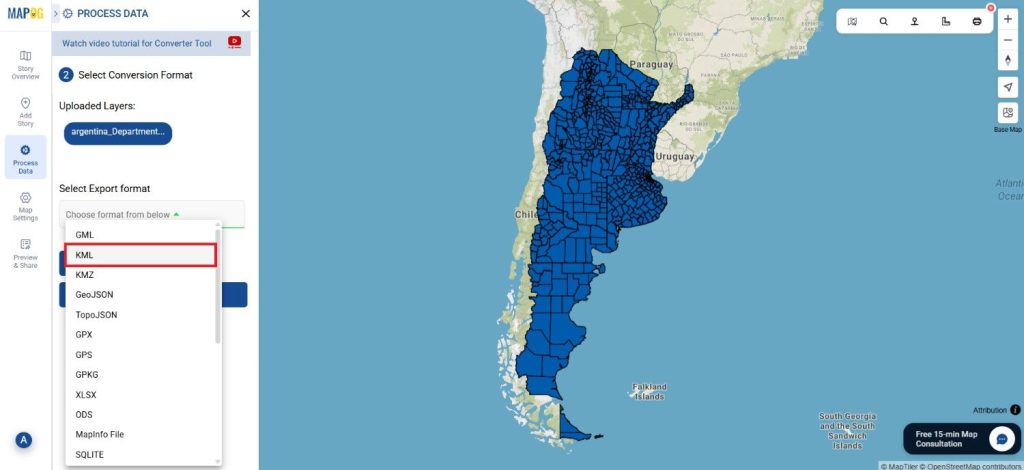
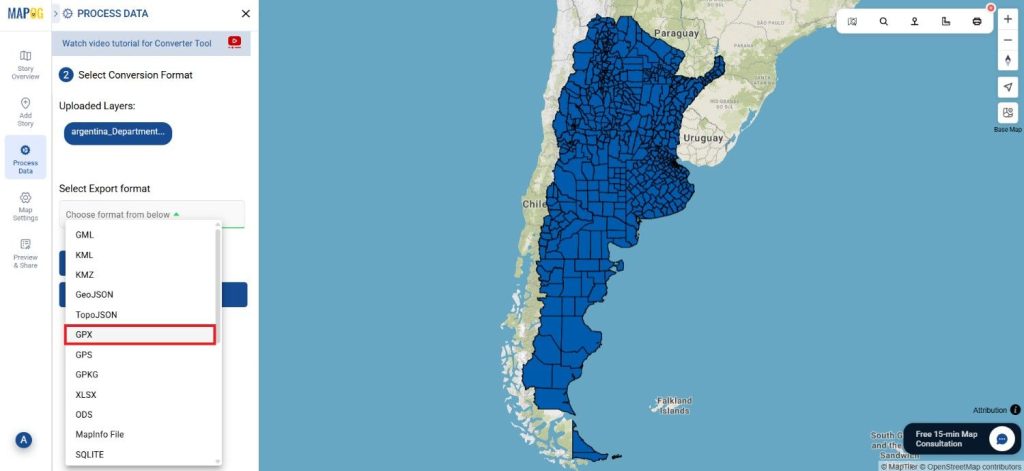
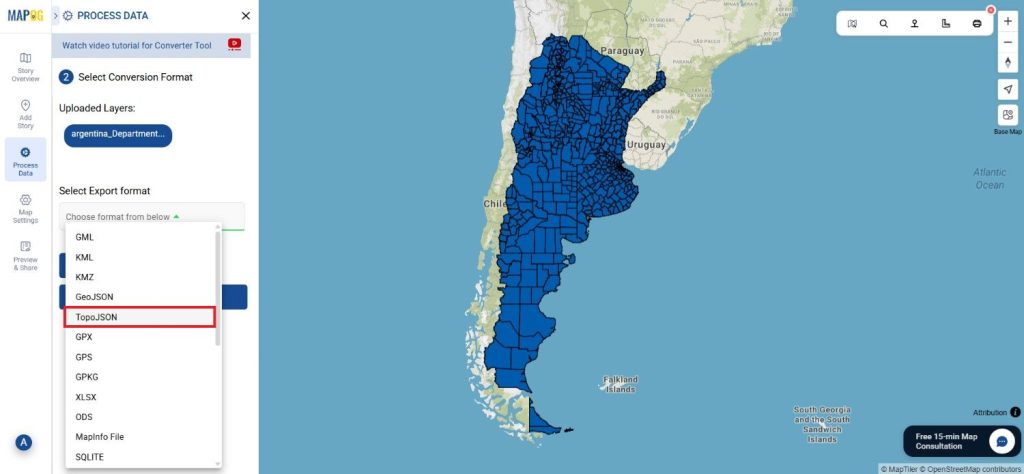
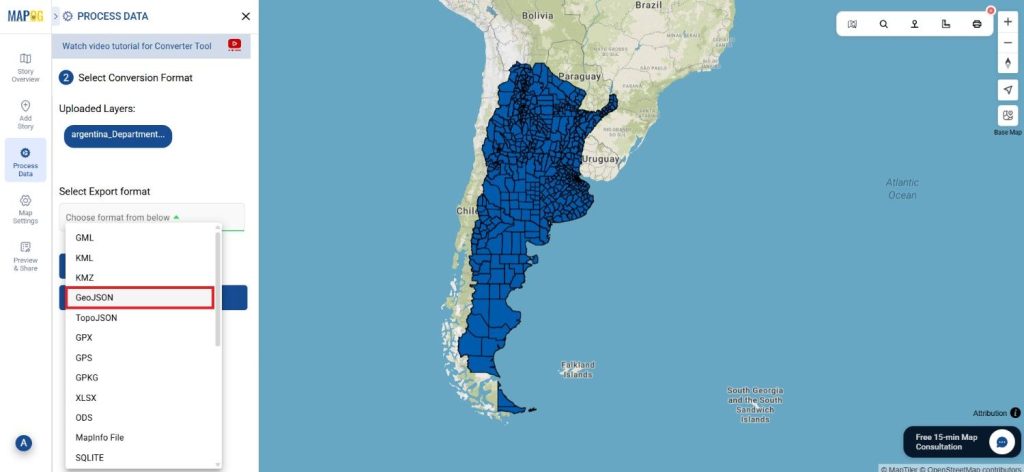
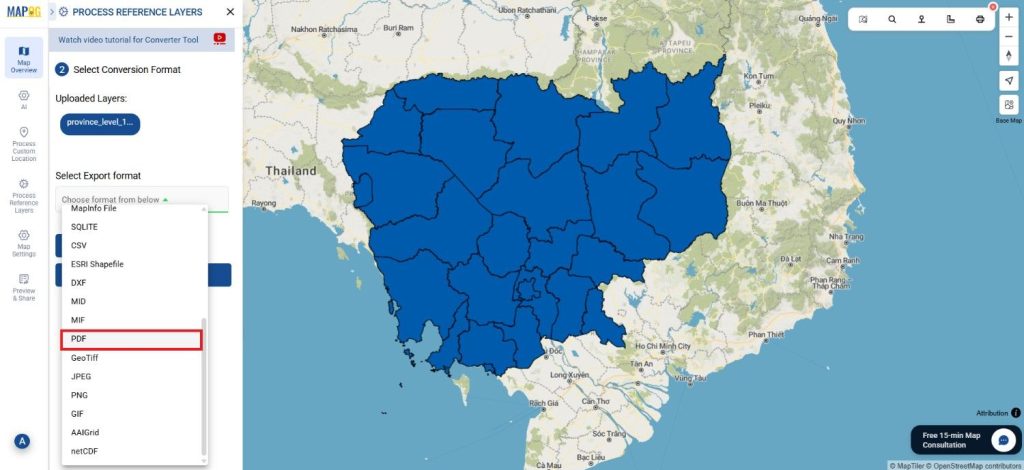
Step 2: Select the Format for Conversion
Next select PDF as the output format. In order to make the MapInfo file suitable for sharing and publishing.
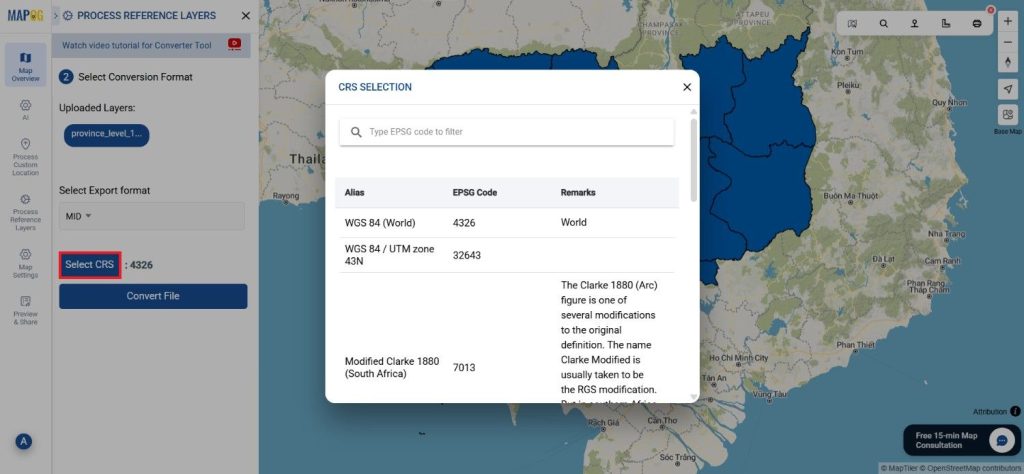
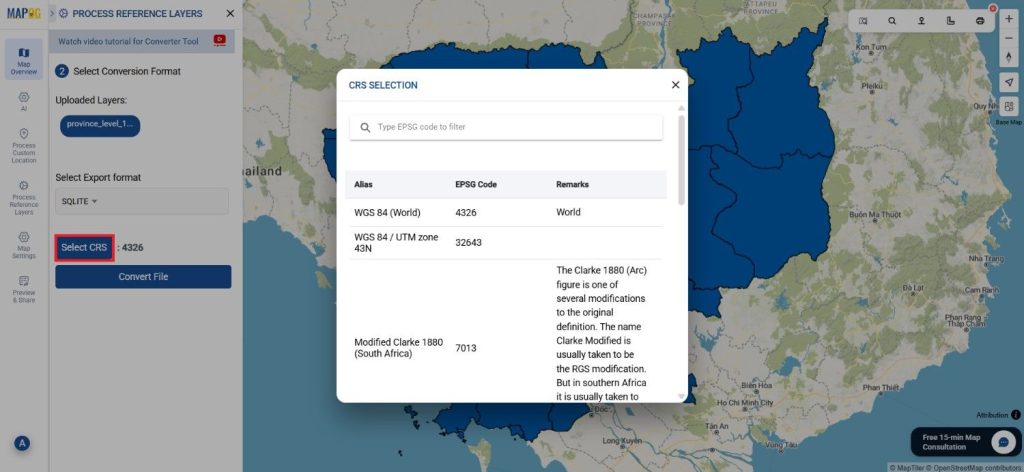
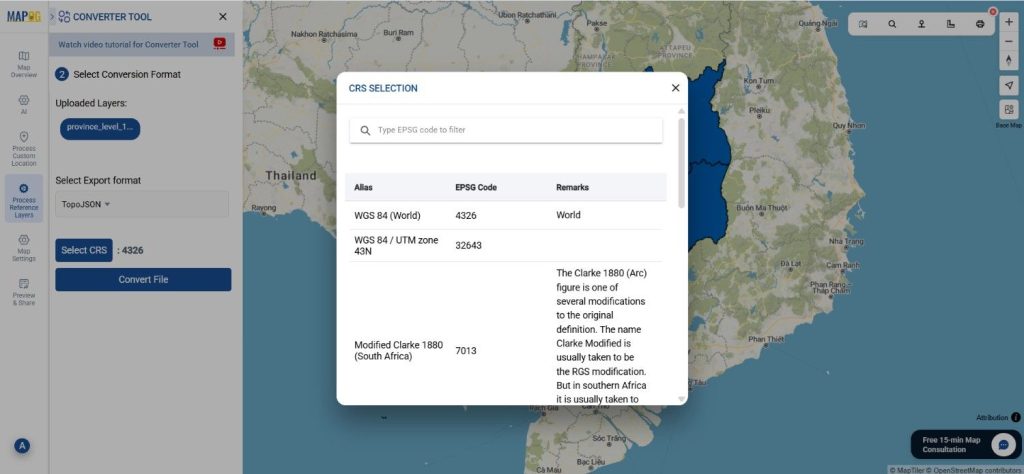
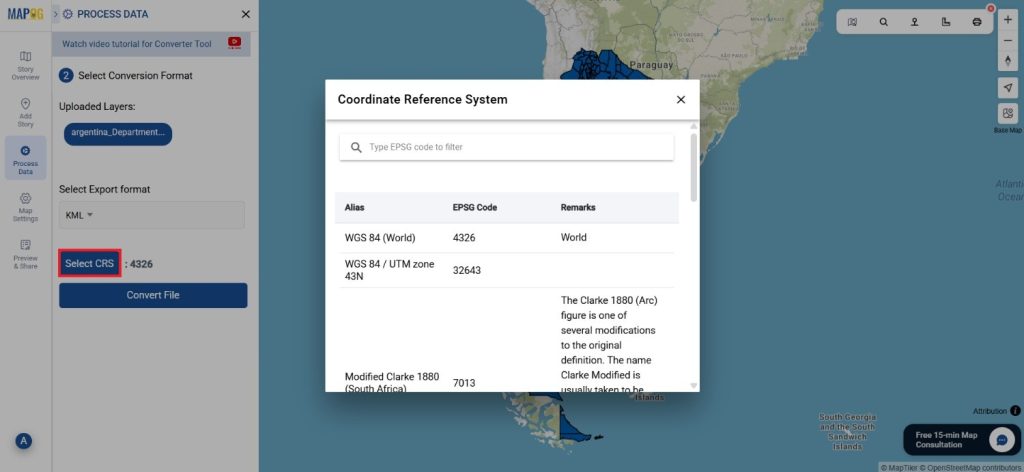
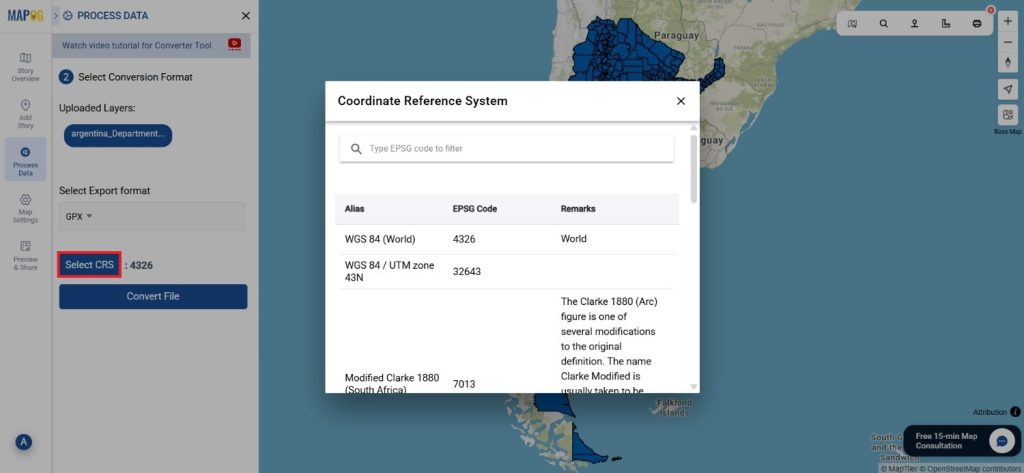
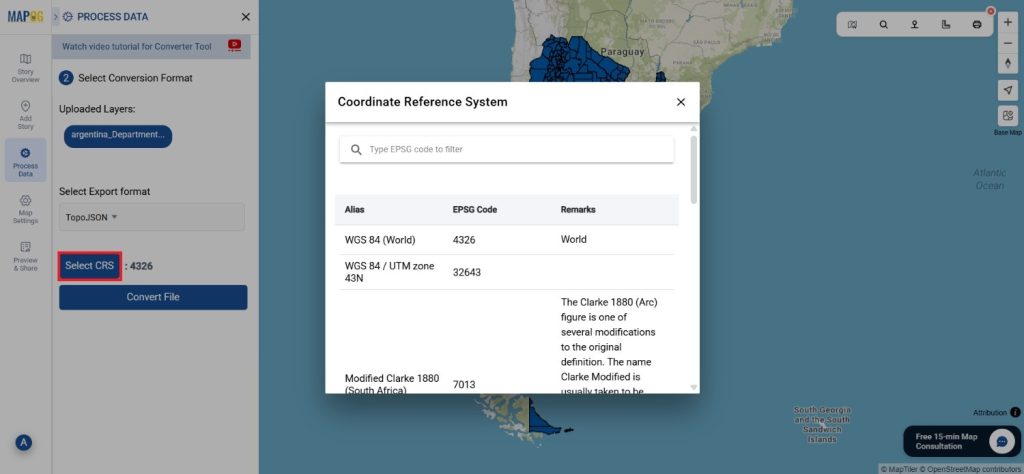
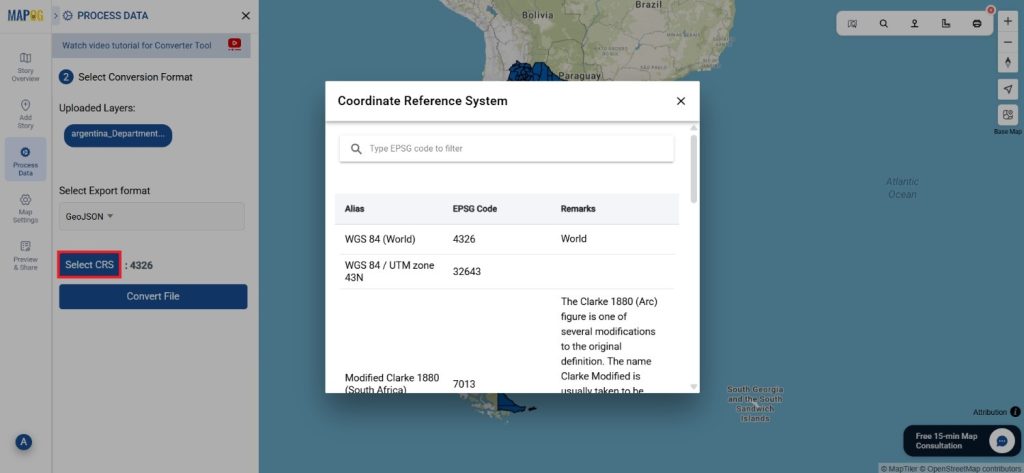
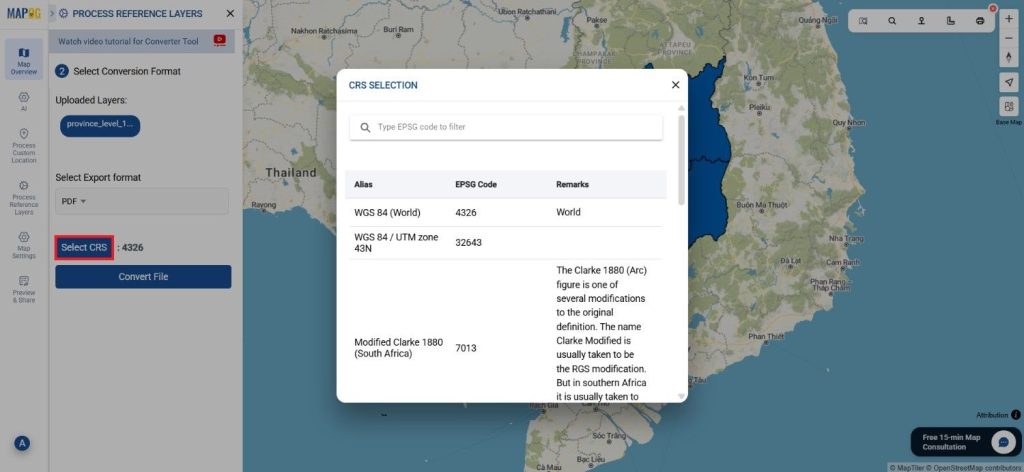
Step 3: Select the CRS
After getting the output of the PDF, choose the Output CRS.
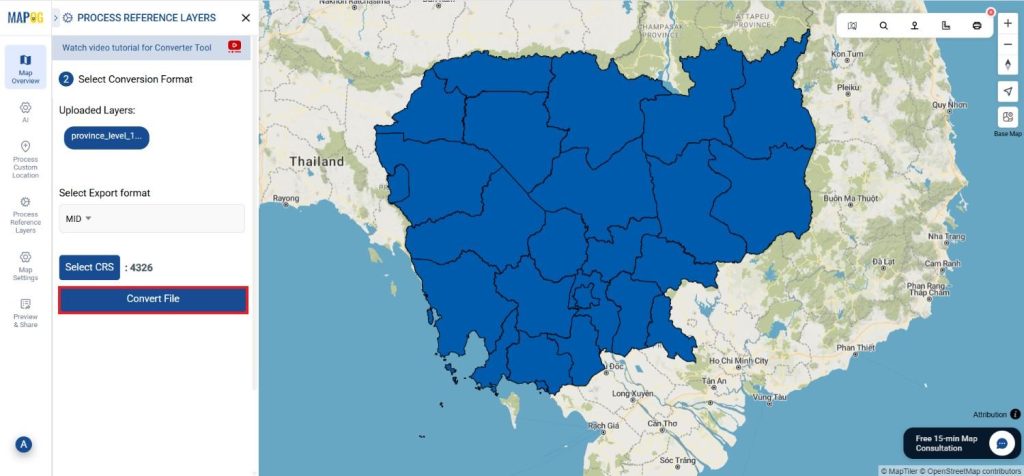
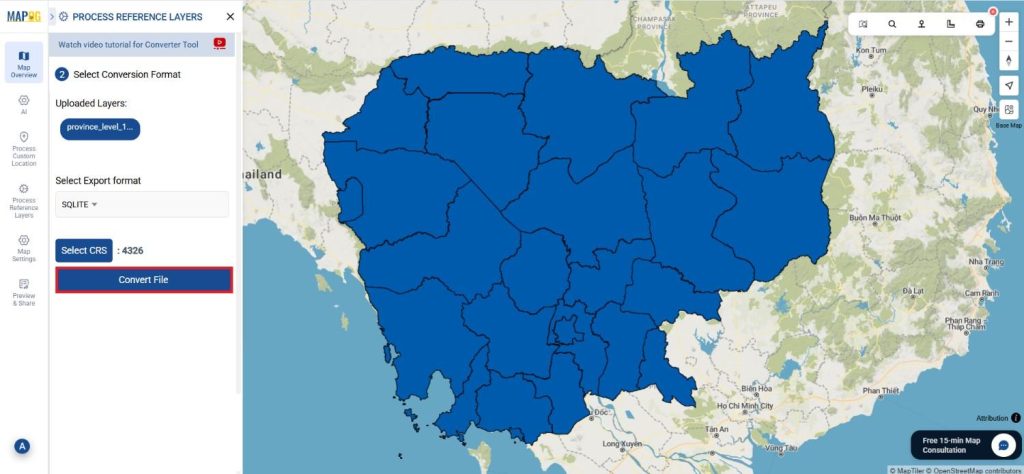
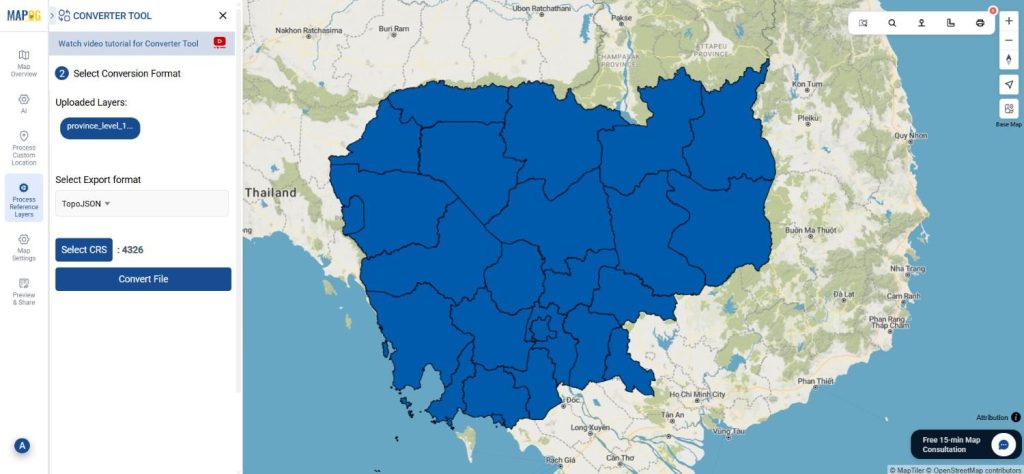
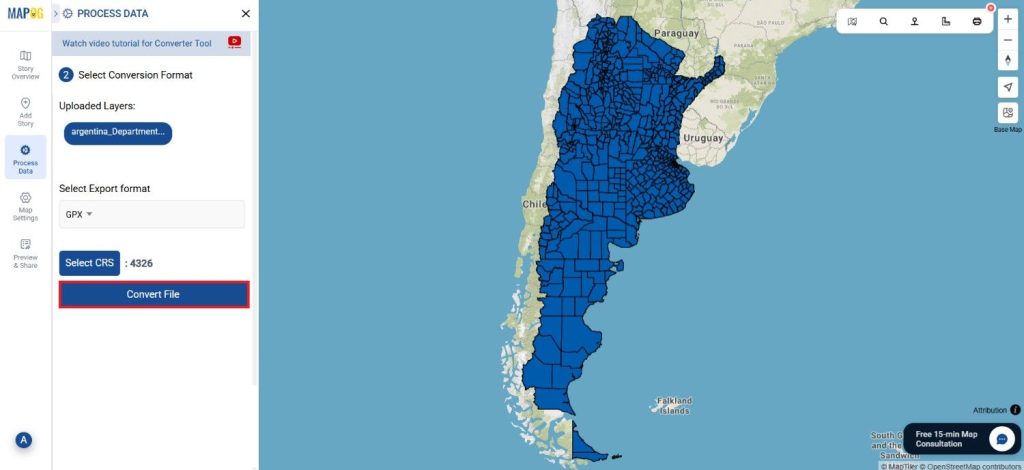
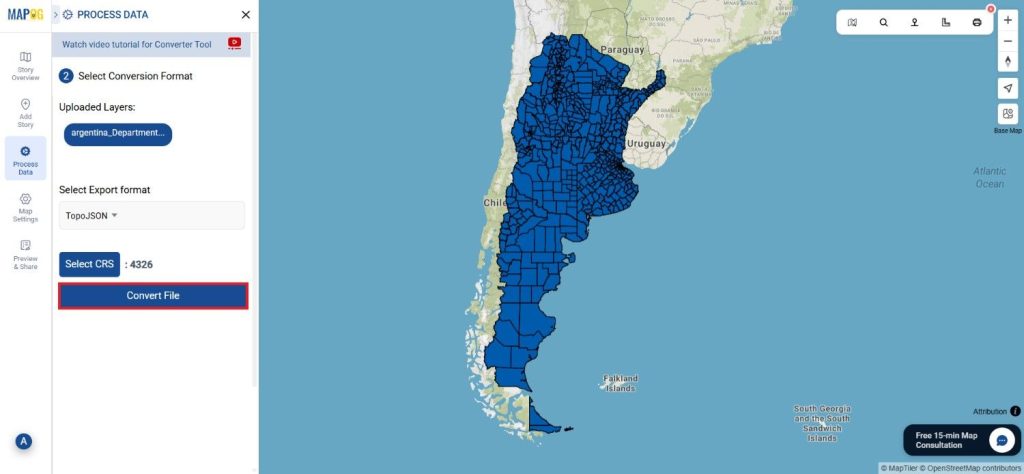
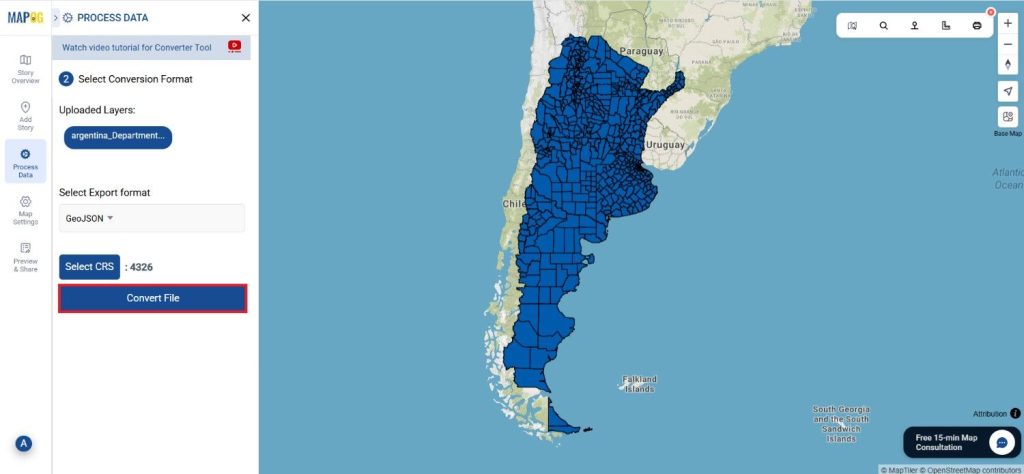
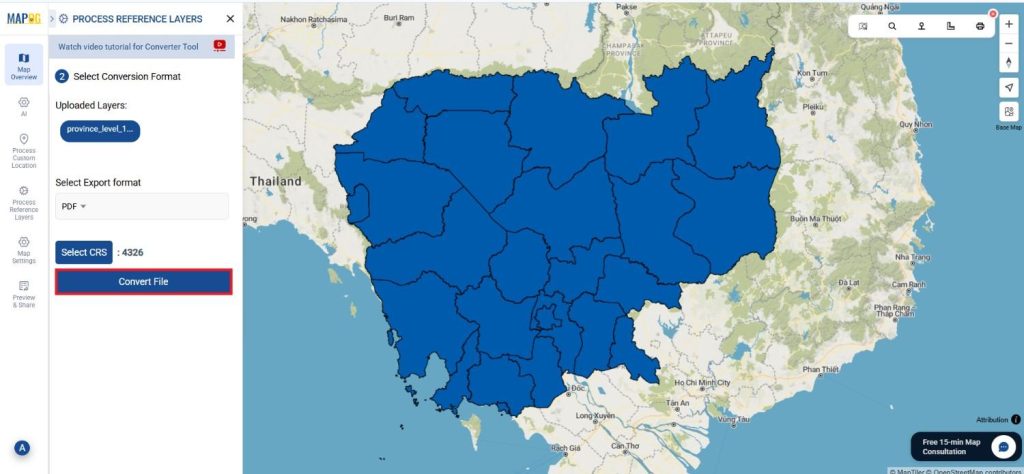
Step 4: Run the Conversion
Start the conversion process when you’ve chosen those options. The tool will process the MapInfo file and convert it into a PDF.
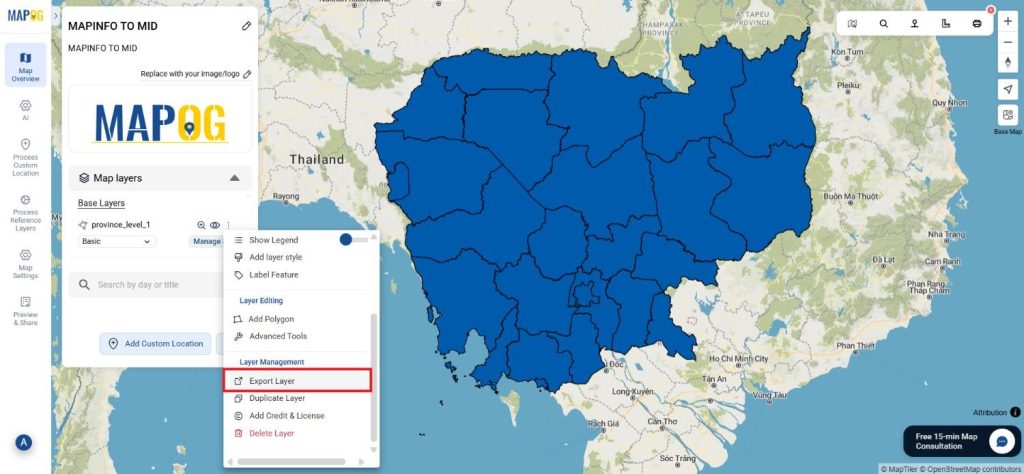
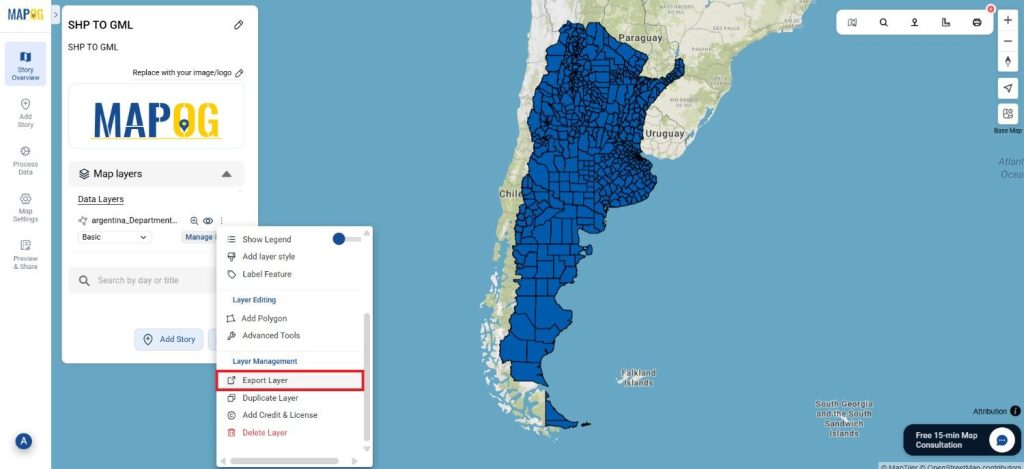
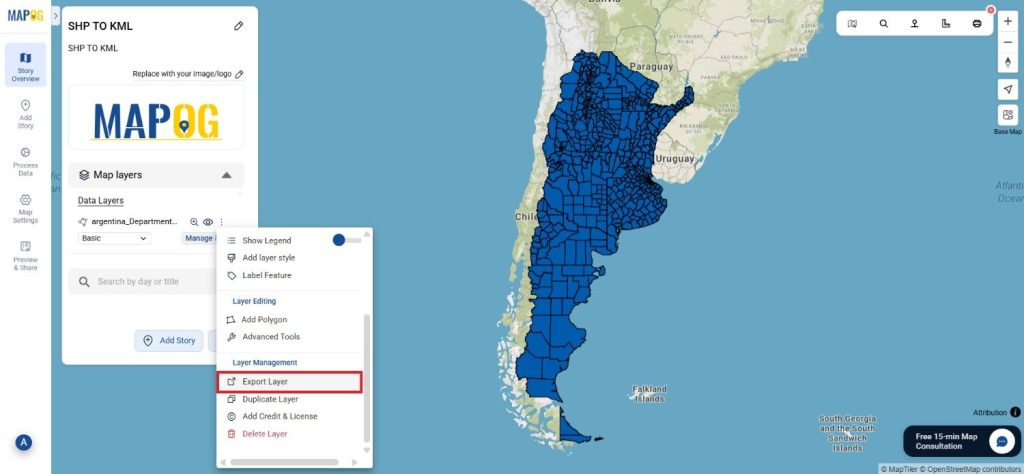
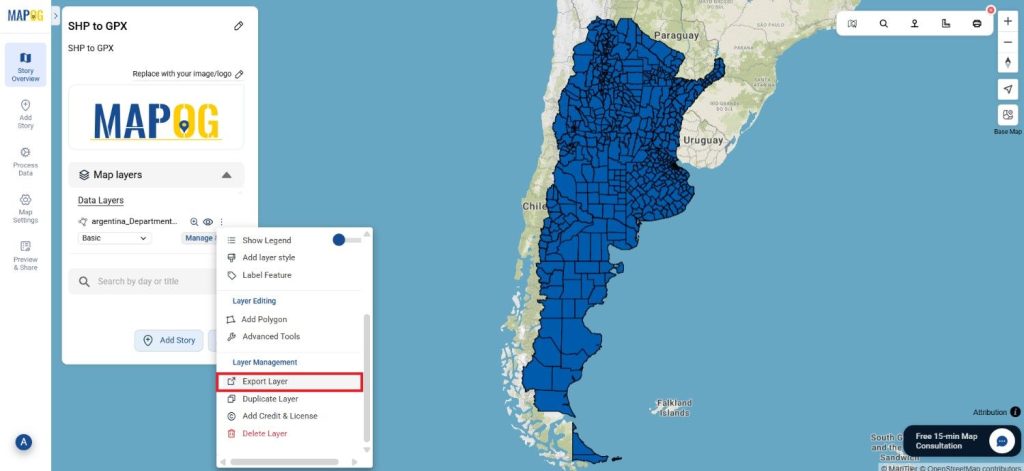
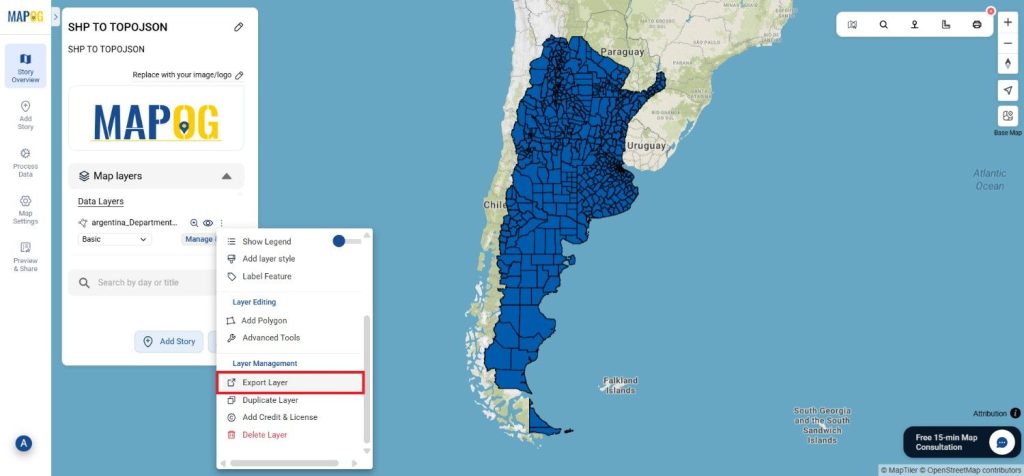
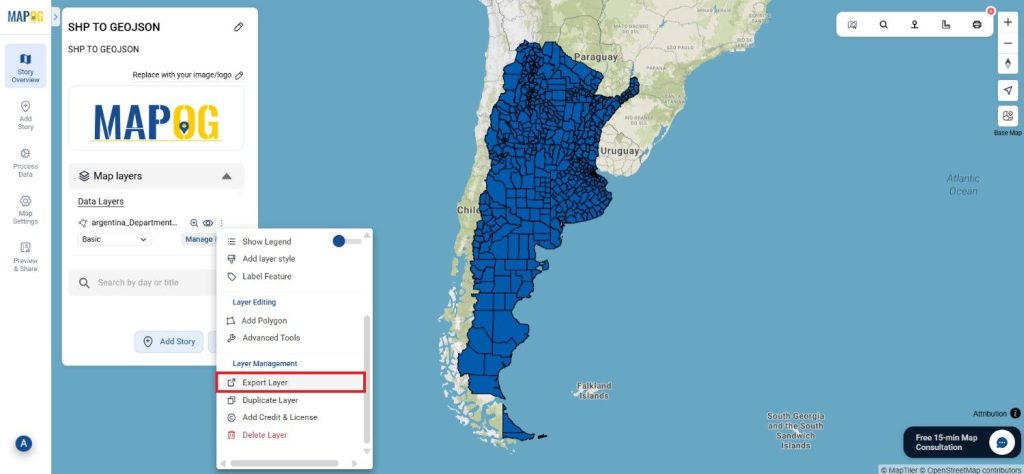
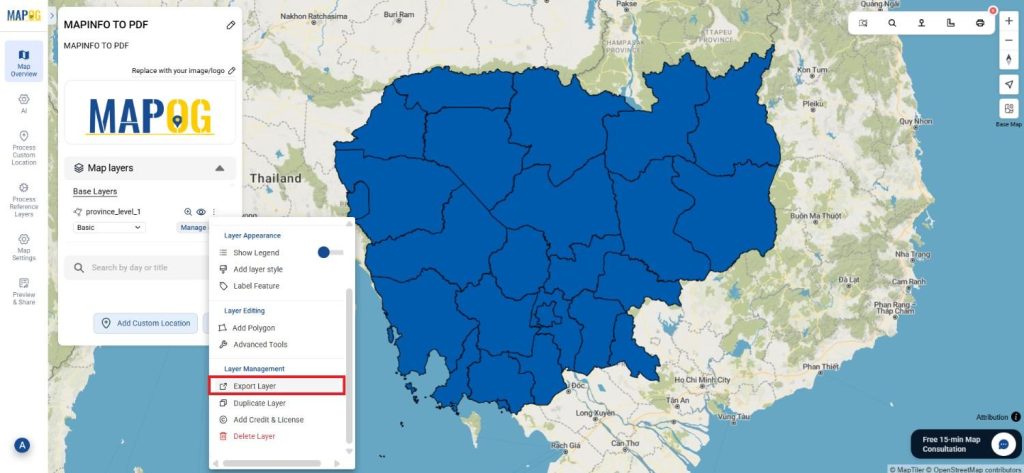
Step 5: Review and Download
Check the output once the conversion is finished to make sure the data was converted correctly. After you’re satisfied download the PDF version to use or share later.
Conclusion:
The MAPOG Converter Tool simplifies the process of converting data between various formats. You may quickly convert MapInfo files to PDF by following these easy steps, which will ensure that your data is prepared for many kinds of apps and simple sharing. If you need to download any data file in MapInfo or in any other formats like DXF, MIF, GML. Visit GIS DATA. Here we have 900+ data layers for 200+ countries.
Additional Tools for Further Analysis:
With MAPOG’s versatile toolkit, you can effortlessly upload vectors and upload Excel or CSV data, incorporate existing layers, perform polygon splitting, use the converter for various formats, calculate isochrones, and utilize the Export Tool.
Learn About MAPOG:
MAPOG is perfect for people who want to use visually striking and interactive maps to make their data come to life. It lets you build engaging narratives by connecting maps with visuals like text and images. Producing shareable content is made easy with MAPOG, whether you’re marketing a project, giving a tour or presenting research.
Here are some other blogs you might be interested in:
- Convert Online GIS data : KML to PDF file
- Converting KML to GeoTIFF , Online Gis Data Converter
- Converting KMZ to SHP : Online GIS Data Conversion
- Converting TopoJSON to SHP Online : GIS Data Converter
- Converting GeoJSON to TopoJSON with MAPOG
- Converting GeoJSON to CSV with MAPOG
- Converting KMZ to KML with MAPOG
- Converting GML to KML with MAPOG
- Convert KMZ to TopoJSON Online
- Converting KMZ to GeoJSON Online
- Convert KML to MID Online
- Online Conversion KML to MIF