Download Mauritius Administrative Boundary Shapefiles – National , Districts, Villages and More

download-mauritius-administrative-boundary-shapefiles-national-districts-villages-and-more

It’s fantastic to hear that MAPOG has expanded its GIS data collection to include data for more than 100 new countries, bringing the total coverage to over 150 countries. This is undoubtedly a valuable resource for GIS enthusiasts and professionals around the world. The availability of detailed information on administrative divisions, rivers, roads, and airports can greatly enhance various geospatial projects and analyses.

The option to access the data through tools like “Download GIS Data” and “Add GIS Data” seems convenient and user-friendly. Providing data in different formats such as Shapefile, KML, GeoJSON, and CSV ensures compatibility with a wide range of GIS software and applications, making it easier for users to integrate the data into their workflows.

This article will walk you through downloading administrative-level GIS data for Mauritius using the Download GIS Data tool. Experience a seamless geospatial journey with MAPOG as your trusted partner!

Note:

  • All data available are in GCS datum EPSG:4326 WGS84 CRS (Coordinate Reference System).
  • You need to login for downloading the shapefile.

Download Shapefile Data of Mauritius

Mauritius lies 2,000 km (1,200 mi) off the southeast coast of Africa, between latitudes 19°58.8’S and 20°31.7’S and longitudes 57°18.0’E and 57°46.5’E.

Mauritius National Boundary

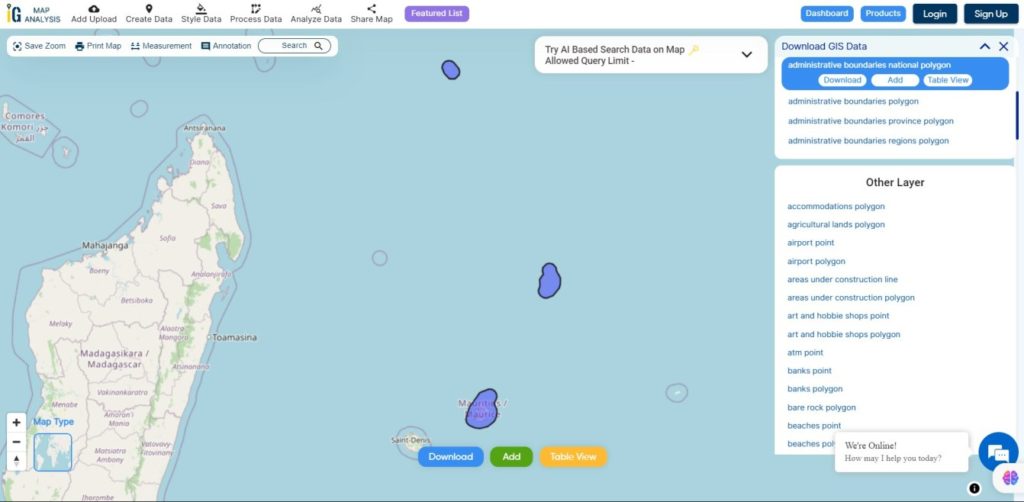
Download Mauritius National Boundary Shapefile

Download Mauritius Districts Shapefile Data

Mauritius is divided into 9 Districts

  • Flacq
  • Grand Port
  • Moka
  • Pamplemousses
  • Plaines Wilhems
  • Port Louis
  • Riviere du Rempart
  • Riviere Noire
  • Savanne
Mauritius Districts Boundaries

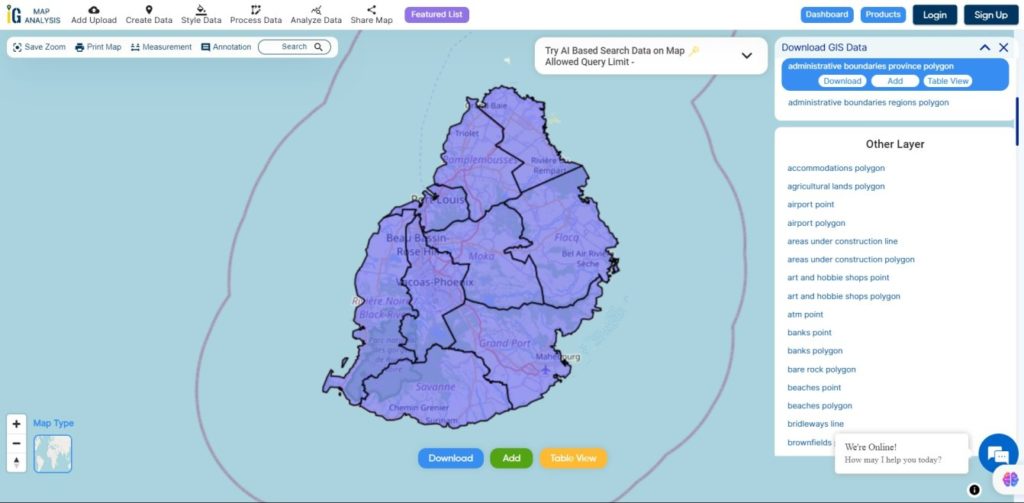
Download Mauritius Districts Boundaries Shapefile

Download Mauritius Village Shapefile Data

Mauritius is divided into 88 Villages

Mauritius Villages Boundaries

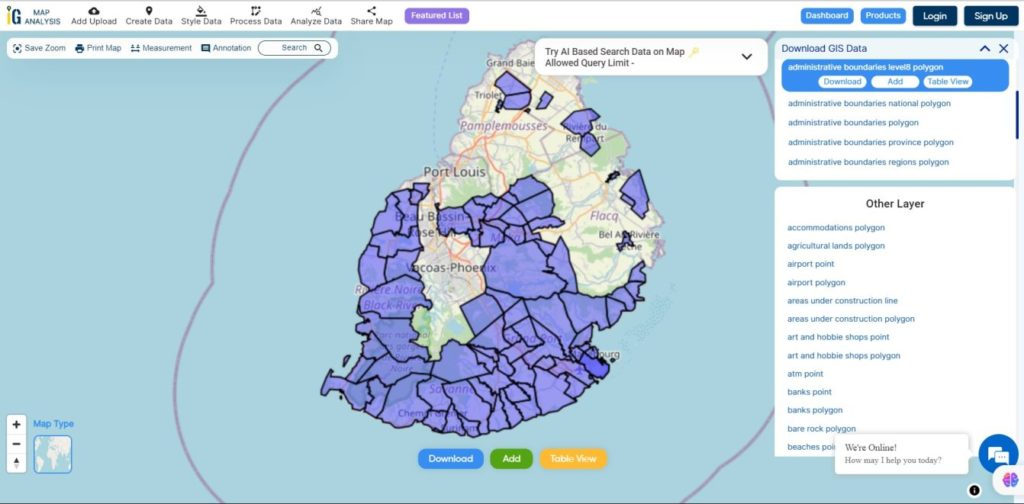
Download Mauritius Villages Boundaries Shapefile

Other GIS Data:

Download Free Shapefile for the following:

  1. World Countries Shapefile
  2. Australia
  3. Argentina
  4. Austria
  5. Belgium
  6. Brazil
  7. Canada
  8. Denmark
  9. Fiji
  10. Finland
  11. Germany
  12. Greece
  13. India
  14. Indonesia
  15. Ireland
  16. Italy
  17. Japan
  18. Kenya
  19. Lebanon
  20. Madagascar
  21. Malaysia
  22. Mexico
  23. Mongolia
  24. Netherlands
  25. New Zealand
  26. Nigeria
  27. Papua New Guinea
  28. Philippines
  29. Poland
  30. Russia
  31. Singapore
  32. South Africa
  33. South Korea
  34. Spain
  35. Switzerland
  36. Tunisia
  37. United Kingdom Shapefile
  38. United States of America
  39. Vietnam
  40. Norway
  41. Chile
  42. Croatia
  43. Estonia
  44. Laos
  45. Hungary
  46. Libya
  47. Comoros
  48. Colombia
  49. Bhutan
  50. Maldives
  51. Iraq
  52. Azerbaijan
  53. Portugal

Disclaimer : If you find any shapefile data of country provided is incorrect do contact us or comment below, so that we will correct the same in our system as well we will try to correct the same in OpenStreetMap.

Query GIS Data – IGIS Map Tool – Now known as MAPOG

To Query GIS Data easily with IGIS map tool, we can use the Query tool.  A GIS query tool, or selection tool as it is often know, allows us to filter a dataset based on criteria that we define.

Querying in IGIS Map Tool allows user to explore your data with rule based queries. User can discover their features of interest contained within the map by querying. IGIS Map tool allow users to build their own queries that we may not have envisaged when we first created the map. It also query GIS data according to their choice.

Query GIS Data – MapOG Tool

Query tools allow maps users to do more than what the map maker envisioned when they styled the layers. Here are the few steps to be followed for querying the map.

Query GIS data

  • Upload dataset and create a new map project Or Open your existing map project.
  • Or Download GIS data for analysis

Query GIS Data

  • Select the “Query tool” option on the Analysis Section.

  • Select the Layer to query GIS data.

Query GIS Data

All the layers in your map are available in this section, you just need to select the layer in which you want to query in.

  • Confirm a shape i.e. circle , rectangle or polygon to draw a query.

User just need to select the shape and start drawing the shape on the map to query the data. similarly as above image shows the queried data as highlighted which is queried by a rectangle.

  • Click on the Get result button after drawing the shape. You can view the result in as tables and also download them as CSV Format.

Query GIS Data

This is how you can Query GIS Data with the IGIS Map Tool in a minute. Query tools allow maps users to do more than what the map maker envisioned when they styled the layers.

IGIS Map Query Tool can be used in various sectors like Insurance, Banking, Risk Management etc. There are also other query tools available in the market.  mapOG tool however, is a much better choice to Query GIS Data if you want to share your maps with a larger, more distributed audience.

This may help you to Query GIS Data with IGIS Map Tool. If you find any problem in creating one such example do let us know by commenting below.

GIS for Agriculture – When and Why

Agriculture plays a very vital role in everyone’s life. For few agriculture is not the only way of having food in their plate, rather a source of income. We get food from agriculture, one can not imagine his life without agriculture. Agriculture brings food in our plate, hence the agriculture needs to be proper care taken of. Care of Agriculture depicts the farming according to the nature of the soil, land and water.

Say for an example, some staples are grown in the plateau regions, but can not be grown in plain area. There are various kind of agriculture activities, but the main part of agriculture is to decide where to do farming, and what to grow. Deciding on this is really a very crucial task. So, we have something which can assist you with this decision taking. That is GIS. GIS is helping people in every field, then why not agriculture. Yes, You read it right, GIS can assist in agriculture also. Lets see how GIS is helpful in Agriculture?

Benefits of GIS Maps  in agriculture

GIS is beneficial to every one in every segment. Hence, it is beneficial for agriculture also. It provides agriculture with below mentioned benefits :

Lets see how GIS Maps provides with above mentioned benefits in agriculture.

GIS FOR AGRICULTURE
GIS FOR AGRICULTURE

Climate Conditions

Climate is a variable that varies from region to region and sometimes within a region. As we know that Climate plays a vital role in agriculture sector, hence it is a necessity to give a proper and required focus on climate while planning for any farming or agricultural activity. Hence one can not easily find out the climate of a particular reason, as climate is made up of few factors like water,air sunlight. So, in such cases GIS maps can help in forecasting the climate of any region for farming anything. It would also help to let us know whether that crop can be grown in that particular region or not, with the help of GIS maps.

Know land type

No agriculture is possible without land, and no successful agriculture is possible without knowing the land type. Yes, As we know that land is an essential resource for agriculture but it is of no use if one does not know the land type of a region, as one can not grow a crop in deserted regions, which is mean to be grown in plateau regions. So, to identify a land type GIS maps are a must. GIS maps will help a person in finding out the Land type of a region for better results, One can easily mark those regions on GIS maps.

Water Supply

For growing the crops it is necessary to have water. We can not imagine our life without water, neither Can agriculture. So, to find out the water supply in a region we need to know the source of water of that region. That source can easily be find out With the help of GIS maps. GIS maps are the main source of information, of the factors of agriculture. You can easily identify the water bodies located near to a region and can accumulate the supply of water in that region.

Drought

Drought occurs because of the lack of water or rain. When there is no rain there will be no crops and food. Hence it is very important to know the drought prone  regions, as to secure yourself from investing in such place where you might face some loss. So, GIS maps can help you find out those drought prone regions, on the basis of the previous data and GIS maps. With GIS maps you can get the details of the region which are drought prone.

These are the benefits one can receive from GIS maps for Agriculture. Use GIS maps for Telecom, BCP, Logistics, Medical industry and last  but not the east Agriculture. If you know any more benefits of GIS For agriculture, do let us know by commenting below in the comment box of GIS For agriculture article.