An earthquake (also known as a quake, tremor or temblor) is the shaking of the surface of the Earth, resulting from the sudden release of energy in the Earth’s lithosphere that creates seismic waves. Earthquakes can range in size from those that are so weak that they cannot be felt to those violent enough to toss people around and destroy whole cities. The seismic or seismic activity of an area refers to the frequency, type and size of earthquakes experienced over a period of time.
Earthquake is a nature’s most unpredictable and one of her most devastating natural disasters. When high intensity earthquakes strike they can cause thousands of deaths and billions of dollars in damaged property. For decades, experts have studied major earthquakes; most have focused on fatalities and destruction in terms of the primary effects, the shaking unleashed.
At the Earth’s surface, earthquakes manifest themselves by shaking and sometimes displacement of the ground. When the epicenter of a large earthquake is located offshore, the seabed may be displaced sufficiently to cause a tsunami. Earthquakes can also trigger landslides, and occasionally volcanic activity.
Worldwide, at least 133 earthquakes occurred in 2011, during which people died, were injured or lost their homes or which caused immense damage to property.
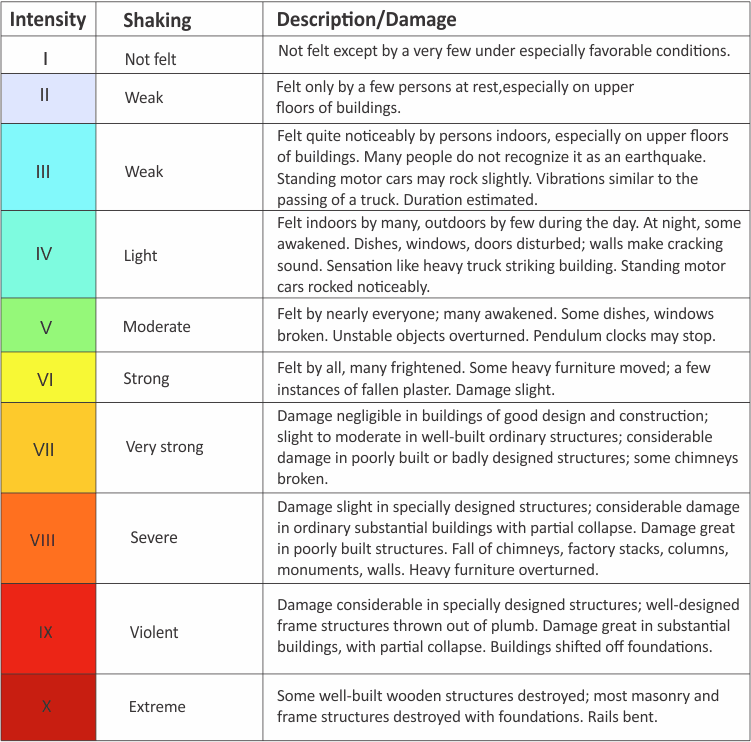
The intensity value of earthquake is divided in 9 parts as given below
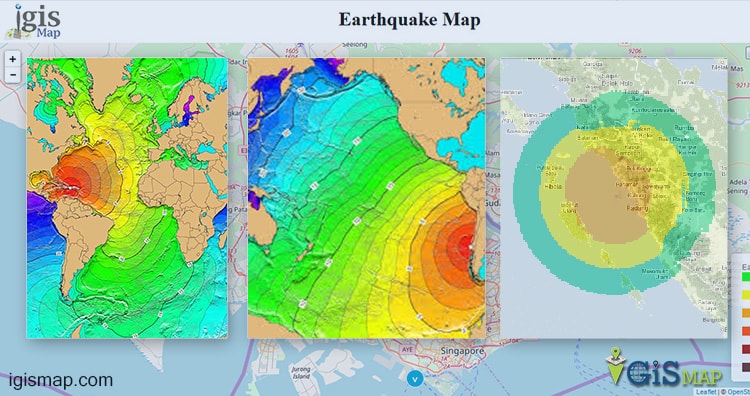
About Demo-
Earthquake information of Padang, Indonesia is shown using raster Geo-tiff file. Padang is the capital of the province of West Sumatra in Indonesia. The intensity of earthquake on map can be represent by color variation from dark to light shade. Here dark shade shows high shocks and light color medium and low shocks. These intensity value can be extract from layer using Grey band information.
Data Preparation:
This demo shows the raster overlay on map with the help of Leaflet JavaScript library. Here raster data is in Geo Tiff format and is published on Geo server. For this demo we have downloaded data from http://geonode.inasafe.org/layers/geonode:padang_eq_2009_wgs84 website. It is a raster data containing single Grey band. In this demo we render raster data on map and shown the value of earthquake intensity using pop-up on marker.
Raster data on GeoServer and styling:
GeoServer is an open source server for sharing geospatial data in both vector and raster format. It is designed to host major data sources, which can easily render on maps.
To Download and install GeoServer please follow the last article. Then login to the GeoServer and publish data on the Geoserver and get the link from layer preview section. You can visit the articles to know how to publish and style the GeoTiff file on Geoserver.
Render Raster on Map:
Before rendering tiles on map, you need to create a division in html that will contain map. You also can set its view by providing center latitude and longitude with zoom level.
var map = L.map(‘map’).setView([-1.03705, 99.64336],8);
var searchLayer ;
L.tileLayer(‘http://{s}.tile.osm.org/{z}/{x}/{y}.png’, {
attribution: ‘© <a href=”http://osm.org/copyright”>OpenStreetMap</a> contributors’
}).addTo(map);
To render this data on map, we need to get the data from GeoServer, which can be done by using leaflet javascript library. In the Leaflet library we have Leaflet-WMS plugin.
What is WMS service: WMS (web map service), is a way of publishing maps. This format is similar to map tiles. A WMS image is defined by the coordinates.
For styling purpose we have used geoserver styling option, where you can style your data according to your attributes or bands etc.
NamedLayer – name of the layer.
<FeatureTypeStyle>
<Rule>
<Name> RUle style </Name>
<Title>Opaque Raster</Title>
<Abstract>A raster with 100% opacity</Abstract>
<RasterSymbolizer>
<Opacity>1.0</Opacity>
<ChannelSelection>
<GrayChannel>
<SourceChannelName>1</SourceChannelName>
</GrayChannel>
</ChannelSelection>
<ColorMap extended=”true”>
<ColorMapEntry color=”#00FA08″ quantity=”0″/>
<ColorMapEntry color=”#F6FA00″ quantity=”2″/>
<ColorMapEntry color=”#FA9F00″ quantity=”3″/>
<ColorMapEntry color=”#FA4C00″ quantity=”6″ />
<ColorMapEntry color=”#A21612″ quantity=”9″/>
</ColorMap>
</RasterSymbolizer>
</Rule>
</FeatureTypeStyle>
L.tileLayer.wms:
It provides a simple interface for loading tiles from a WMS service. This facility is given in Leaflet javascript library we just need to add its plugin. Here we also need to provide layer name, format of layer and make transparent as true.
var raster = L.tileLayer.wms(‘http://139.59.42.235:8080/geoserver/portfolio/wms?’, {
layers: ‘padang_eq_2009_wgs84’,
format: ‘image/png’,
transparent: true
}).addTo(map);
Intensity of earthquake is denoted by color ramp. To know the value of earthquake intensity at particular location, we can place the marker and can read the popup. Delete button is given to delete all markers.
function showGetFeatureInfo(latlng, layer){
var prop = layer.features[0].properties;
var mark=L.marker([latlng.lat,latlng.lng]).addTo(map);
var gray=prop[‘GRAY_INDEX’];
mark.bindPopup(“Earthquake Value: “+gray.toString());
}