File conversion is crucial to Geographic Information Systems (GIS) in order to guarantee the seamless integration of geospatial data across various platforms and applications. Geospatial data can be efficiently stored and shared in a single file that can be used in a variety of GIS software programs by converting CSV to GPKG.
What is CSV File?
A CSV file (Comma-Separated Values) is a simple text file that stores data in a table format. Each line represents a row, and the values in each row are separated by commas, making it easy to organize and share information like a spreadsheet.
Key Concept for Conversion CSV to GPKG:
MAPOG MapAnalysis‘s Converter Tool provides a simple, user-friendly interface for converting CSV files to GPKG. The following guide explains the step-by-step process for converting CSV to GPKG using the MAPOG platform.
Step-by-Step Guide to Converting CSV to GPKG
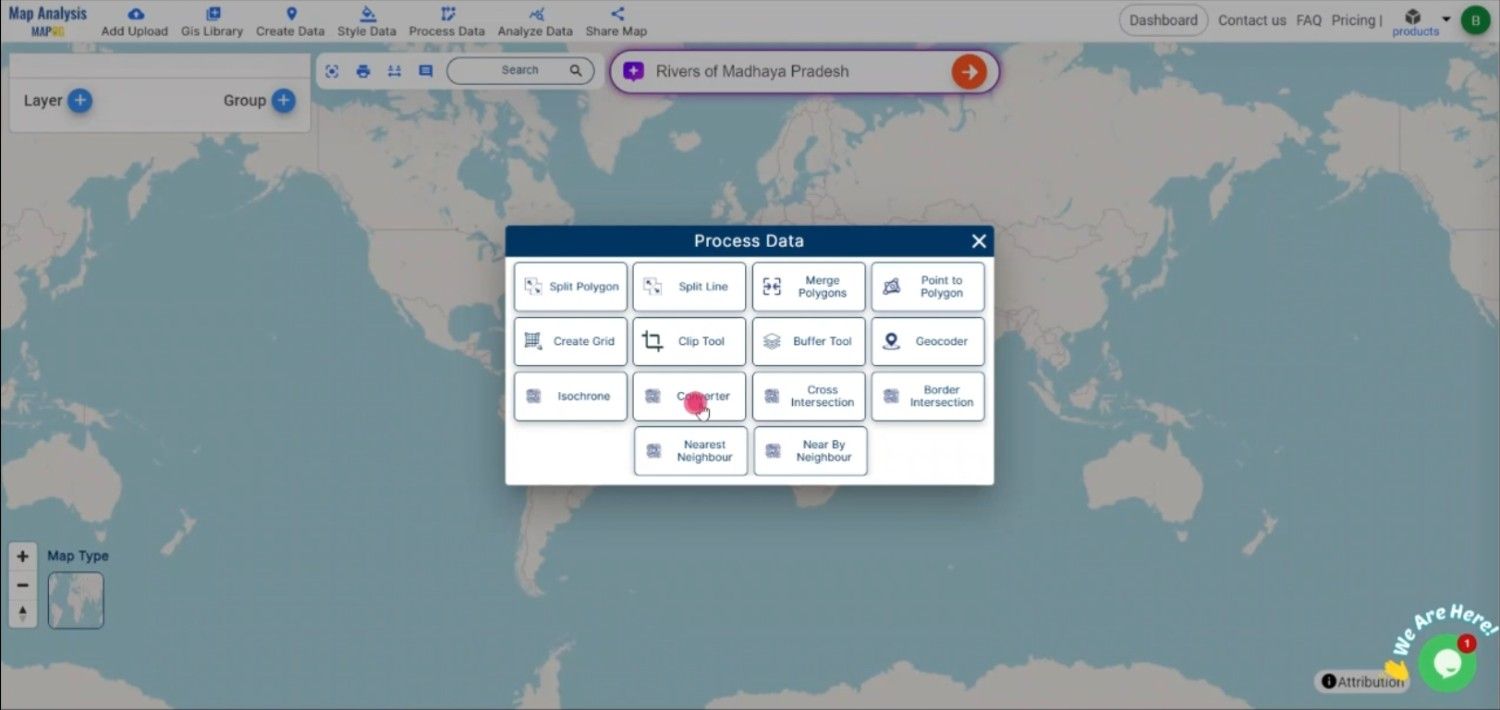
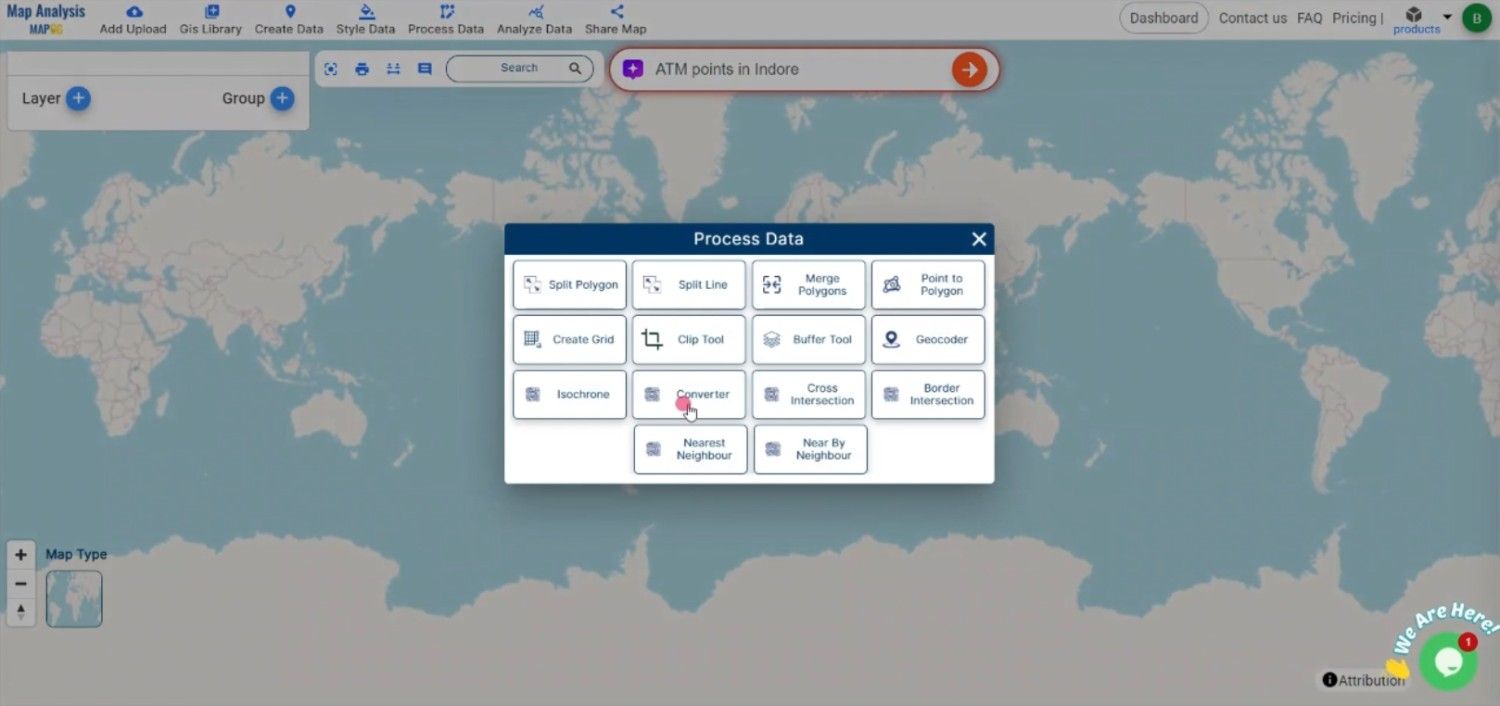
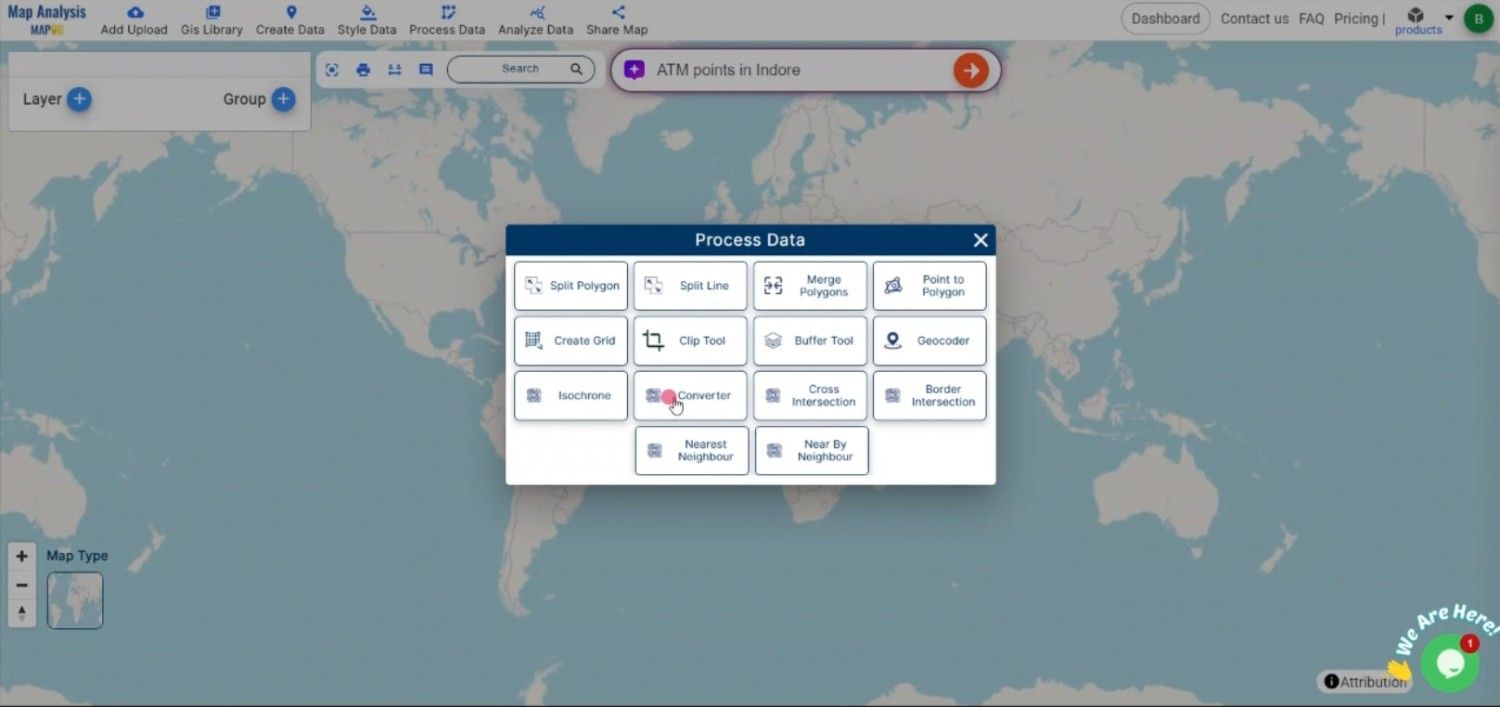
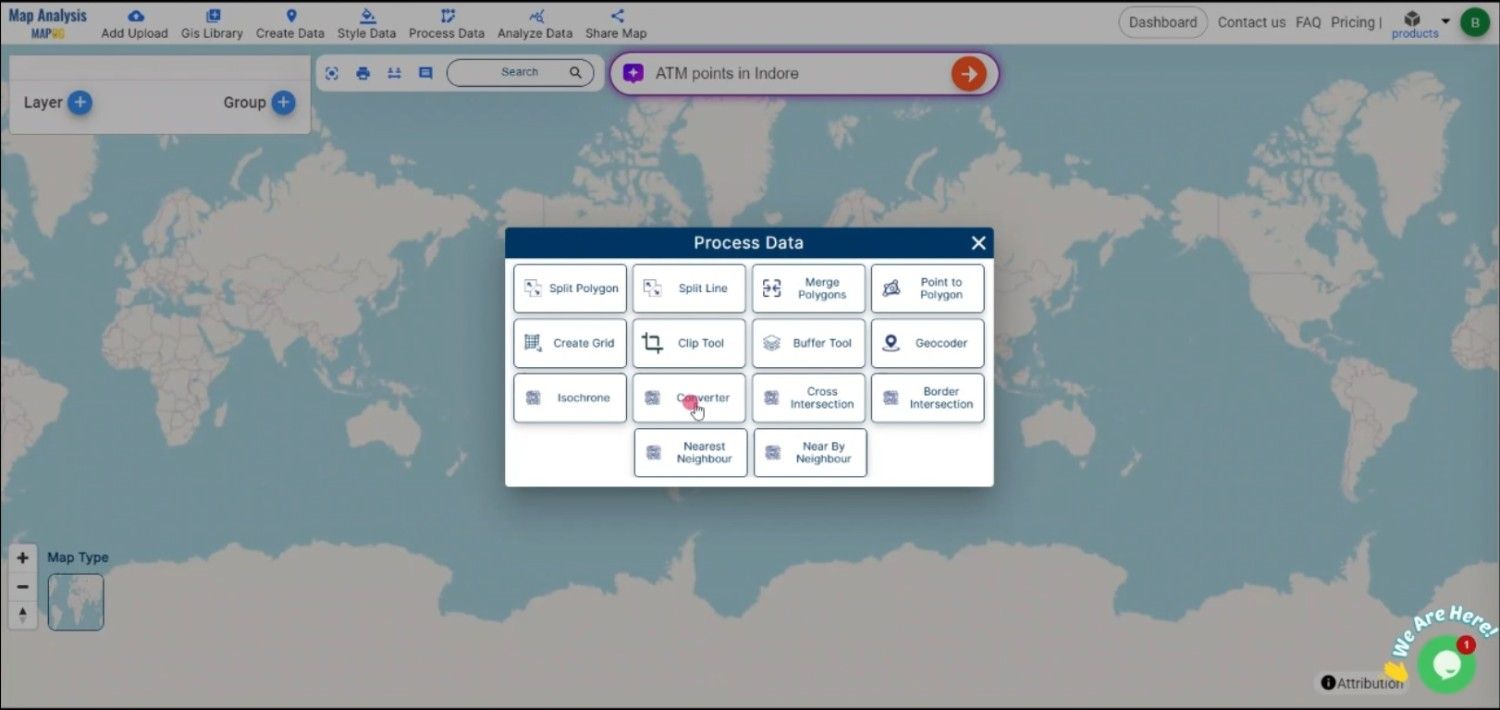
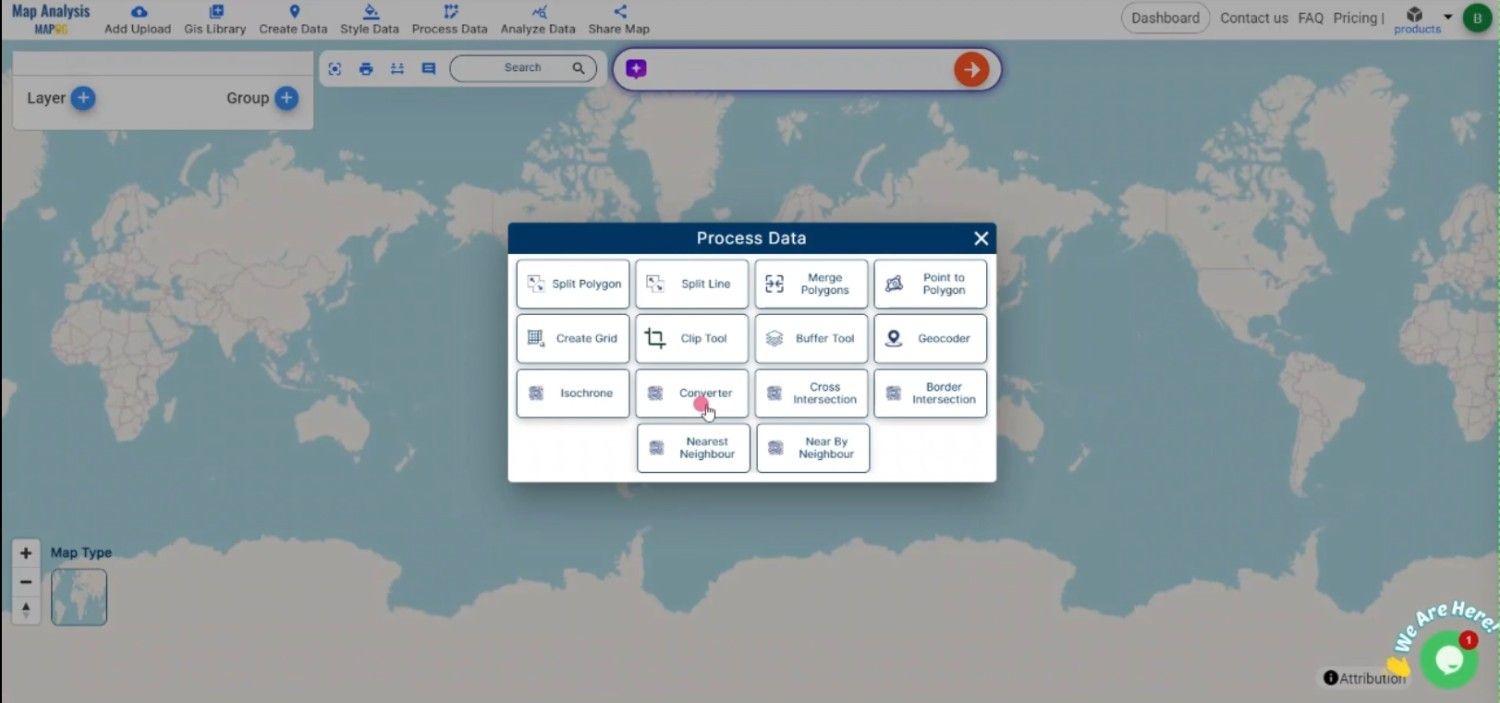
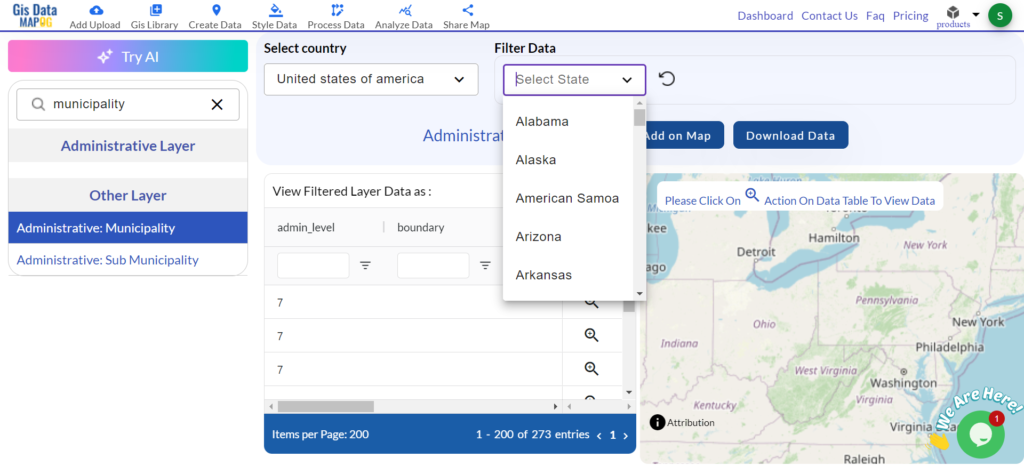
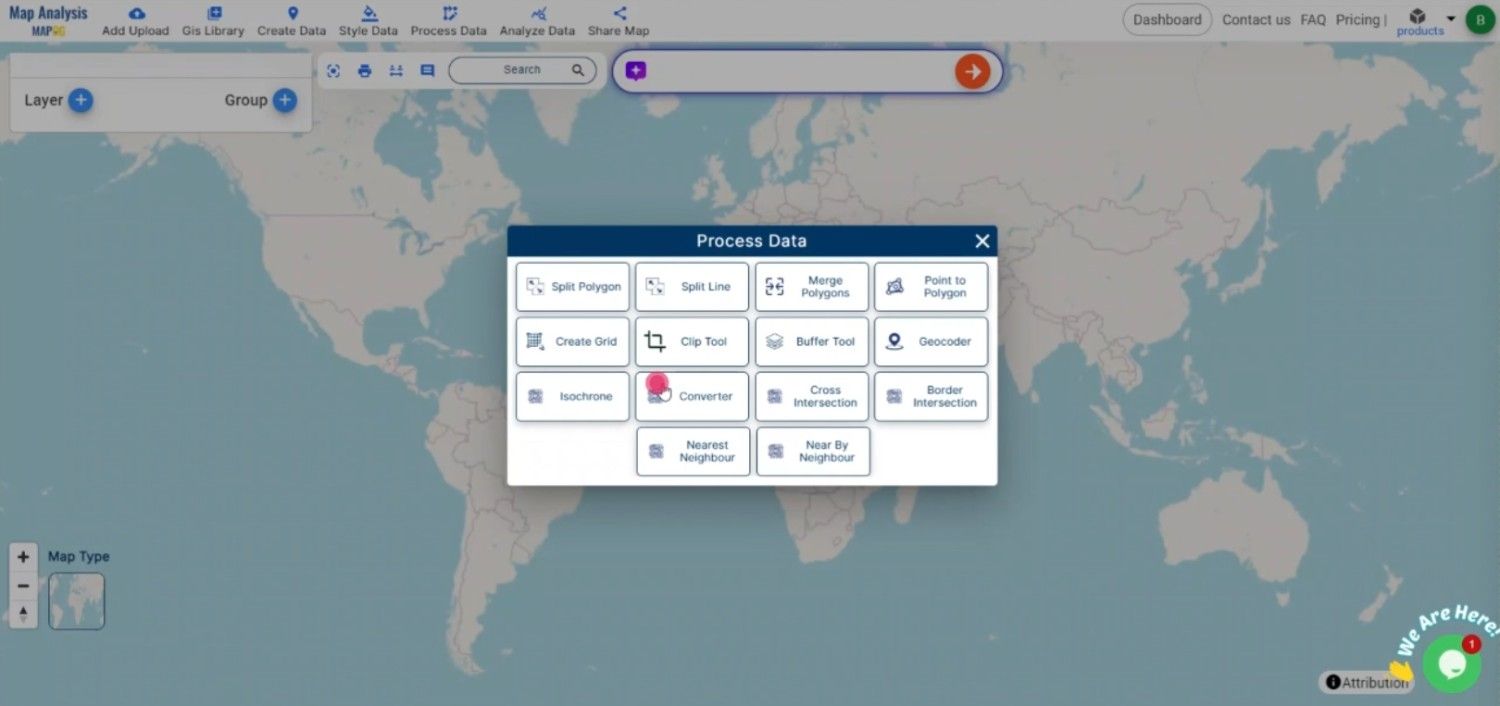
Step 1: Upload Your CSV Data
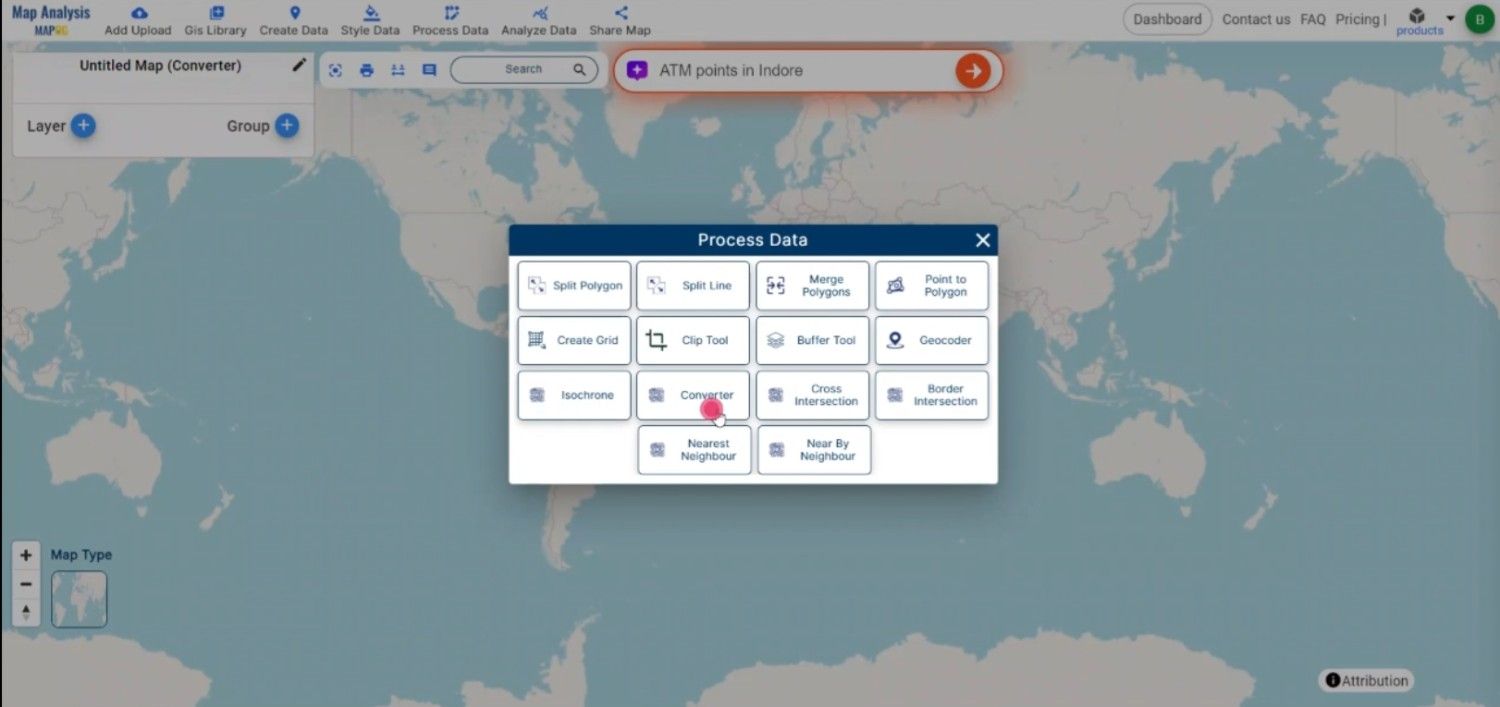
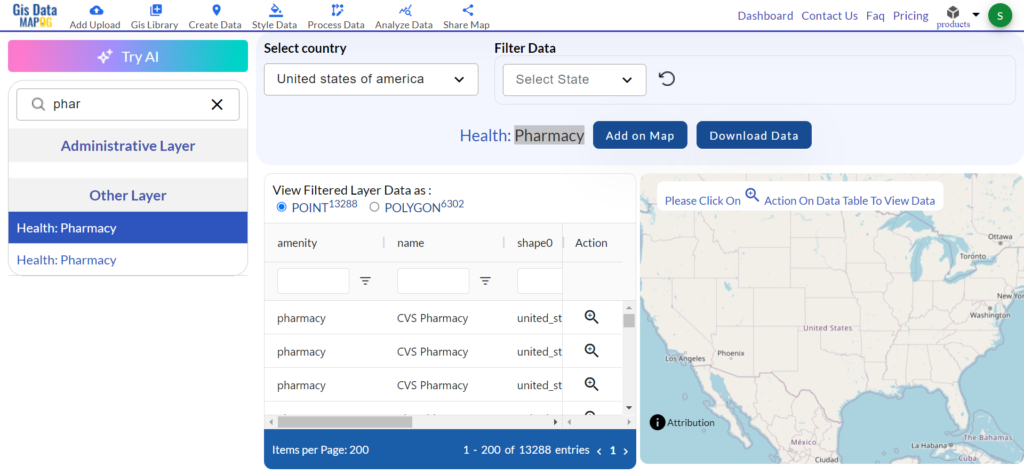
Begin by navigating to the “Process Data” section in MAPOG MapAnalysis and selecting the “Converter Tool“. Ensure your CSV file is well-structured, with clear headers for fields like latitude, longitude, and any other relevant data.
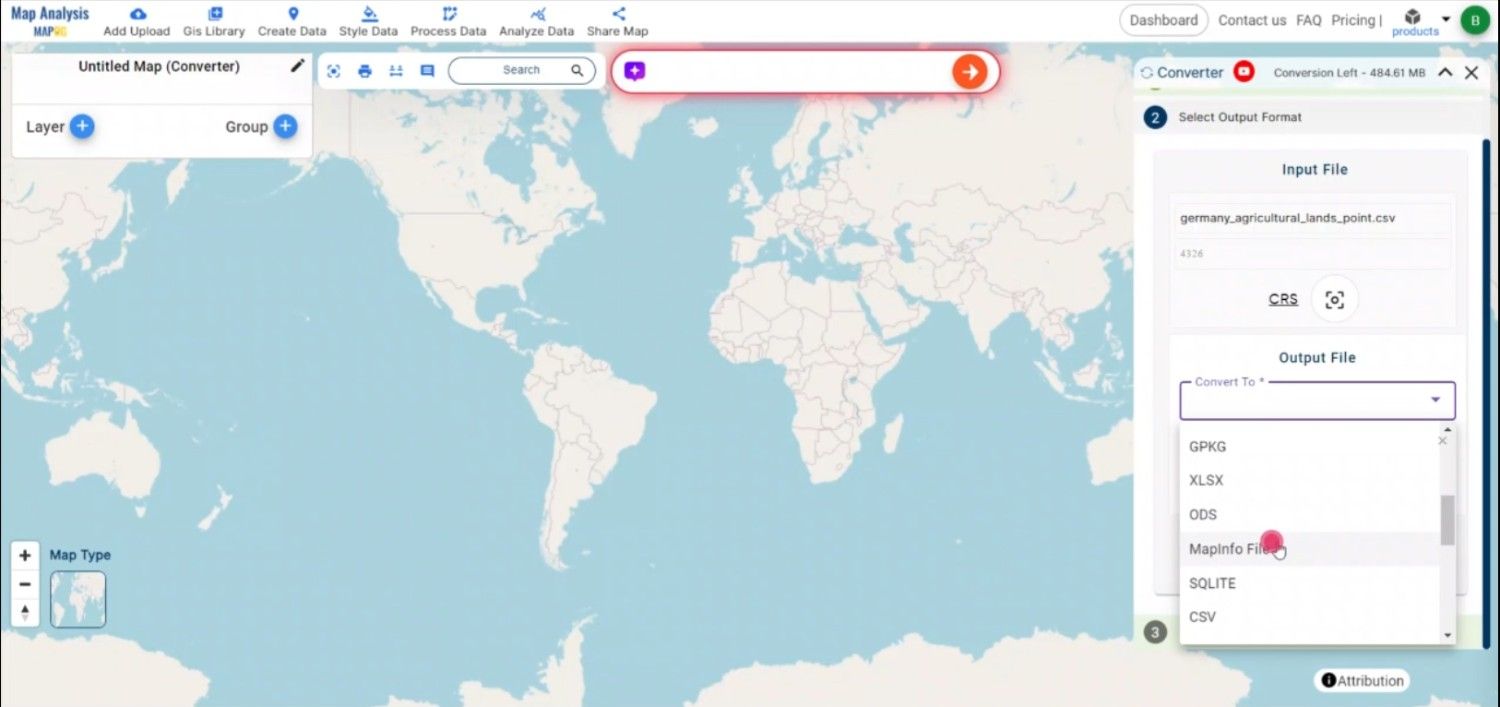
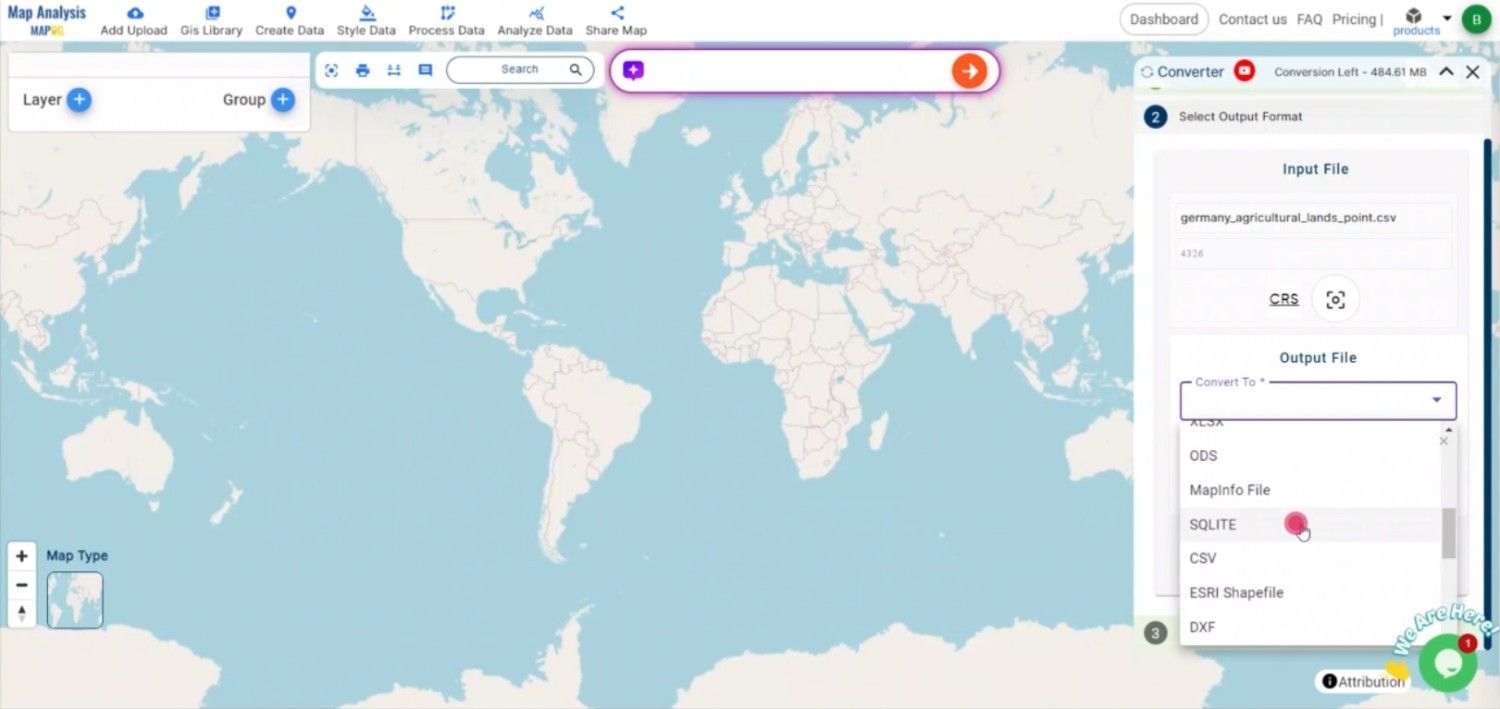
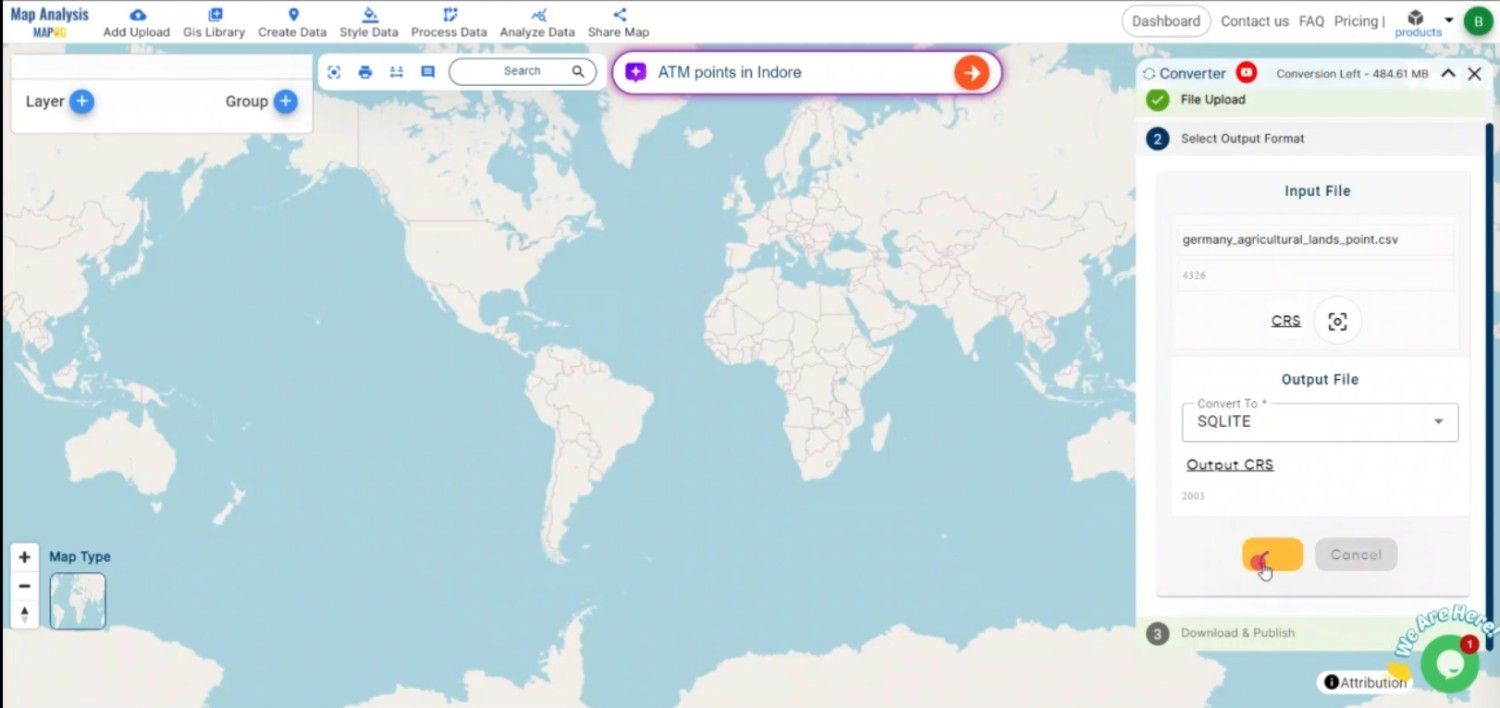
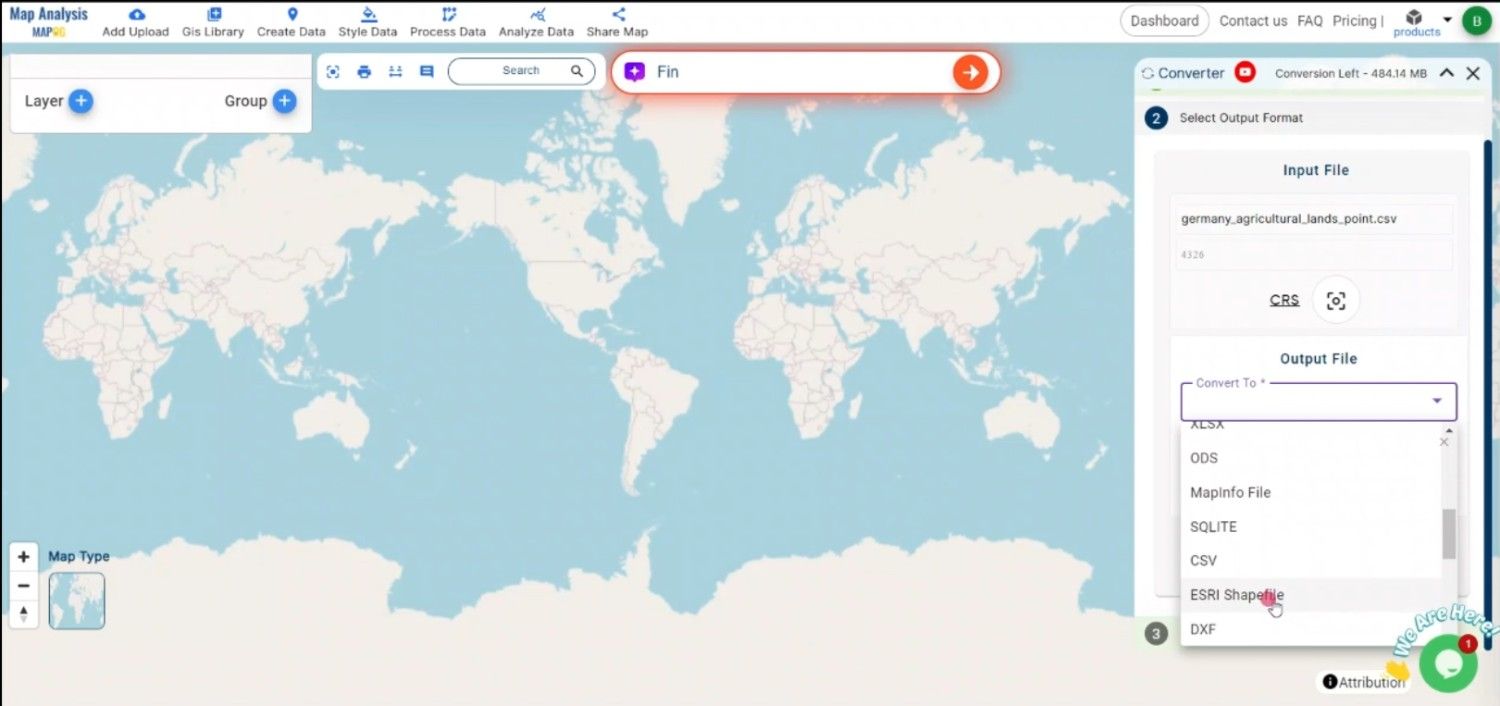
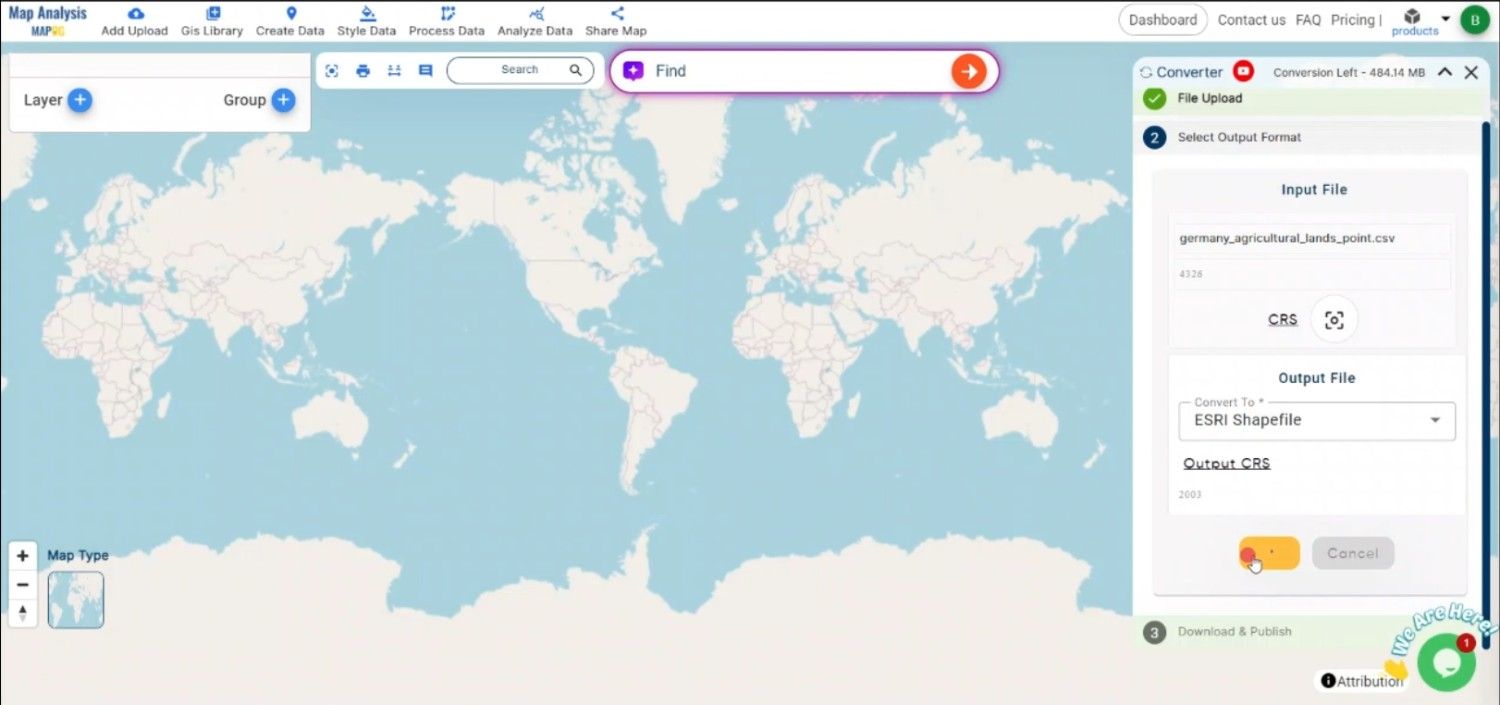
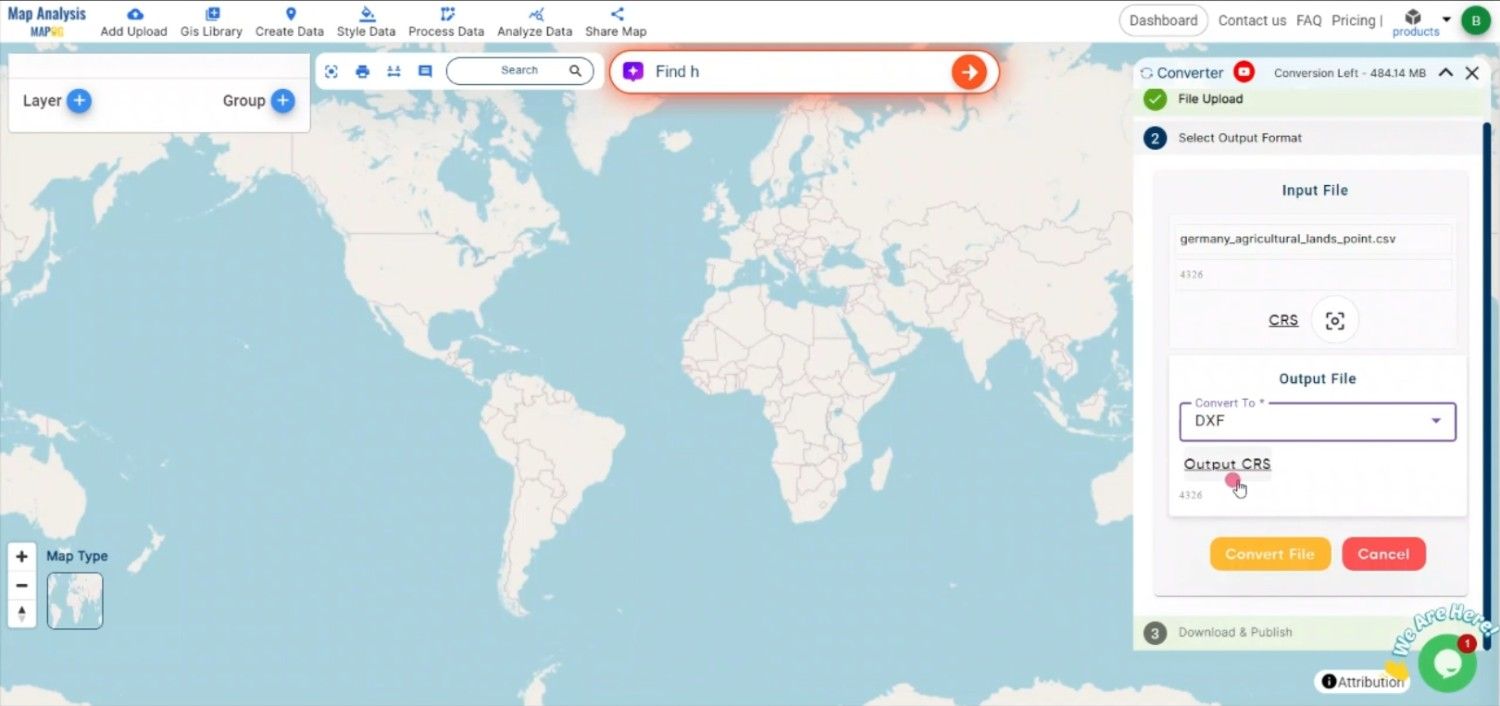
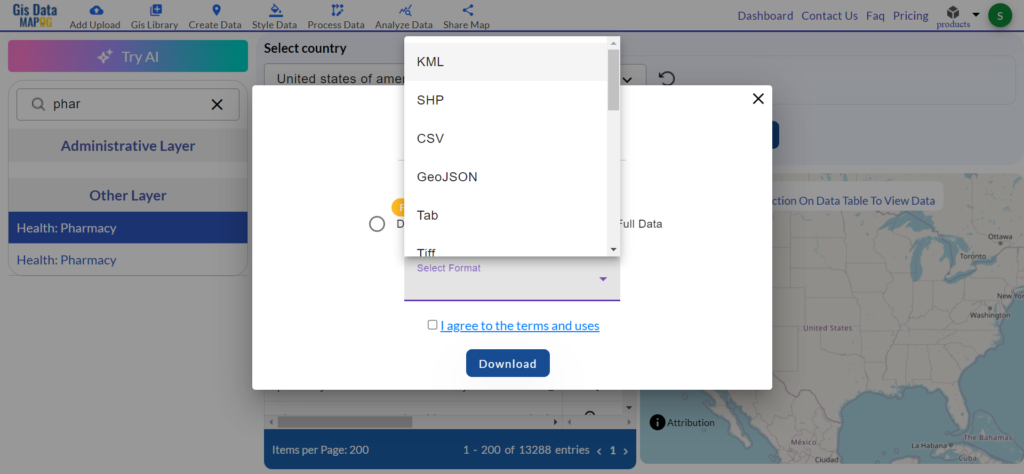
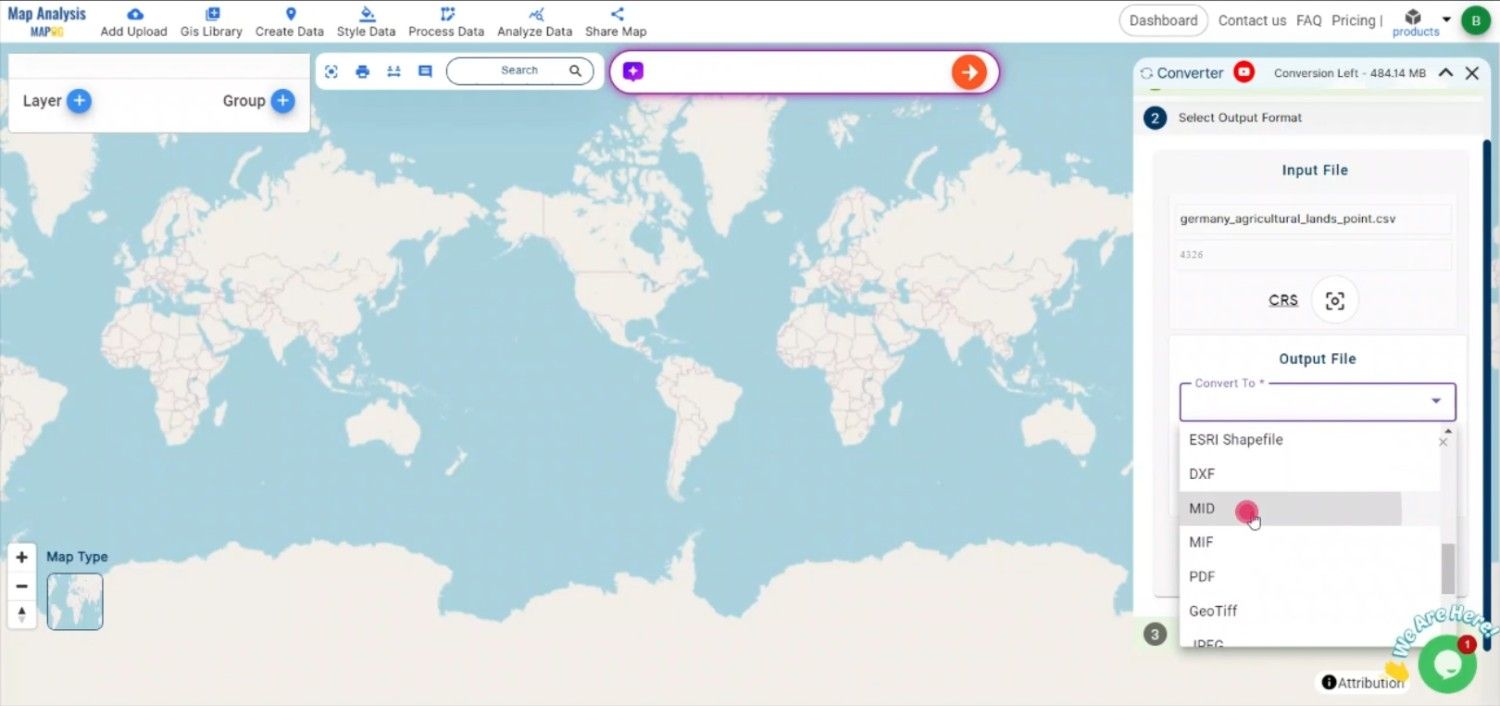
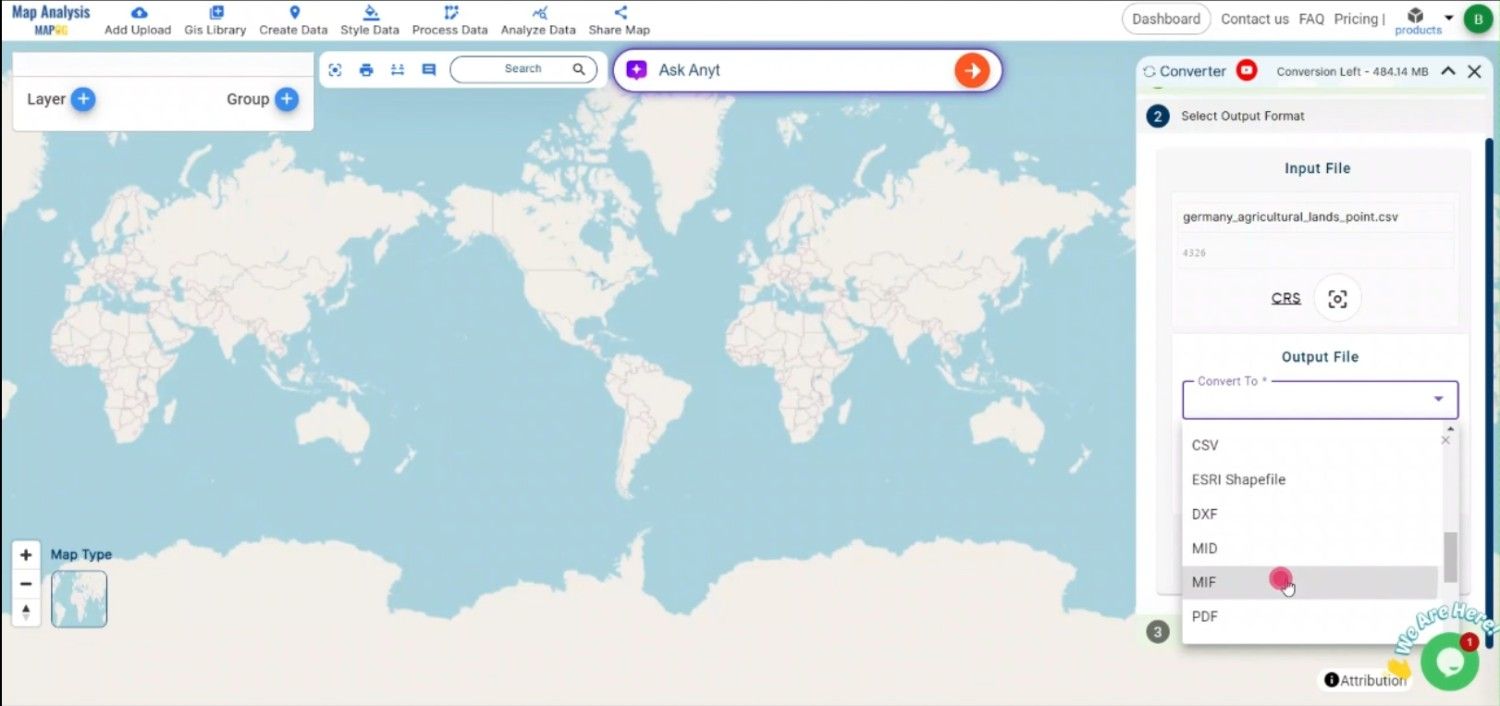
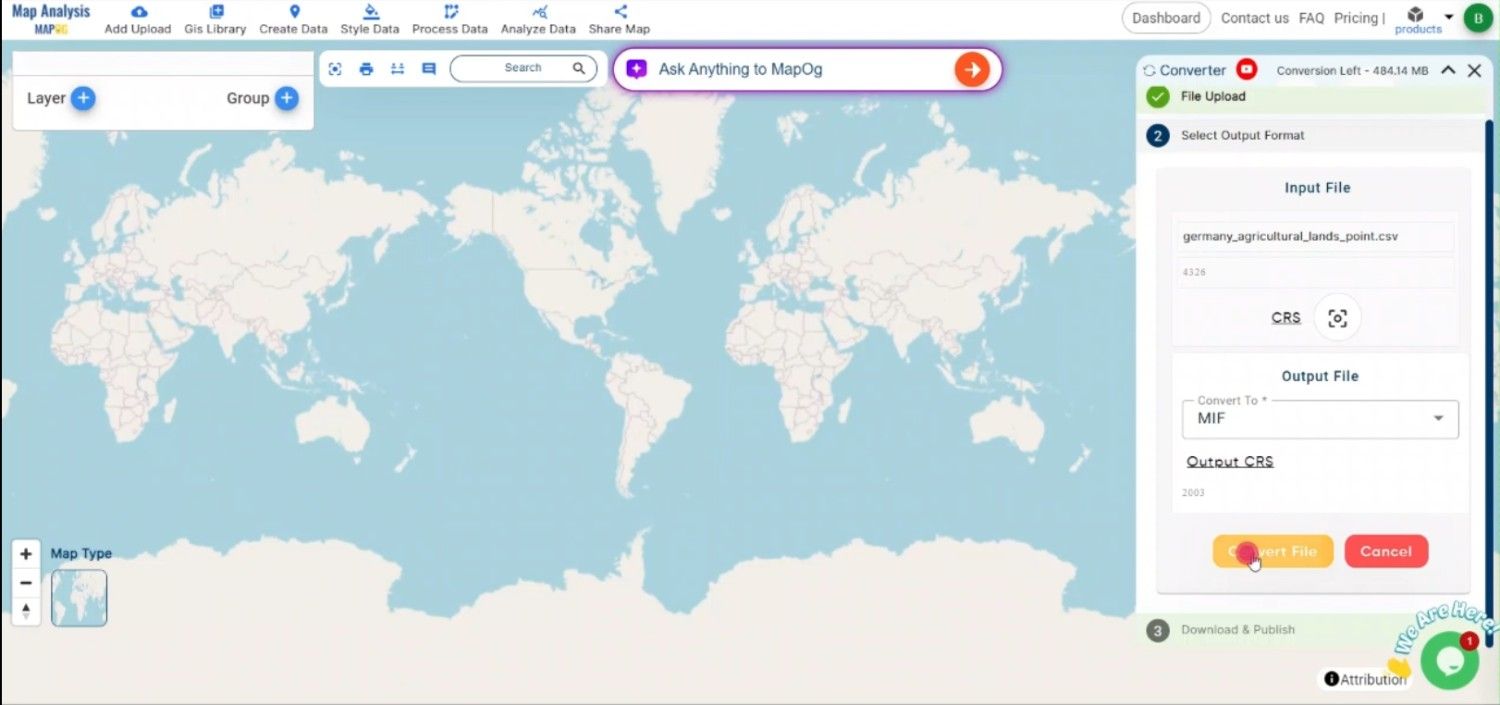
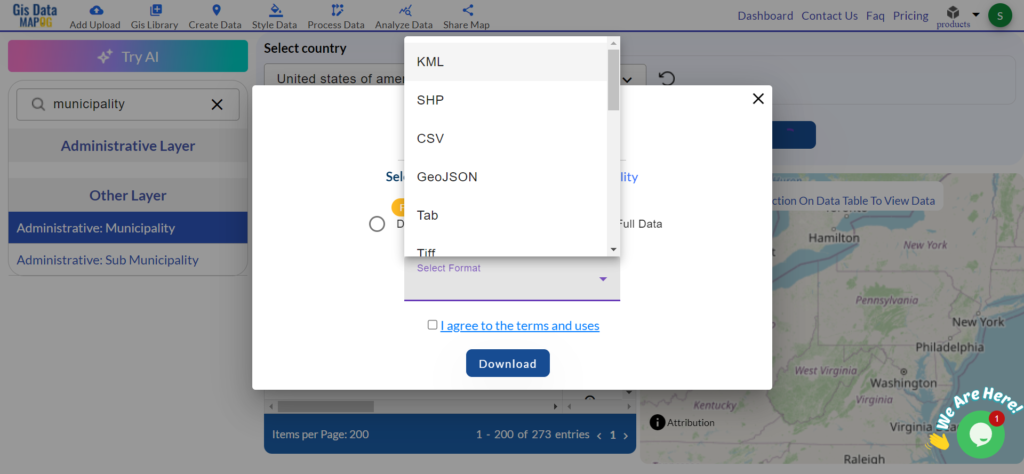
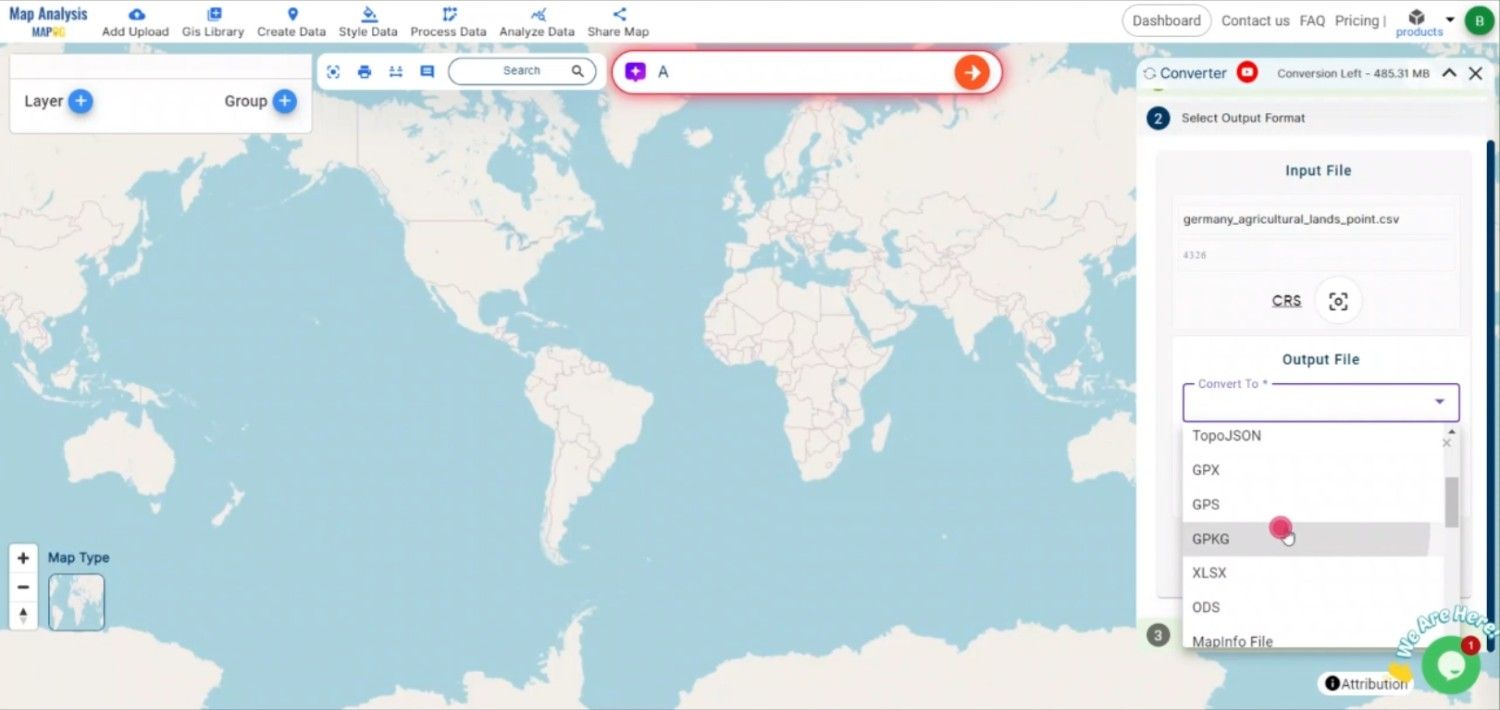
Step 2: Select GPKG as the Output Format
Once your CSV file is uploaded, choose GPKG (GeoPackage) as the desired output format. GPKG is a versatile, efficient format that allows you to store multiple types of geographic data, including points, lines, and polygons, in one file.
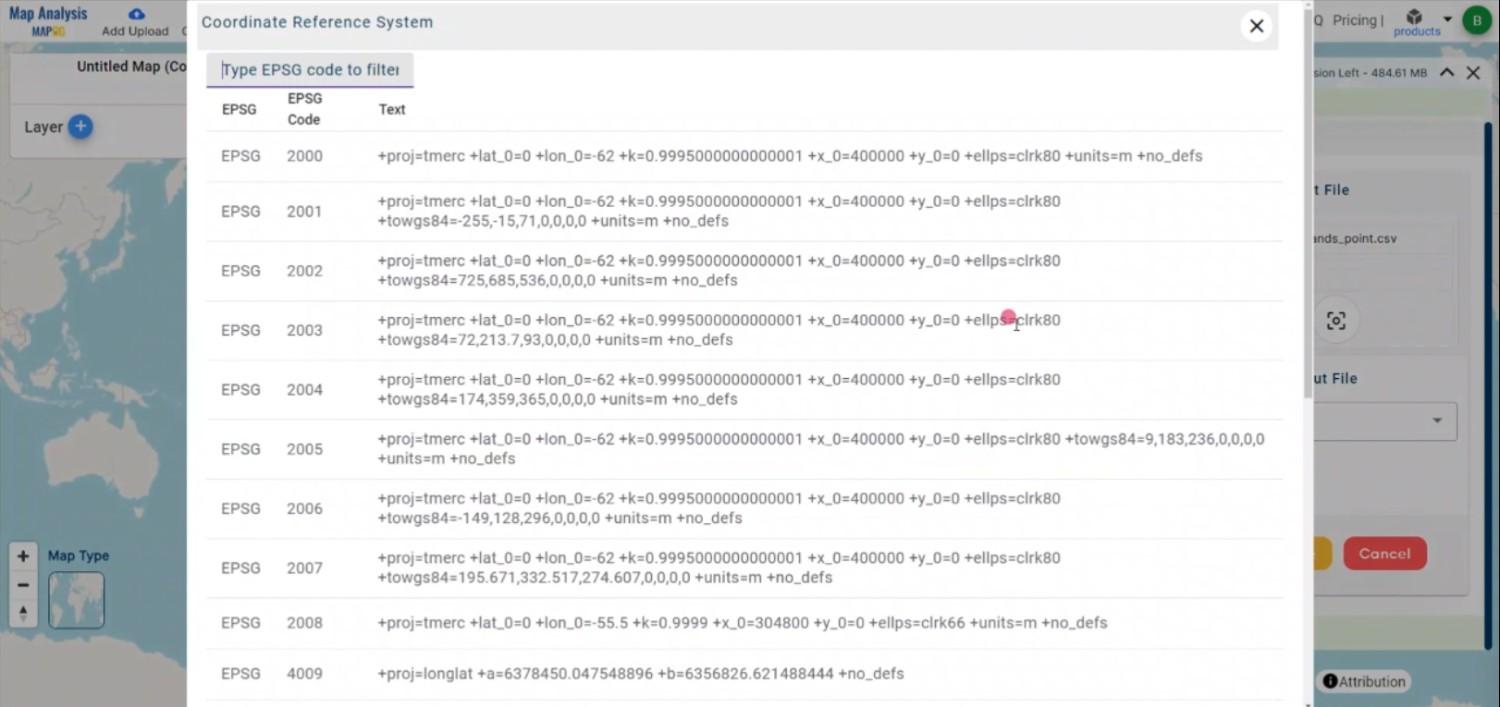
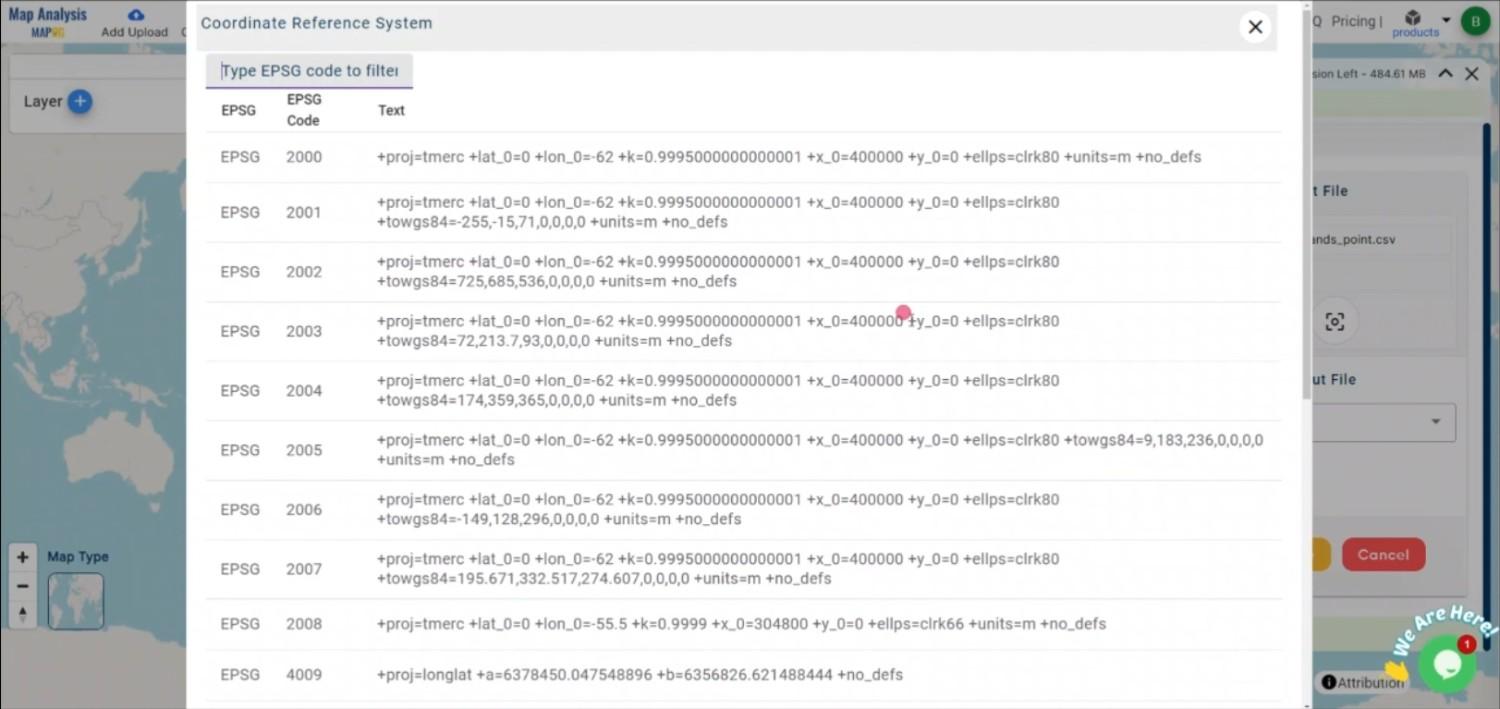
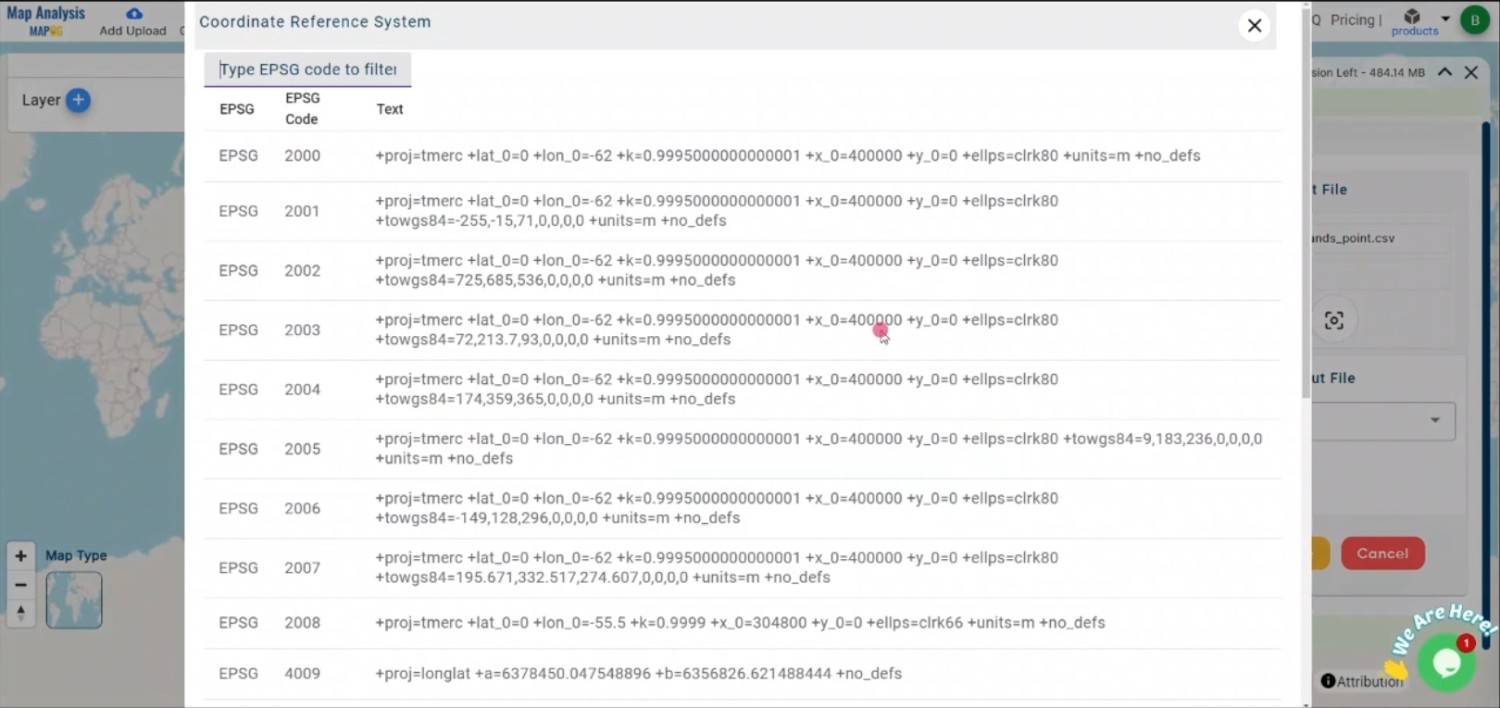
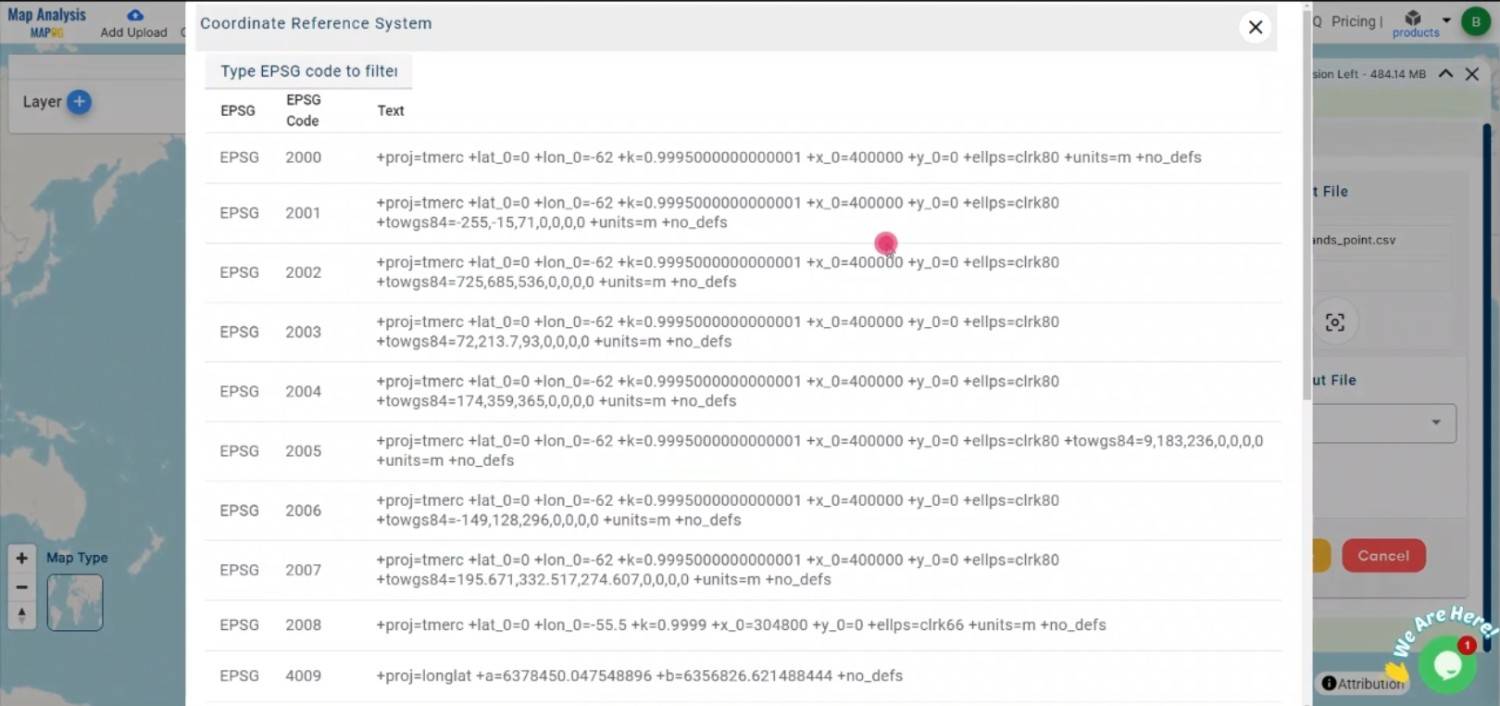
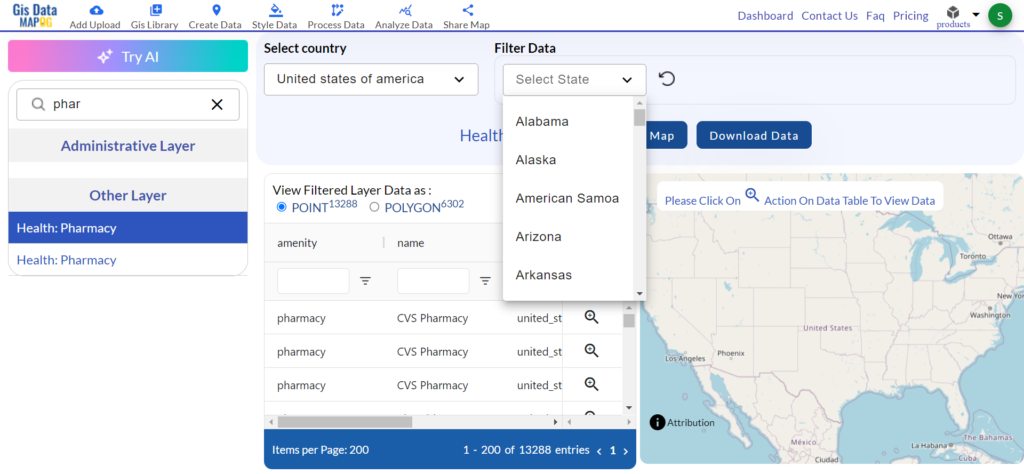
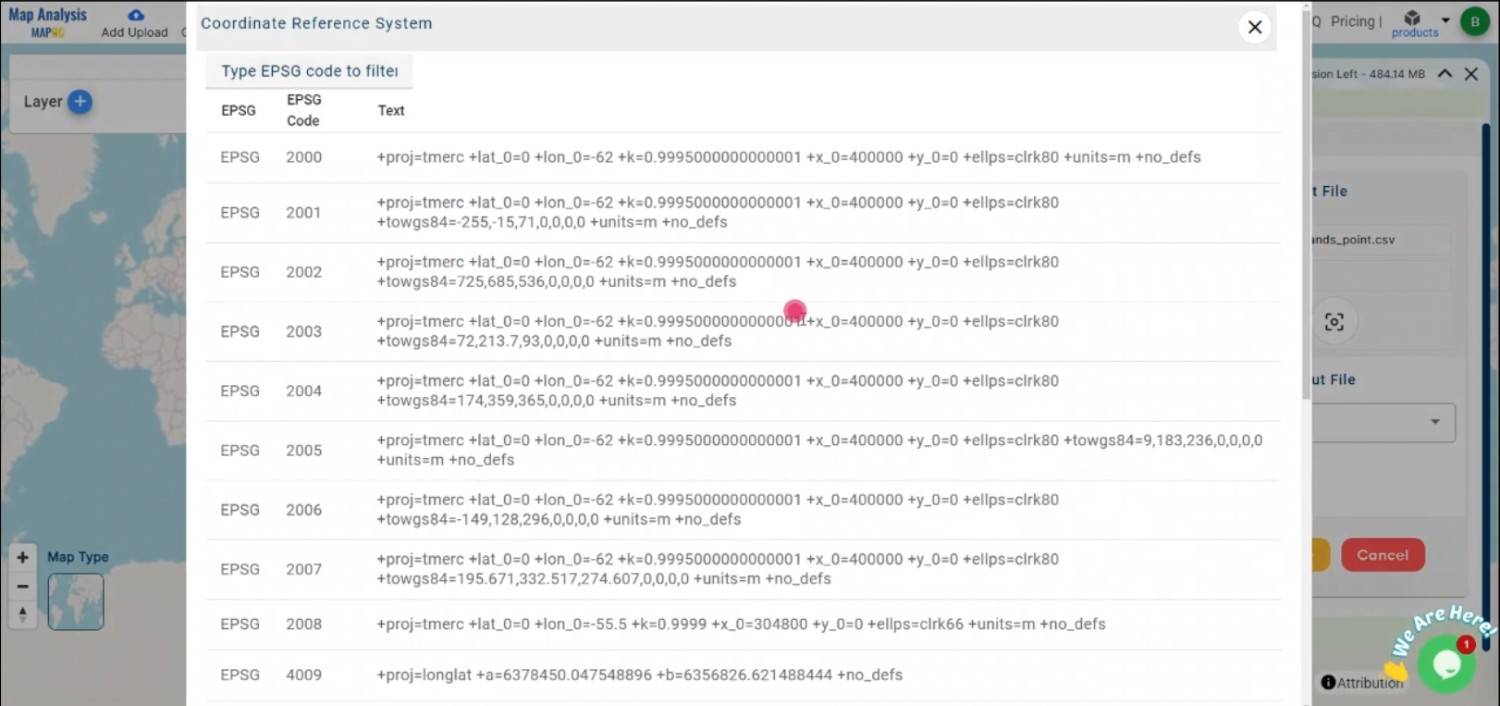
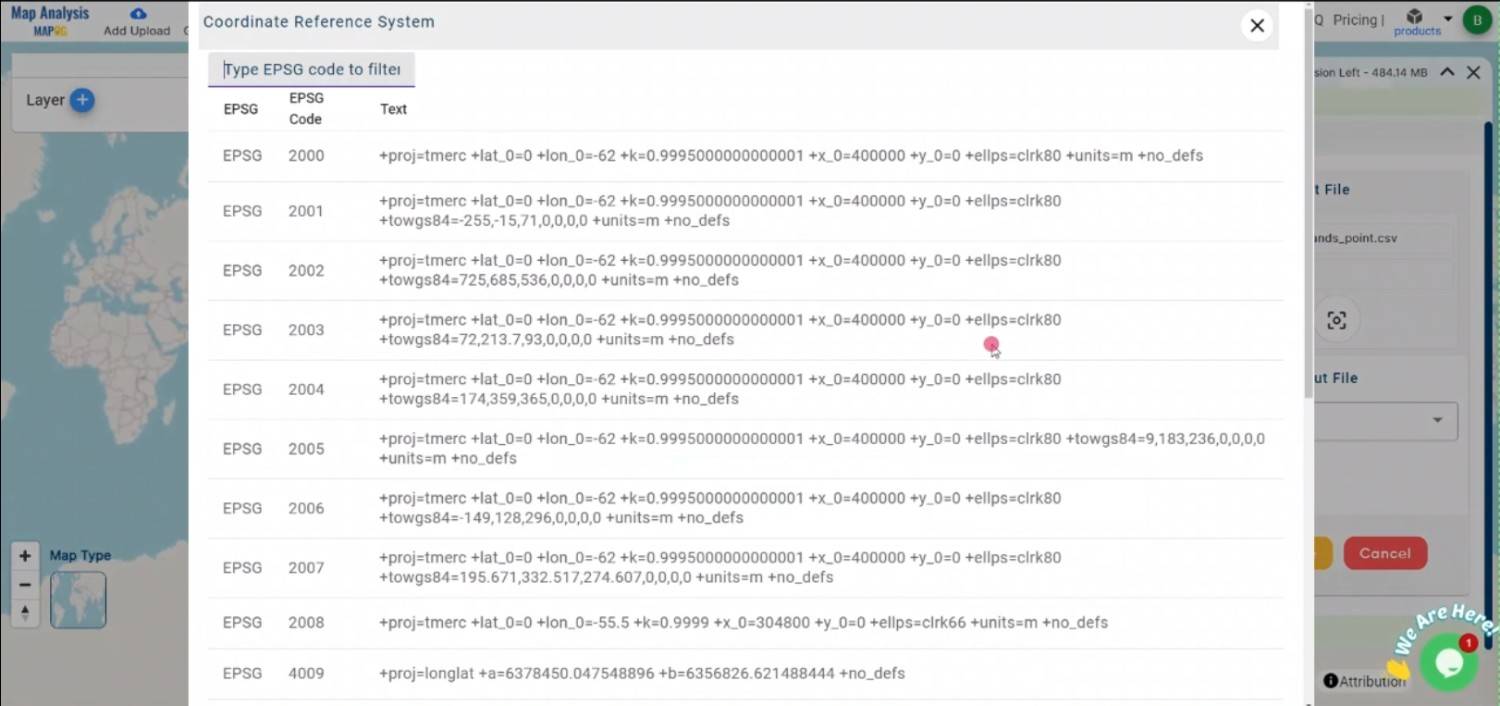
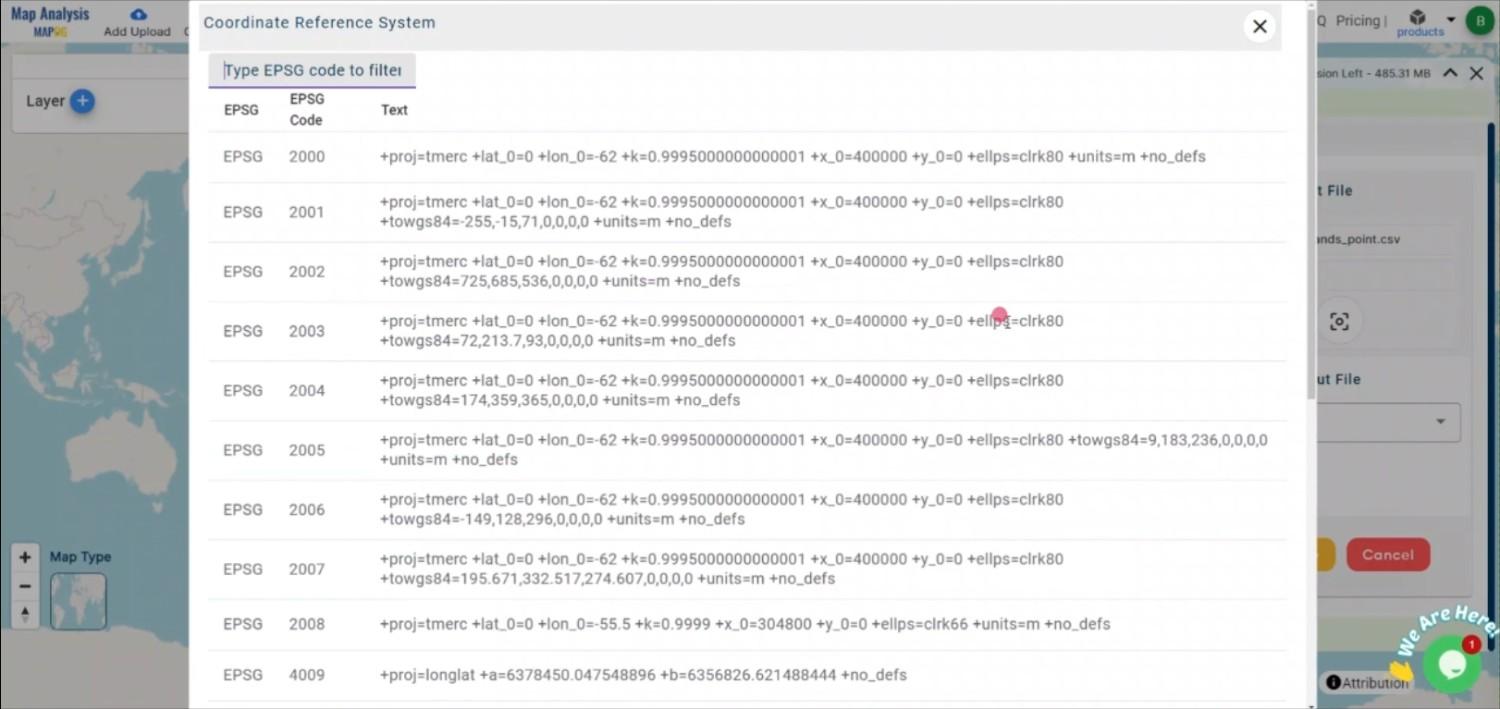
Step 3: Choose the Coordinate Reference System (CRS)
Select the appropriate CRS for your data, ensuring that the geographic coordinates are accurately projected in the resulting GPKG file. This step is crucial for maintaining spatial integrity when using your data in different GIS platforms.
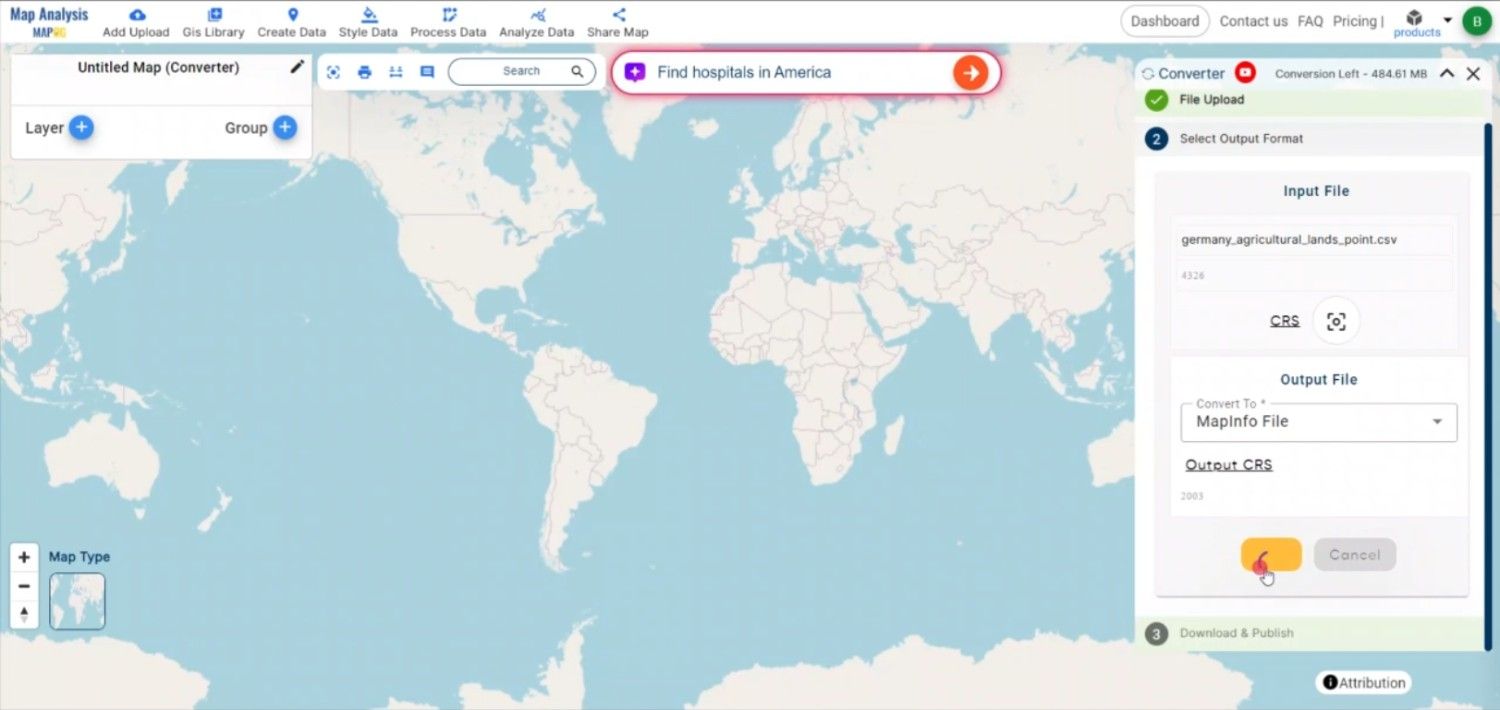
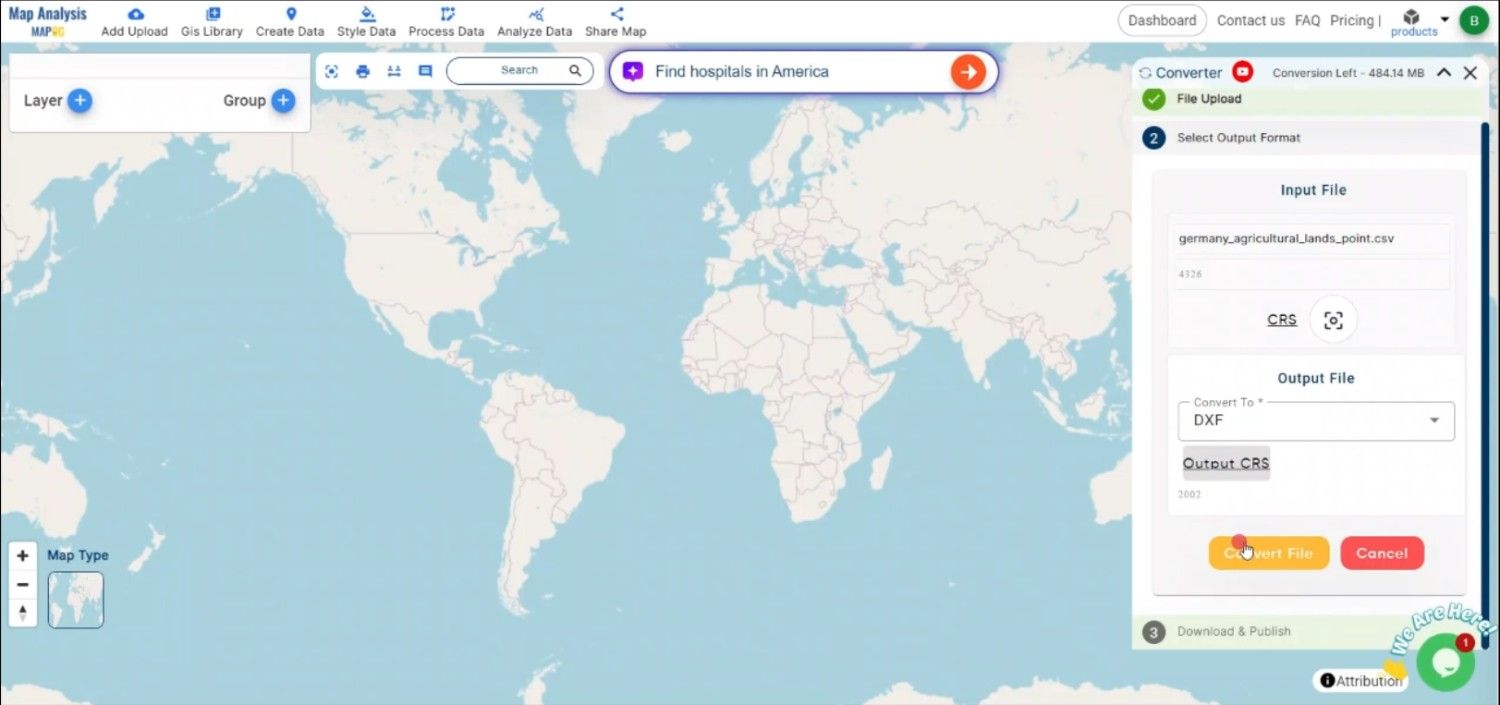
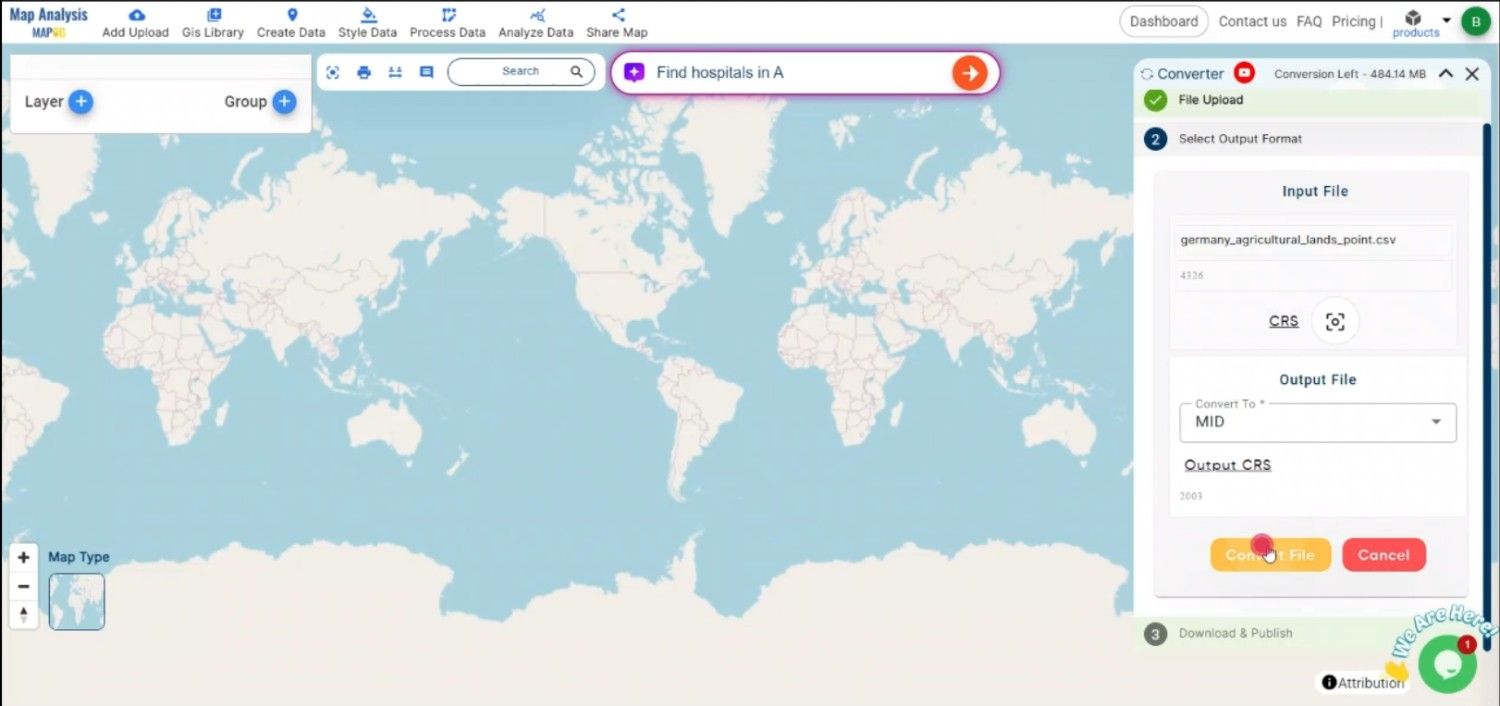
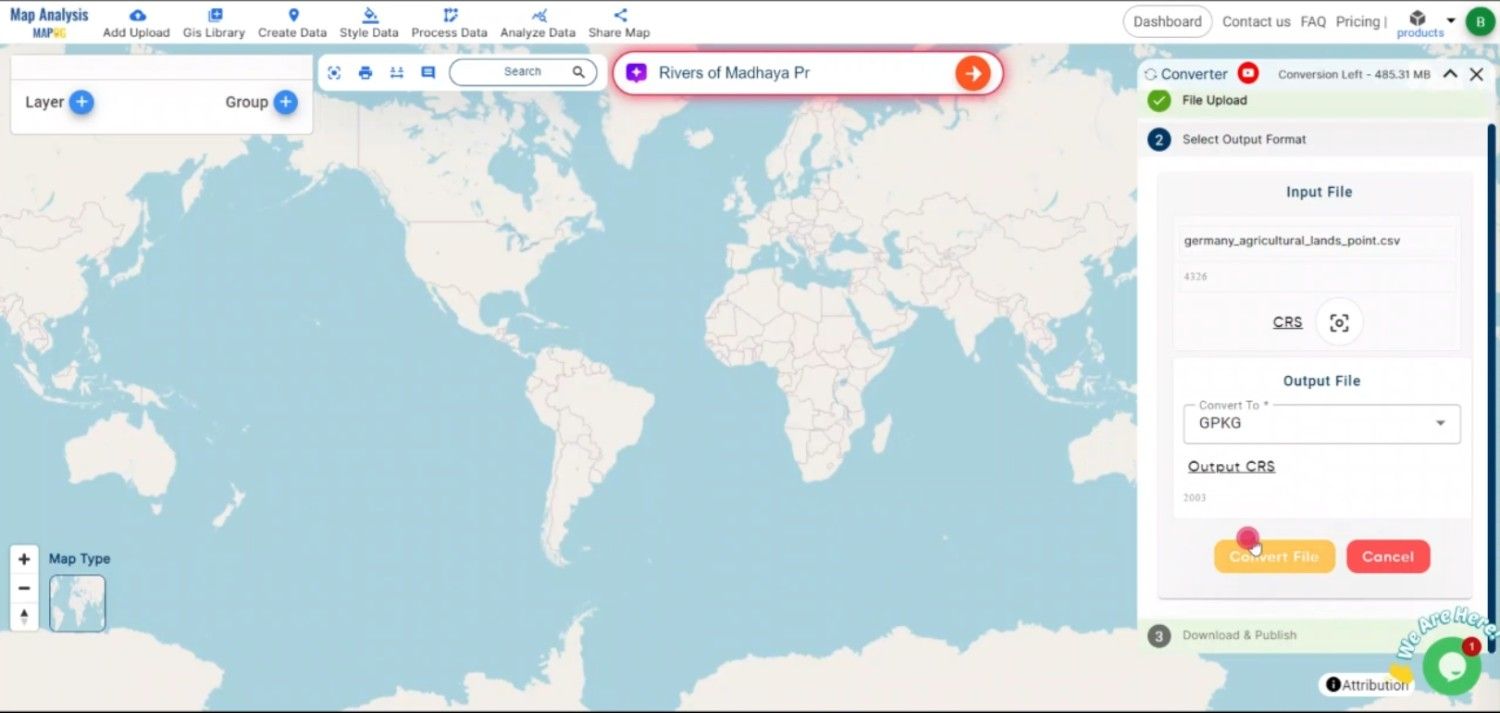
Step 4: Execute the Conversion
After mapping your data and selecting the CRS, initiate the conversion process. The MAPOG Converter Tool will transform your CSV data into a GPKG file, organizing the data into spatial layers and attributes.
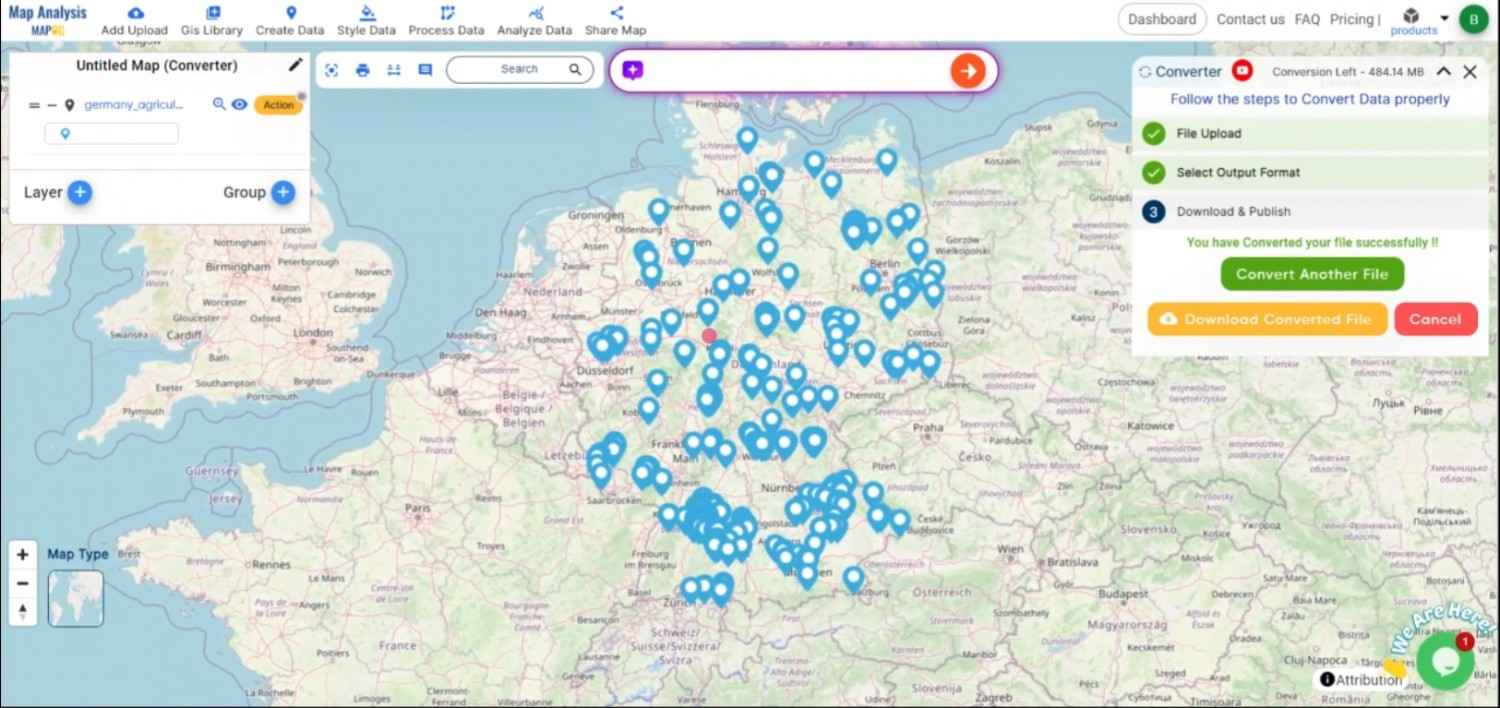
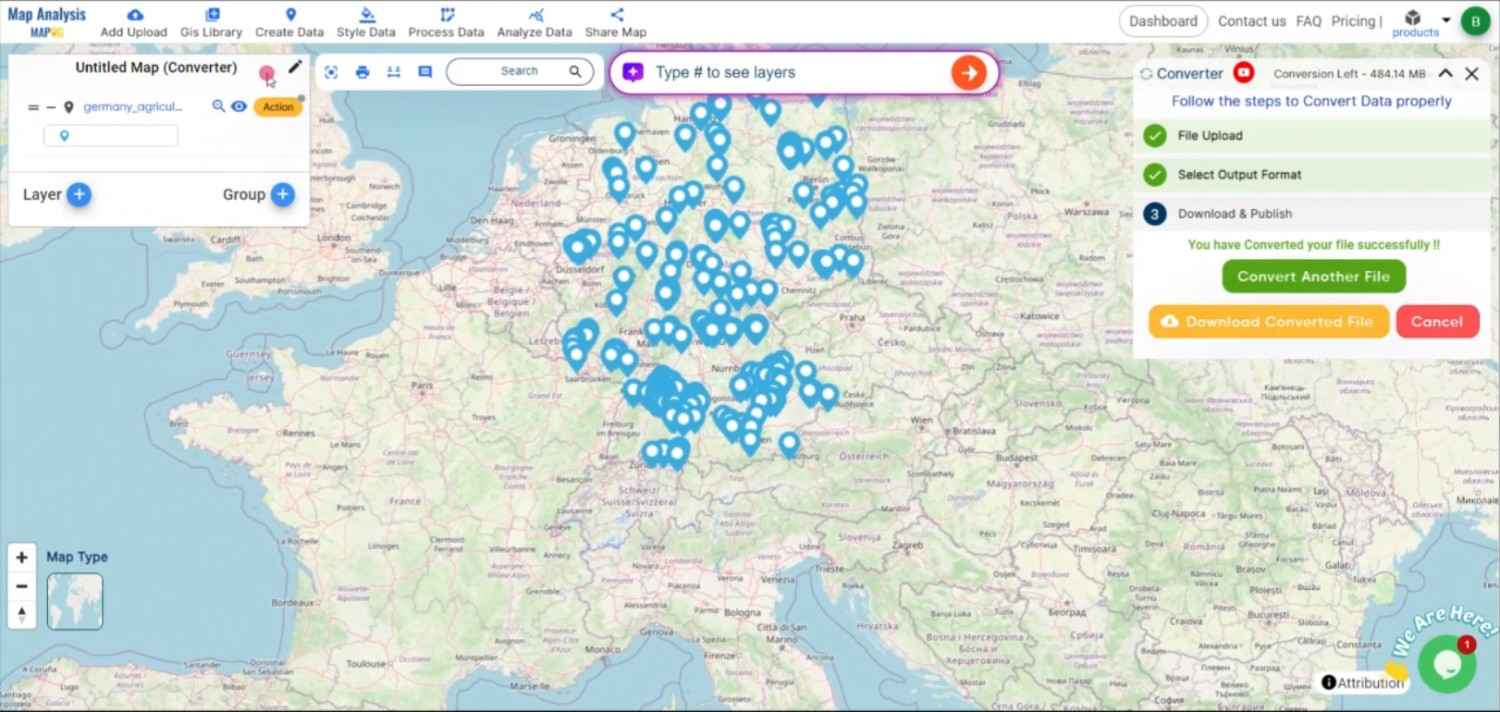
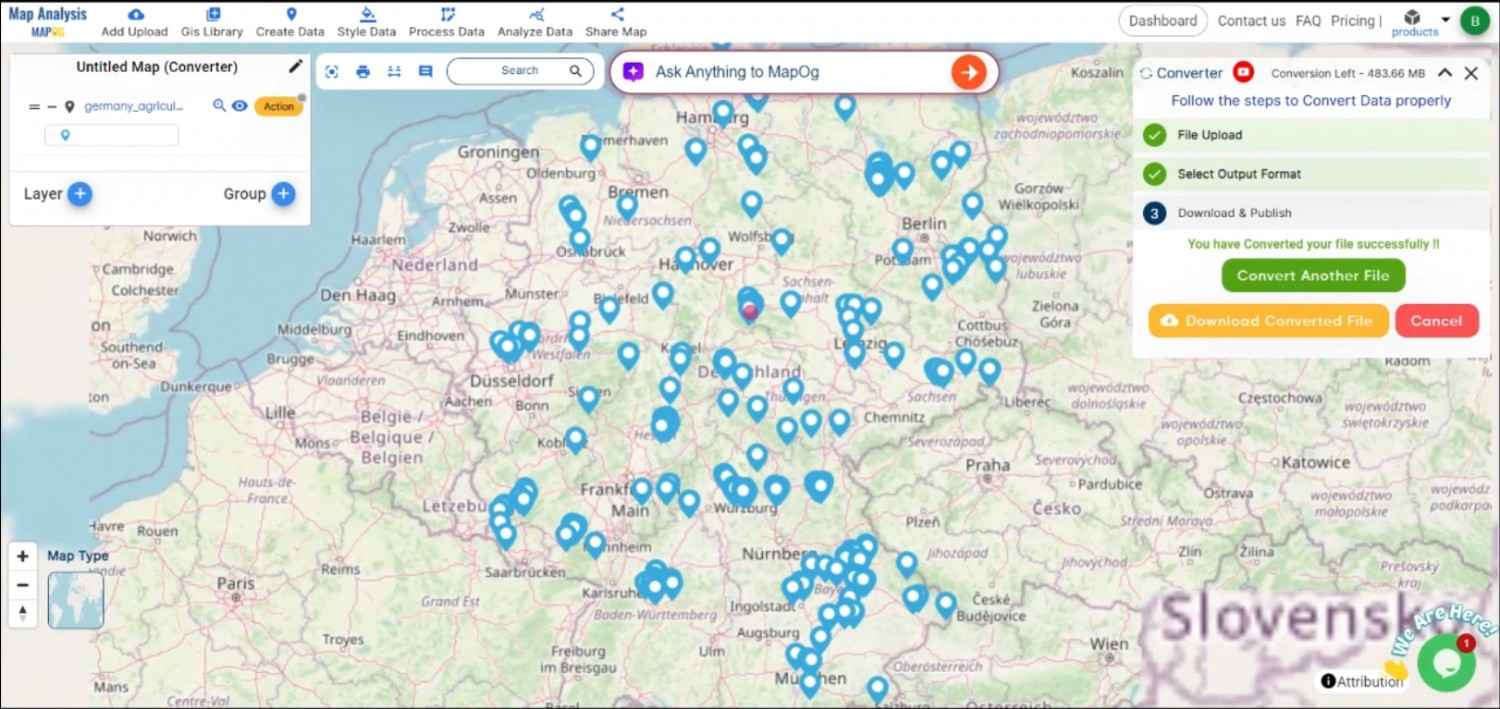
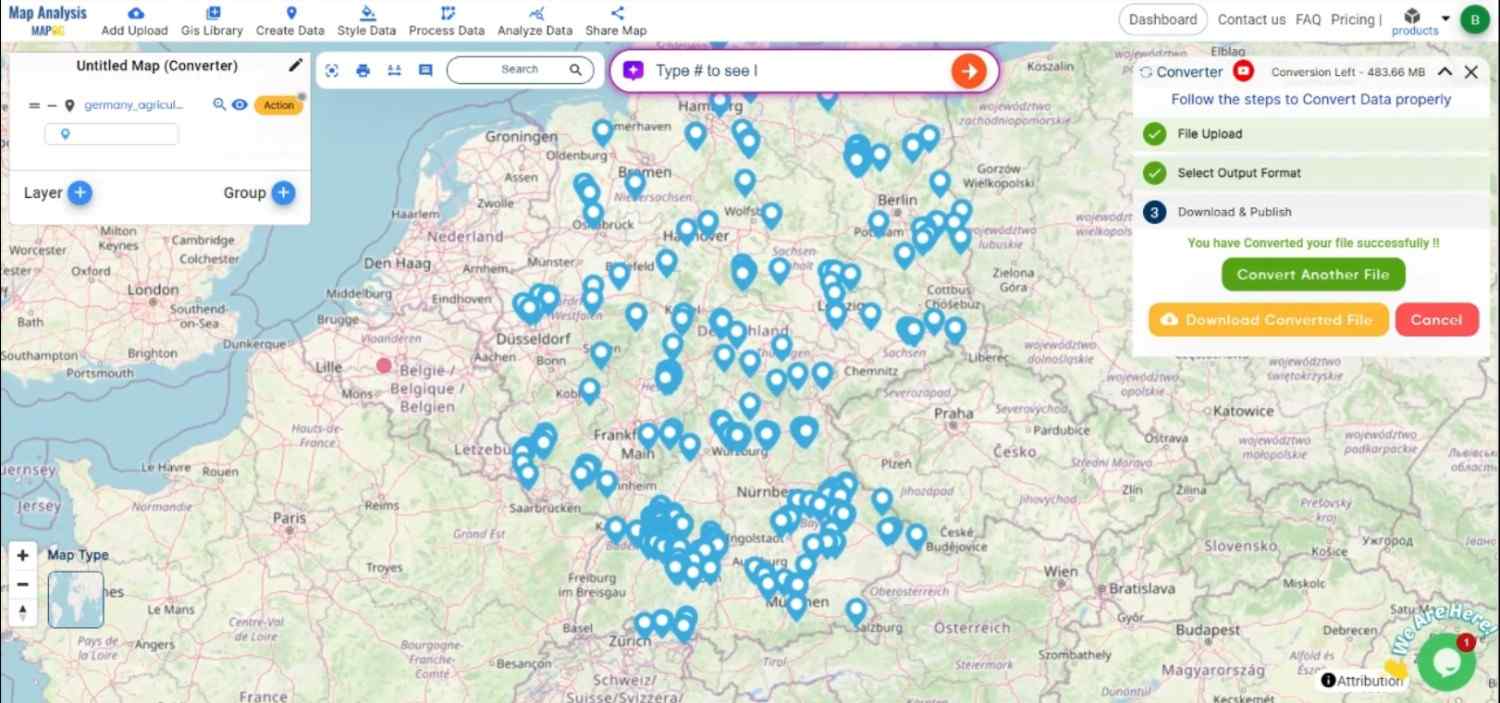
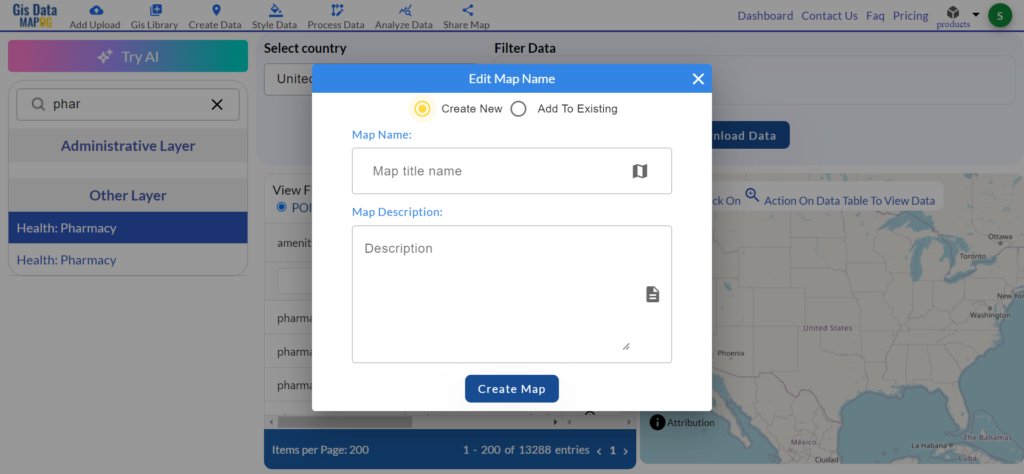
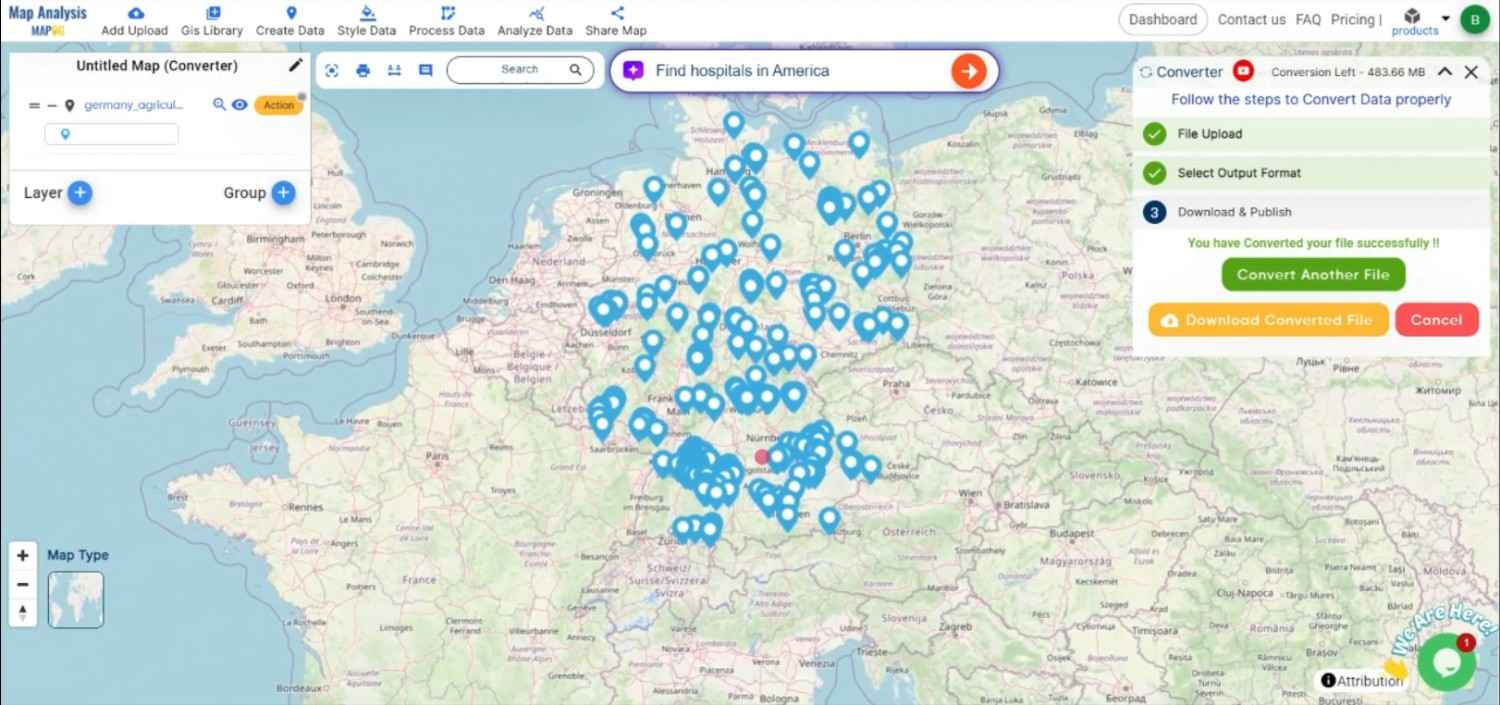
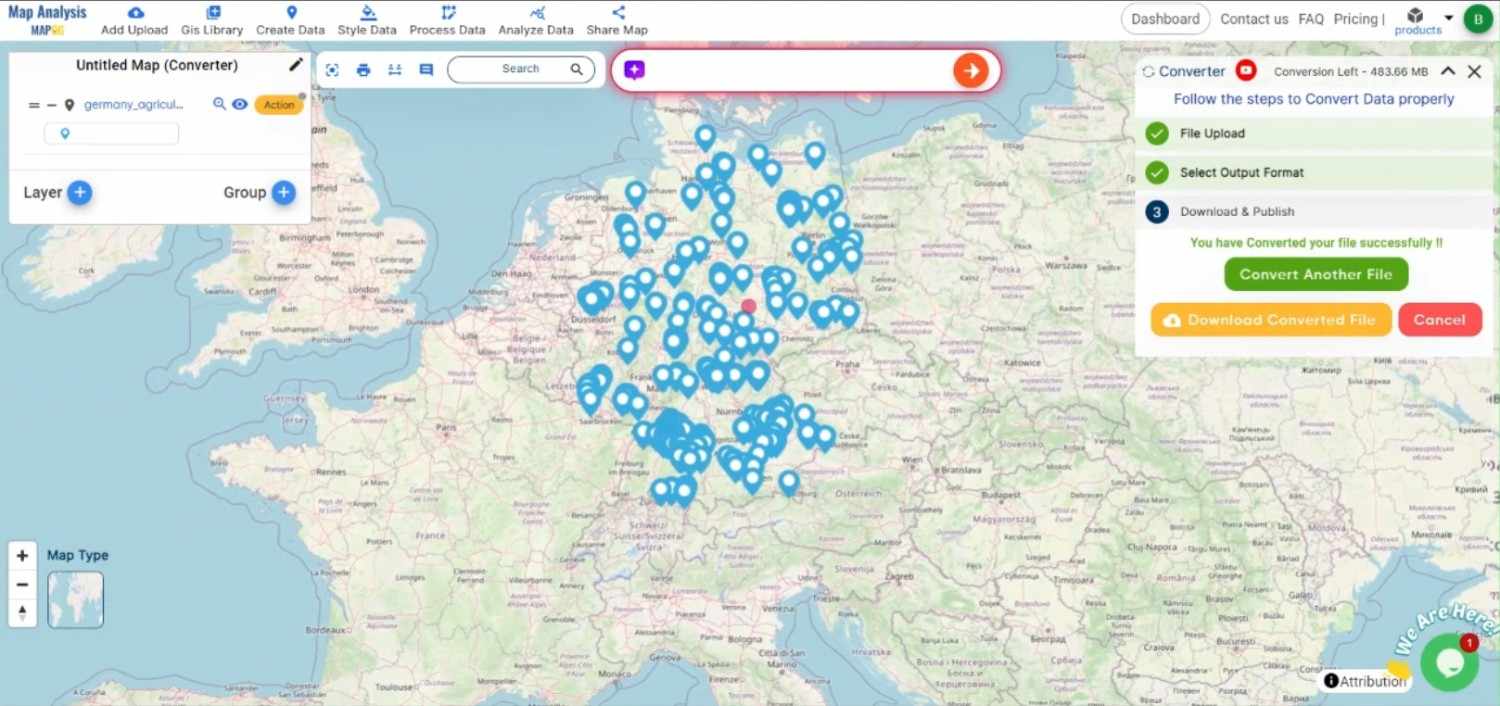
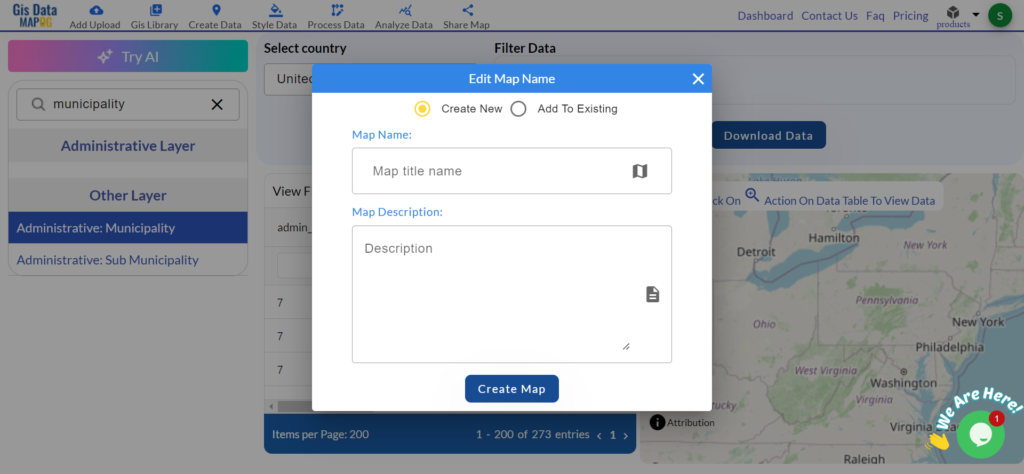
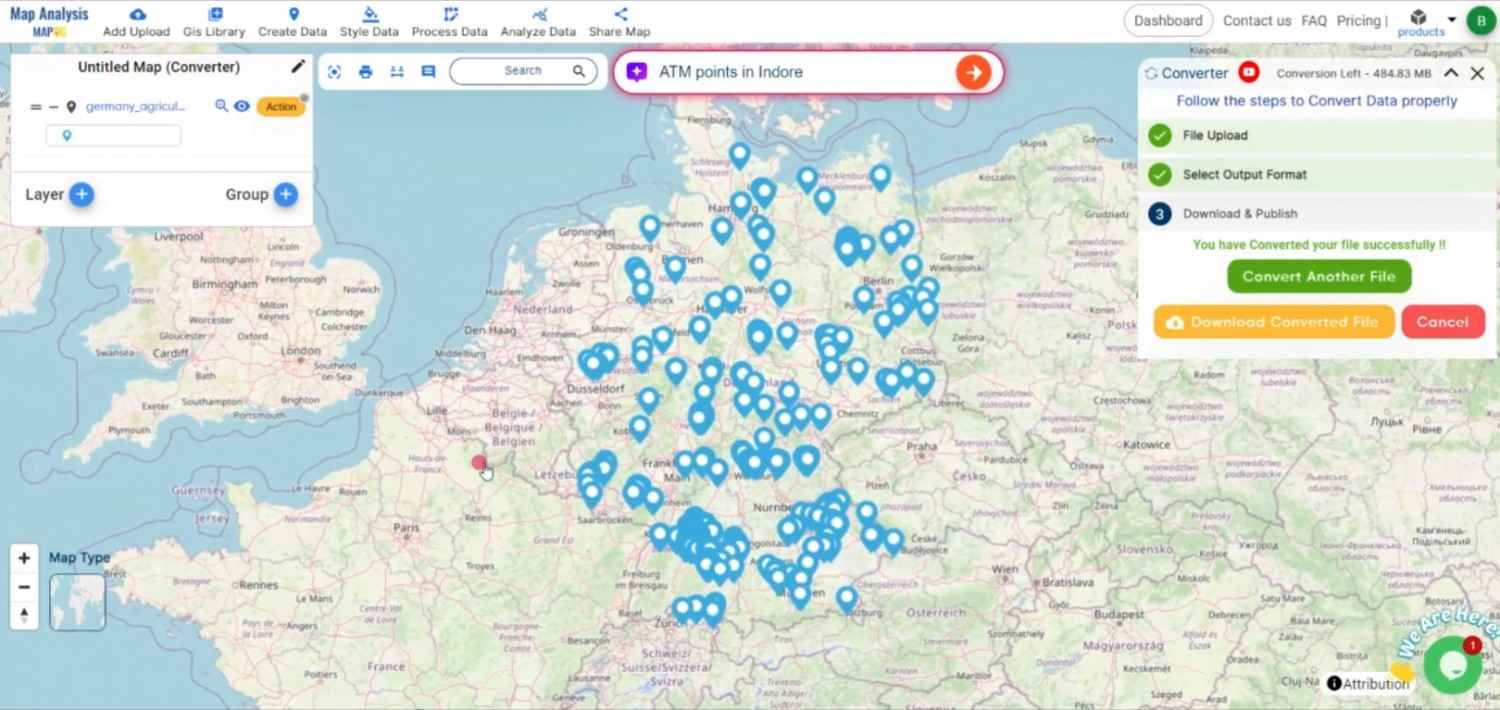
Step 5: Review and Download the GPKG File
Once the conversion is complete, review the resulting GPKG file to ensure all geographic and attribute data was accurately converted. If everything looks correct, download the GPKG file, which is now ready for use in various GIS applications.
Conclusion:
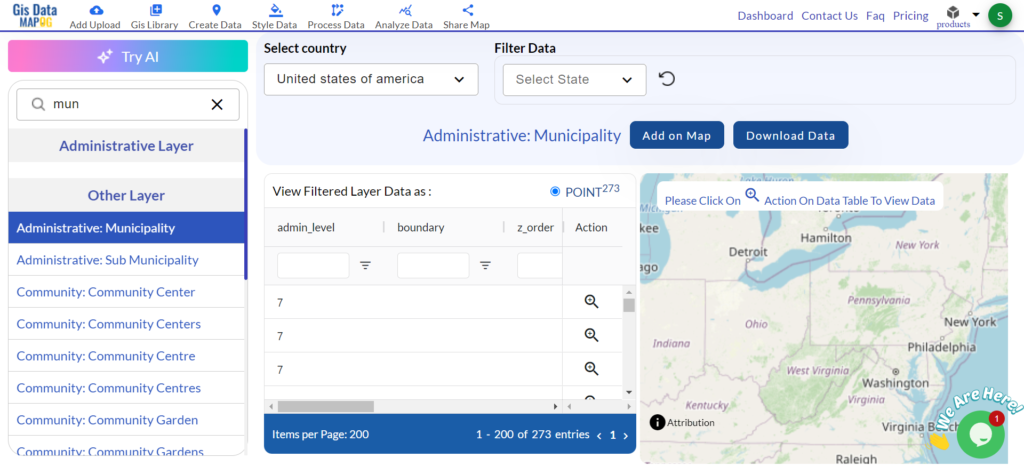
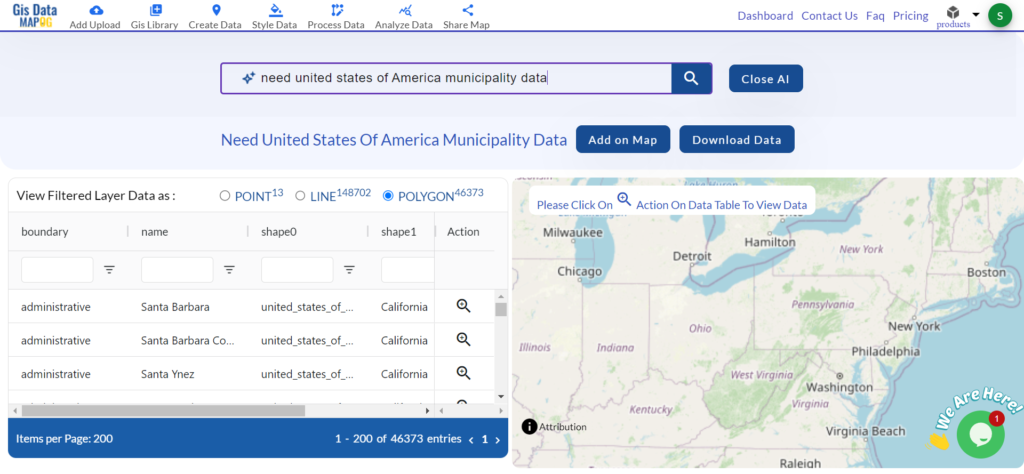
The MAPOG Converter Tool streamlines the process of converting CSV files to GPKG, making it easier to integrate and store geospatial data efficiently. By following these steps, you can transform your tabular CSV data into a robust, spatially-enabled GPKG file for use in a variety of GIS platforms. If you need to download any data file in CSV or in any other formats like SHP, TOPOJSON, GML. visit GIS DATA. Here we have 900+ data layers for 200+ countries.
Feature Tool:
Story by MAPOG:
Story by MAPOG is perfect for users who wish to make their data come alive through interactive and visually appealing maps. It enables you to construct compelling stories by maps with multimedia elements such as text and images. Story by MAPOG makes it simple to create shareable content, whether you’re presenting research, exhibiting a project.
Here are some other blogs you might be interested in:
- Convert Online Gis data : KML to PDF file
- Converting KML to GeoTIFF , Online Gis Data Converter
- Converting KMZ to SHP : Online GIS Data Conversion
- Converting TopoJSON to SHP Online : GIS Data Converter
- Converting GeoJSON to TopoJSON with MAPOG
- Converting GeoJSON to CSV with MAPOG
- Converting KMZ to KML with MAPOG
- Converting GML to KML with MAPOG
- Convert KMZ to TopoJSON Online
- Converting KMZ to GeoJSON Online
- Convert KML to MID Online
- Online Conversion KML to MIF
- Convert KML to GML Online
- Convert KML to GPKG Online
- Convert KML to KMZ Online
- Convert GML to SHP Online
- Convert KML to GML Online
- Convert KML to GeoJSON file online
- Convert KML to TopoJSON Online
- GeoJSON to GeoTIFF – Vector to Raster Conversion
- KML to GeoTIFF – Vector to Raster Conversion
- SHP to GPX / GPS
- Convert GeoJSON to KML
- Convert Geojson to MIF MapInfo file
- GeoJSON to Shapefile
- Convert GML to CSV
- Convert KMZ to GPX