Data science and machine learning are the latest trend in education. This is due to the high demand for skilled labour in analytics and programming to extract information from raw data. In today’s world, almost all industries from social media to national security relies on data and information for decision making. Geoinformatics and location intelligence also plays an important role in research and business pointing out the relevance of geospatial data.
IGISMap(Now named as MAPOG) contains the collection of highly accurate GIS data representing several countries. This data collection contains administrative boundaries such as country, states, districts, roads, railway lines, and other geographical features such as roads, farmlands, waterbody, etc. These data are made available for 30+ countries, and 51 US states, available in point, line, and polygon shapes based on the spatial structure. These data are collected from official sources of the respective countries and other websites of trusted international organizations
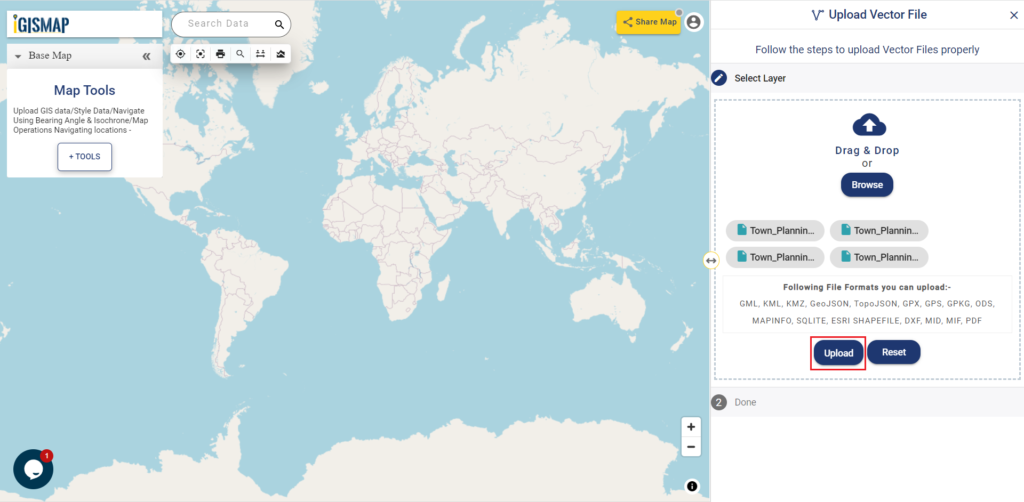
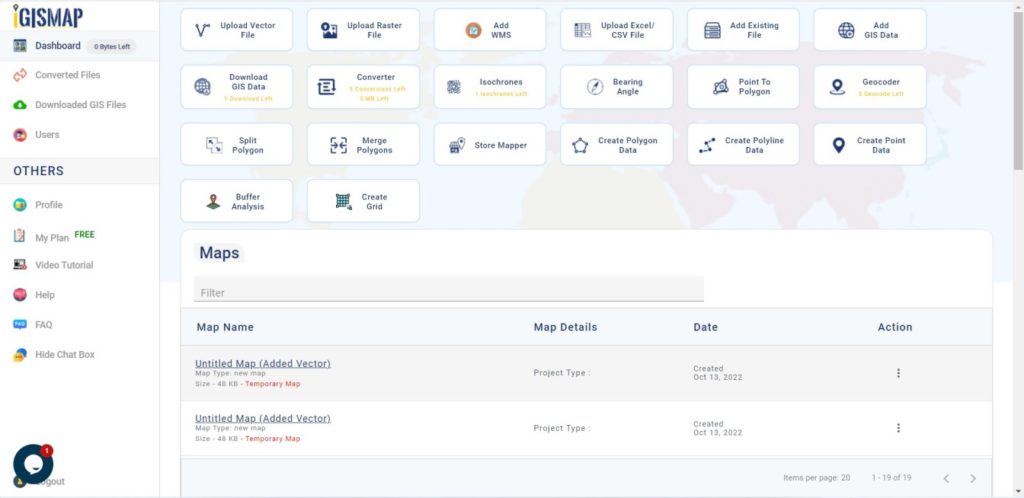
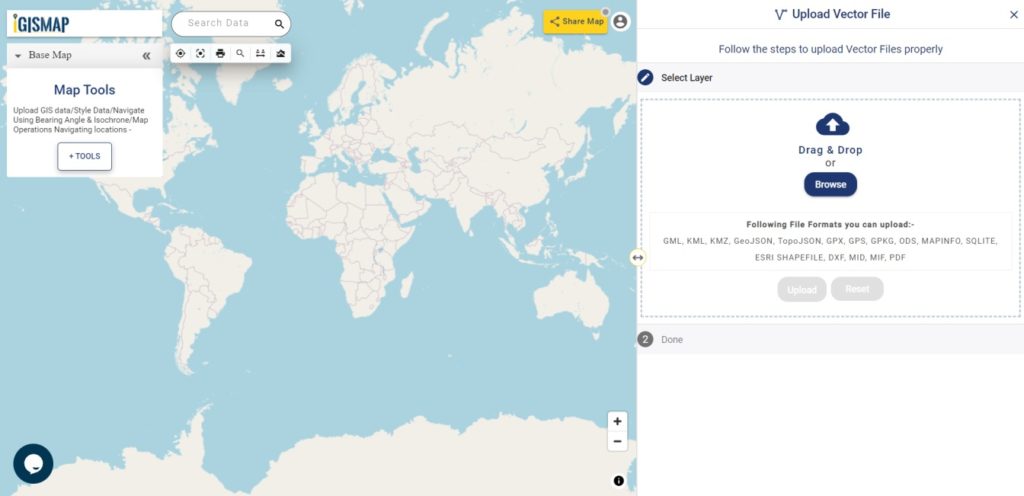
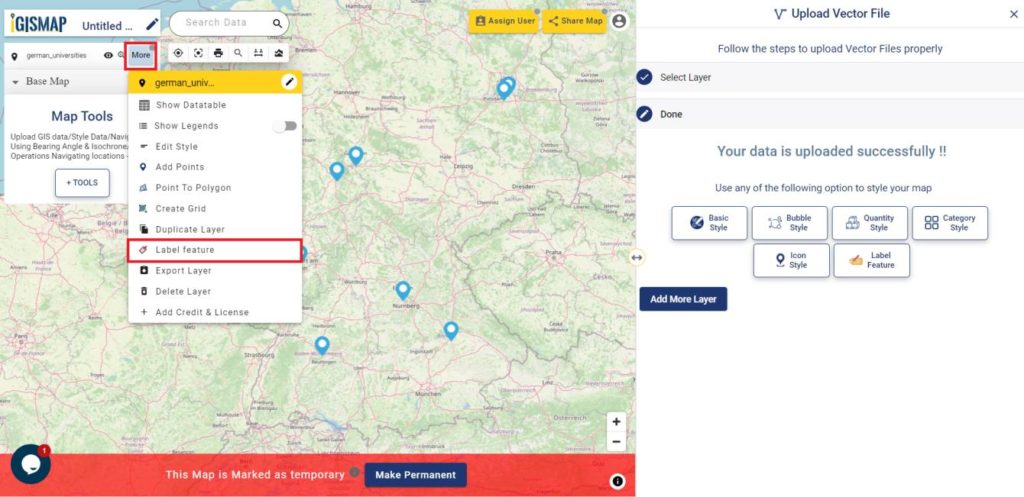
There are two IGISMap tools (MAPOG Tools) to access these data – Add GIS Data and Download GIS Data tools. This article will demonstrate the usage of Add GIS Data tool by downloading polygon, polyline and point.
Click https://mapanalysis.mapog.com/add-gis to open Download GIS Data tool.
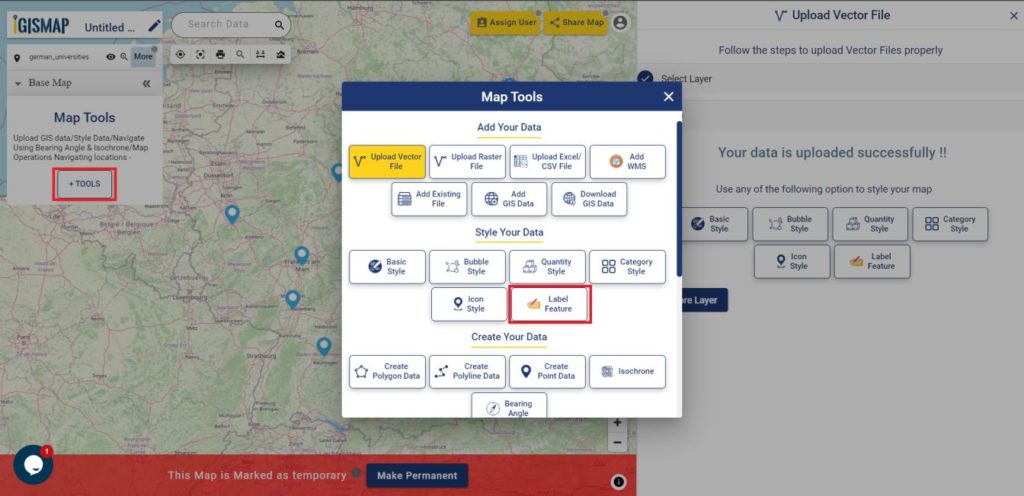
Add GIS Data Tool
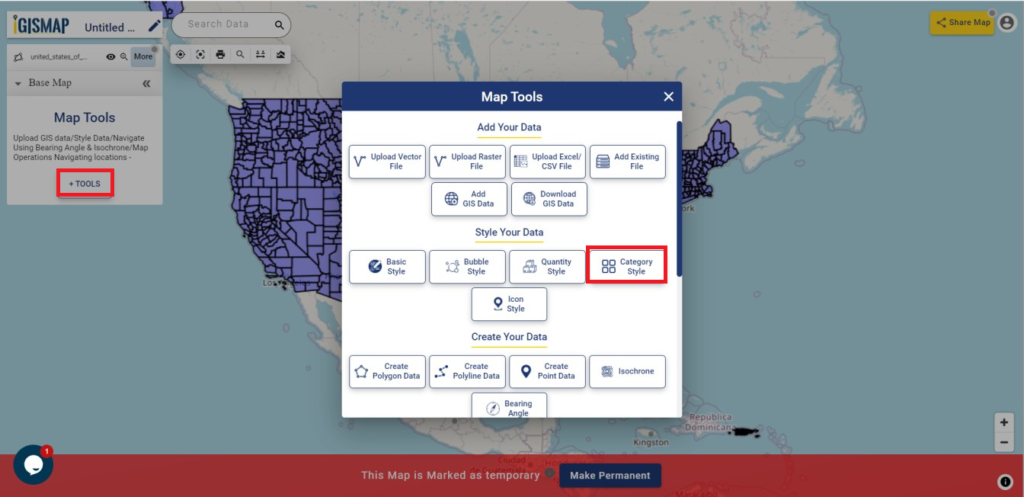
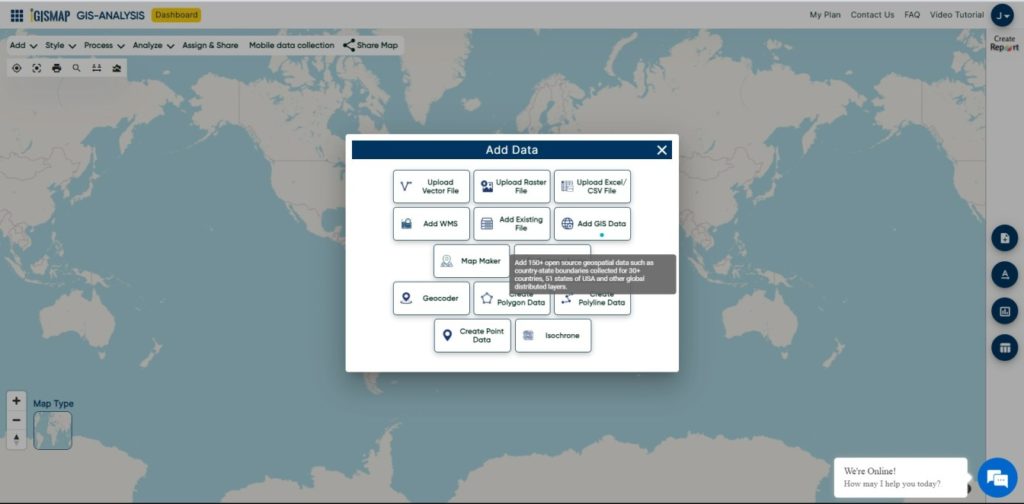
The Add GIS Data tool of IGISMap provides a list of GIS data for several countries and US states. Users of IGISMap can add these data in maps and perform GIS operations for free after selecting the preferred country.
Click https://mapanalysis.mapog.com/add-gis to open Add GIS Data tool.
Add Polygon Data
First lets try to add a polygon GIS data from IGISMap using Add GIS Data tool.
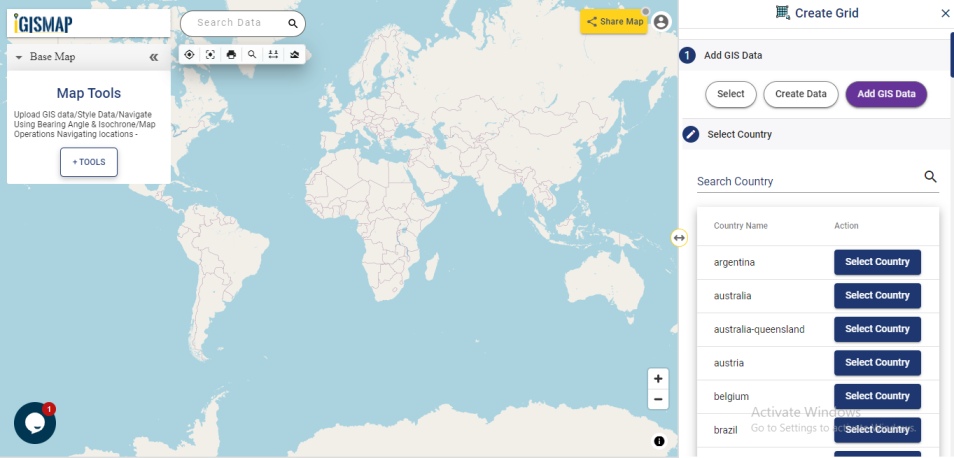
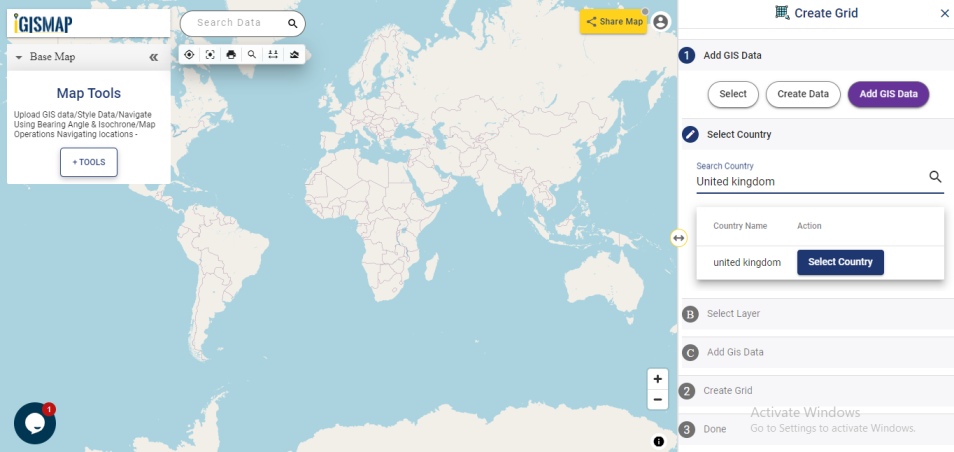
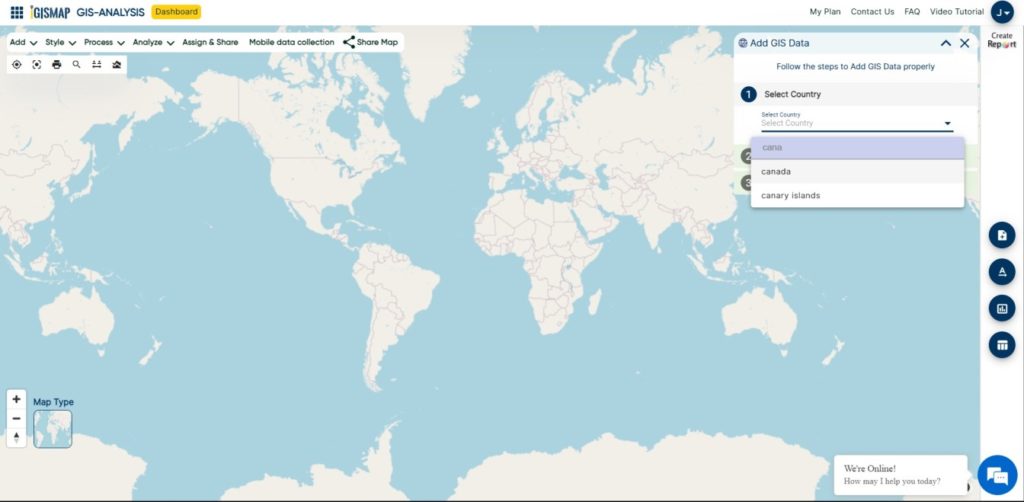
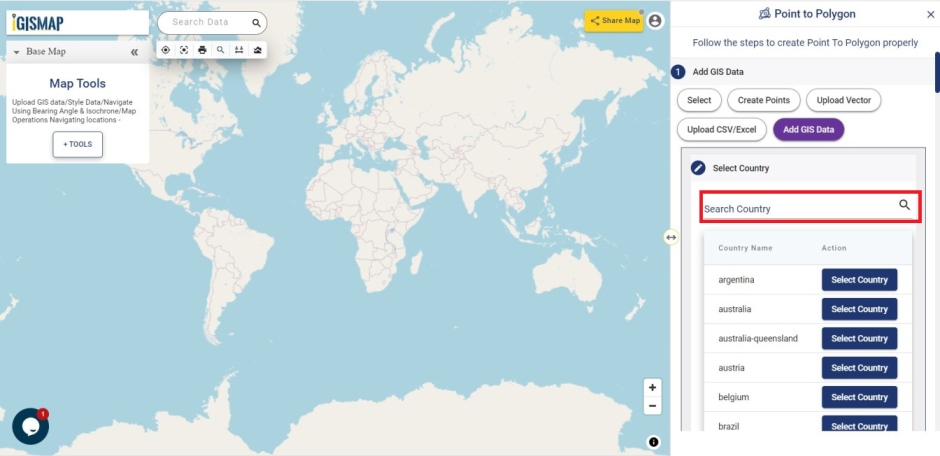
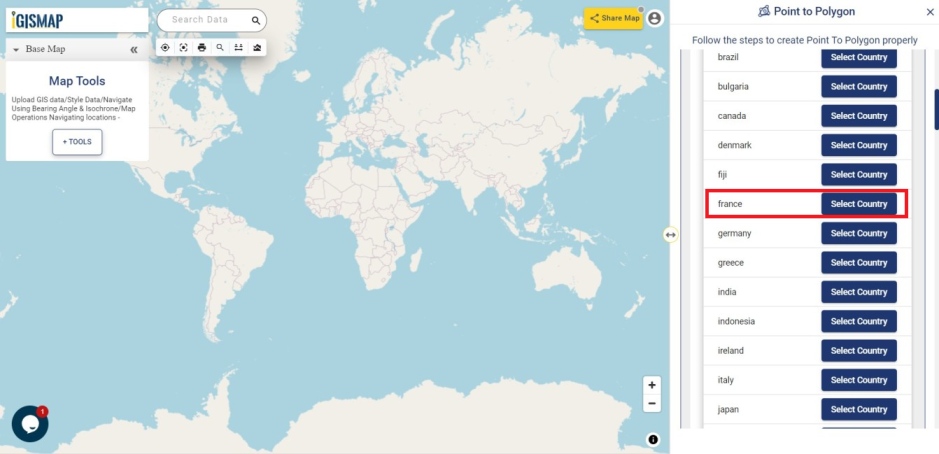
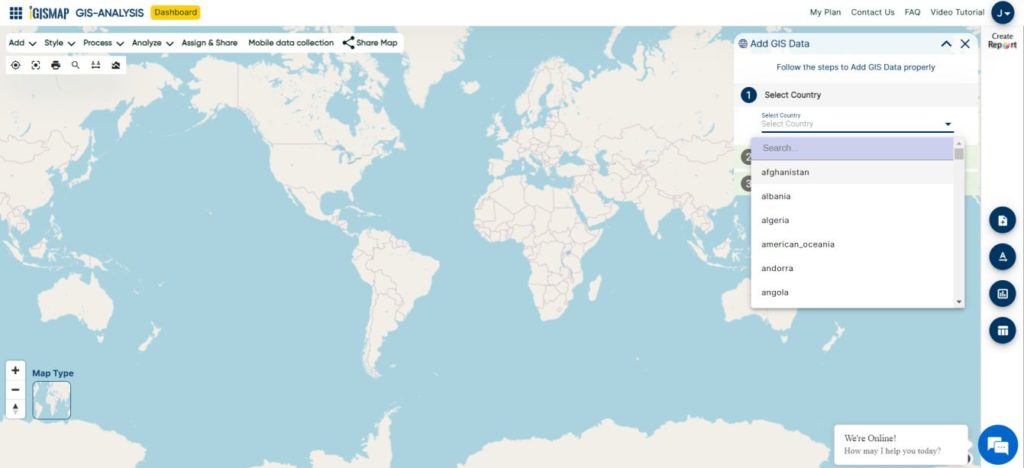
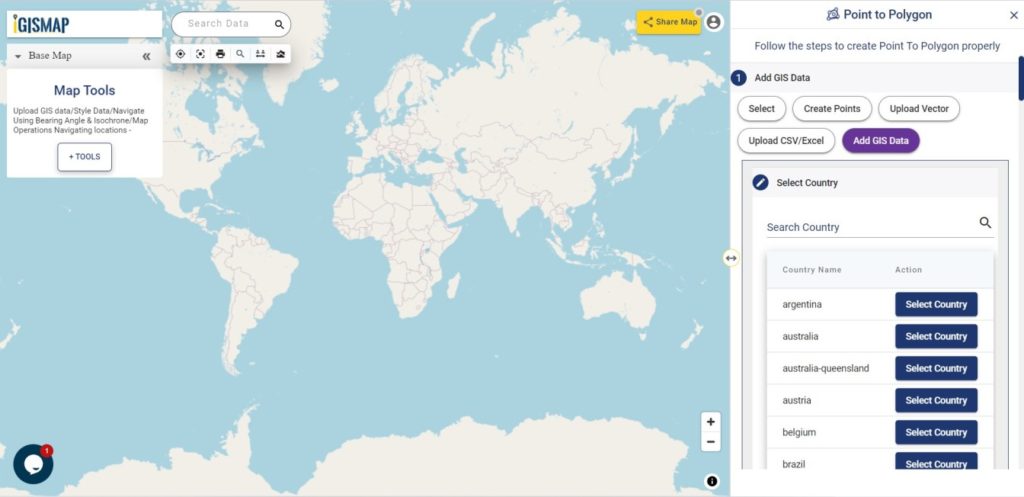
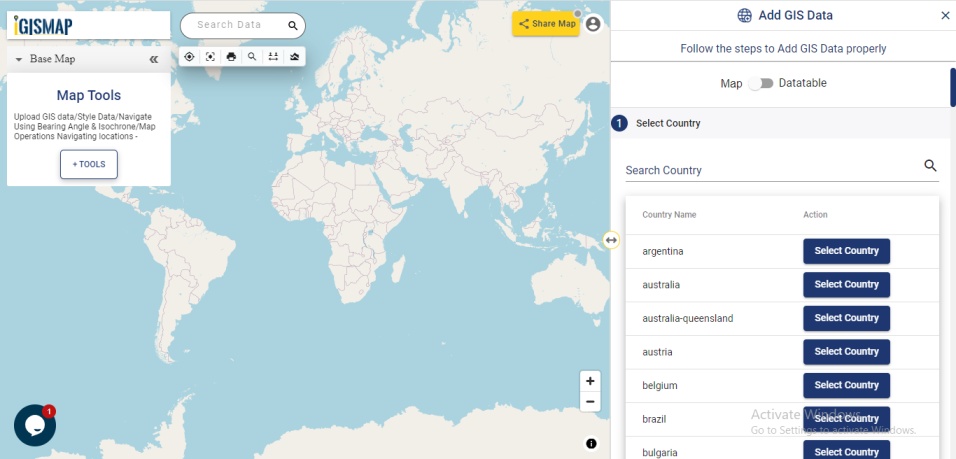
Select Country
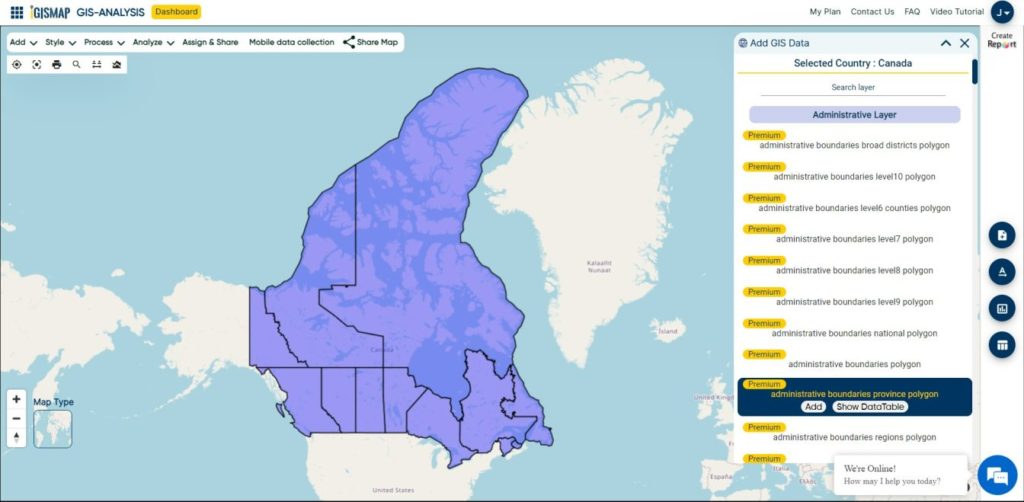
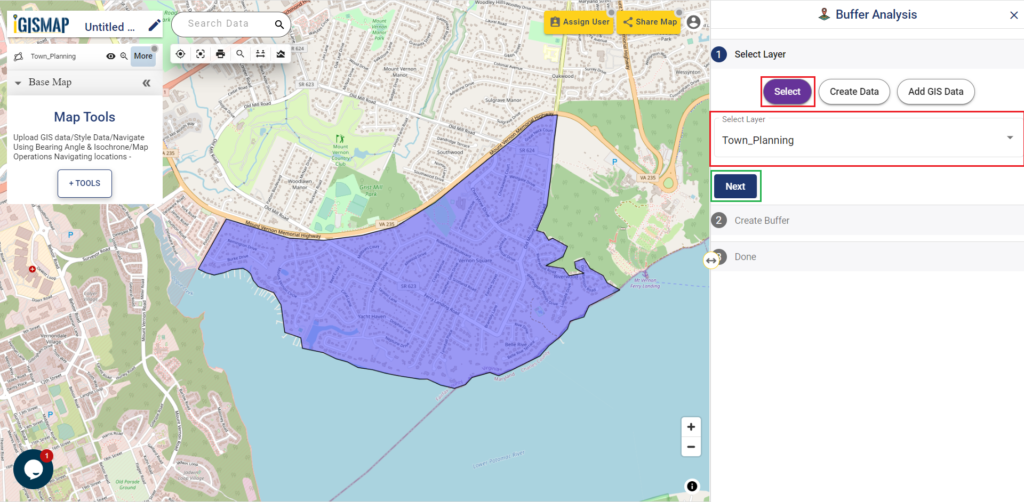
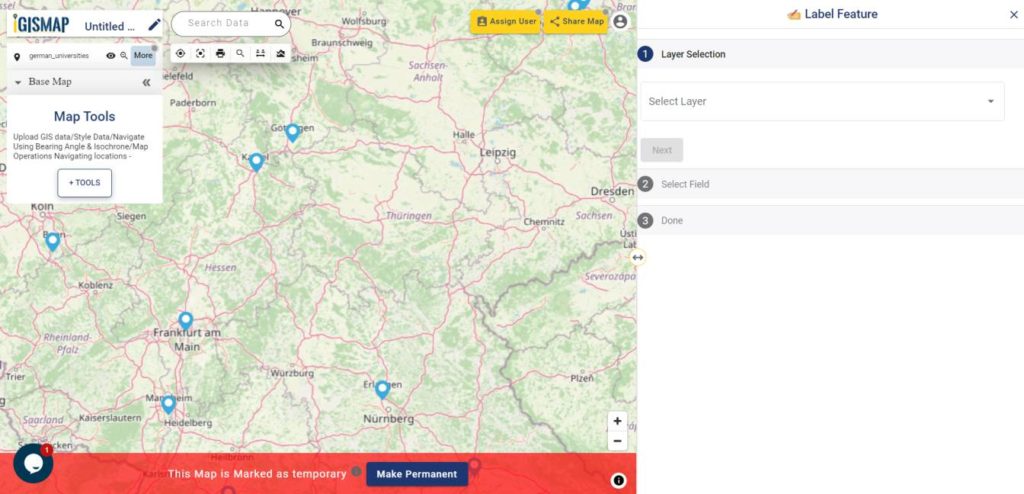
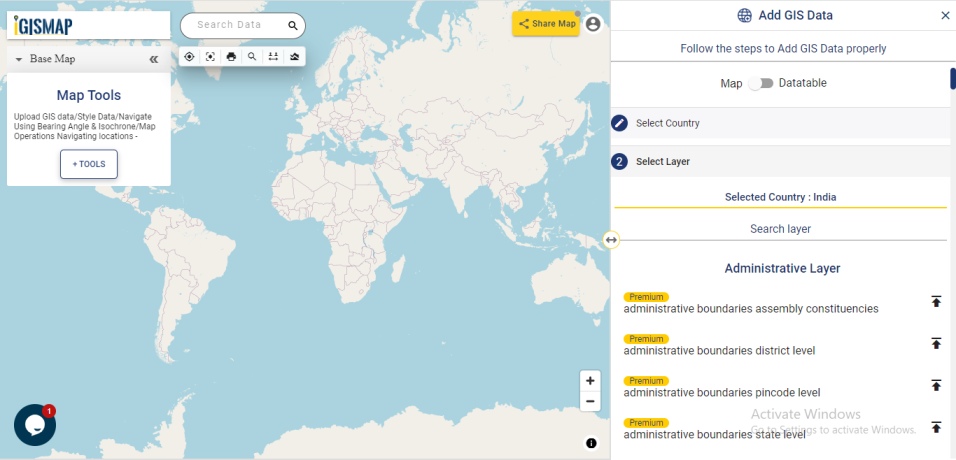
Select Country is the first step in Add GIS Data tool. In the Select Country step, countries are listed. You can also search with the name of the data and filter the list. Here let us select Canada, which will then open step 2 for selecting the layer.

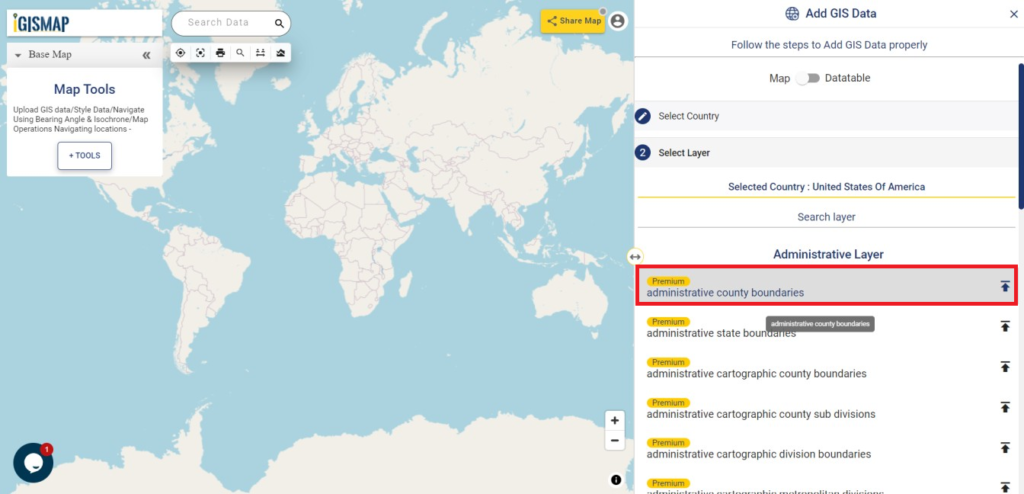
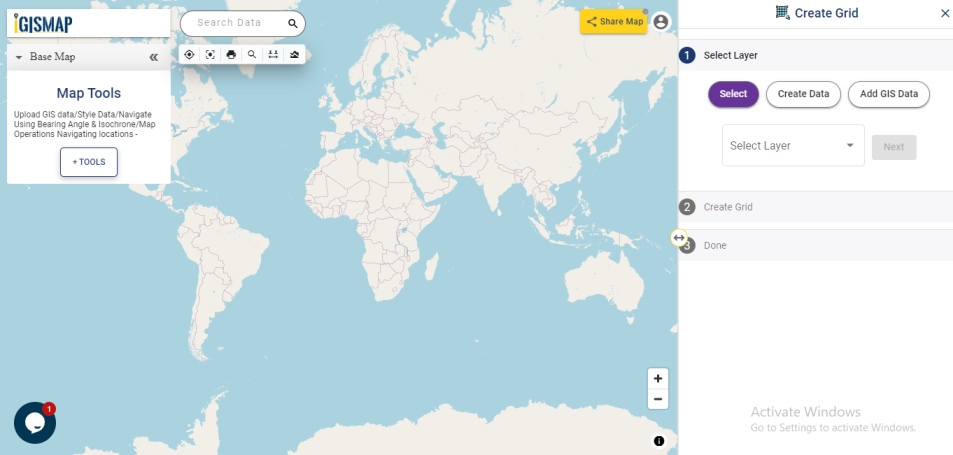
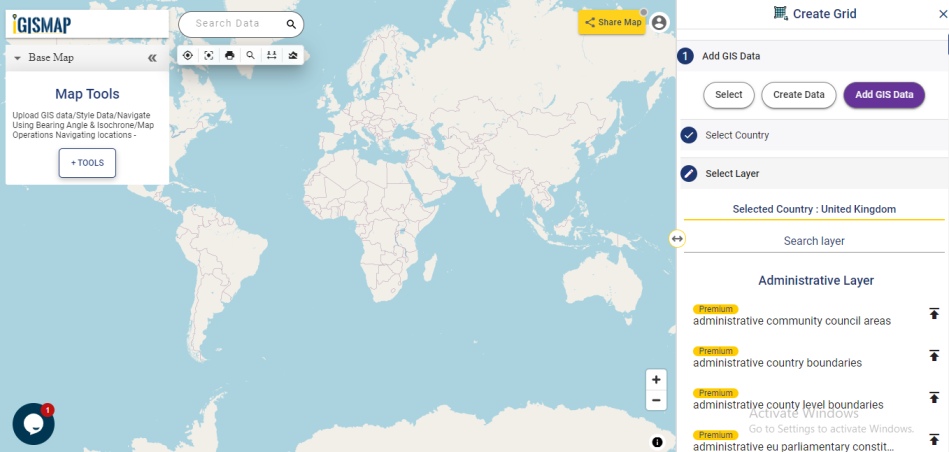
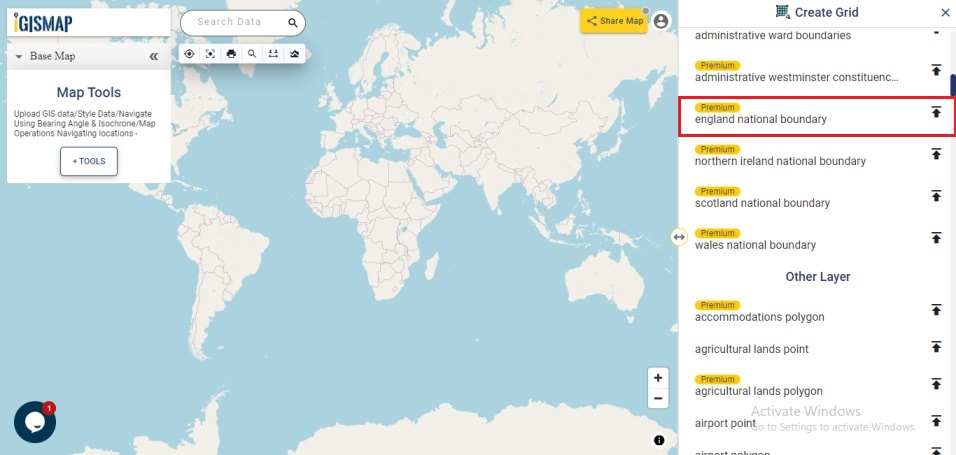
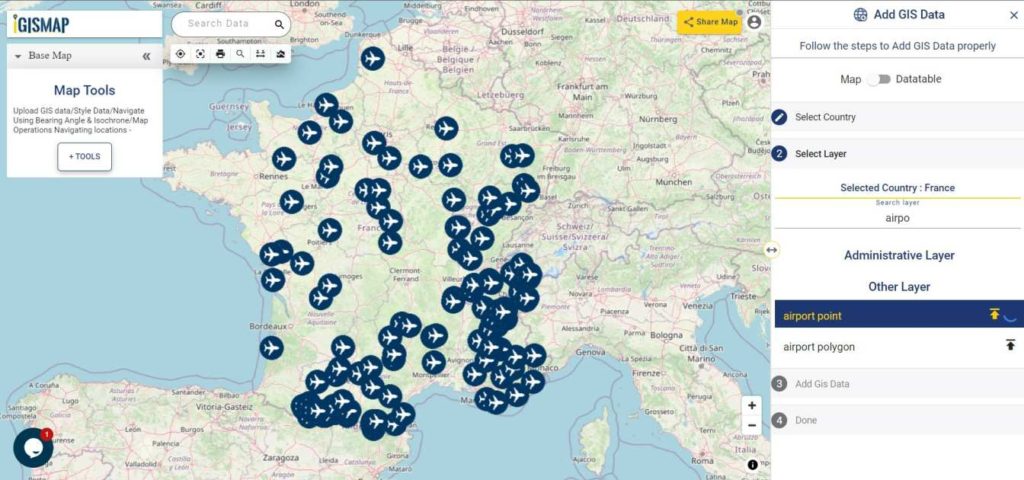
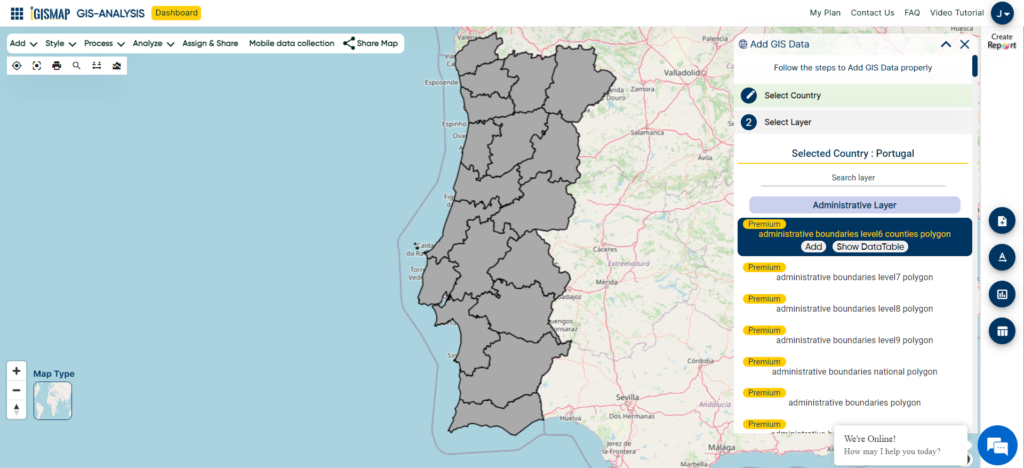
Select Layer
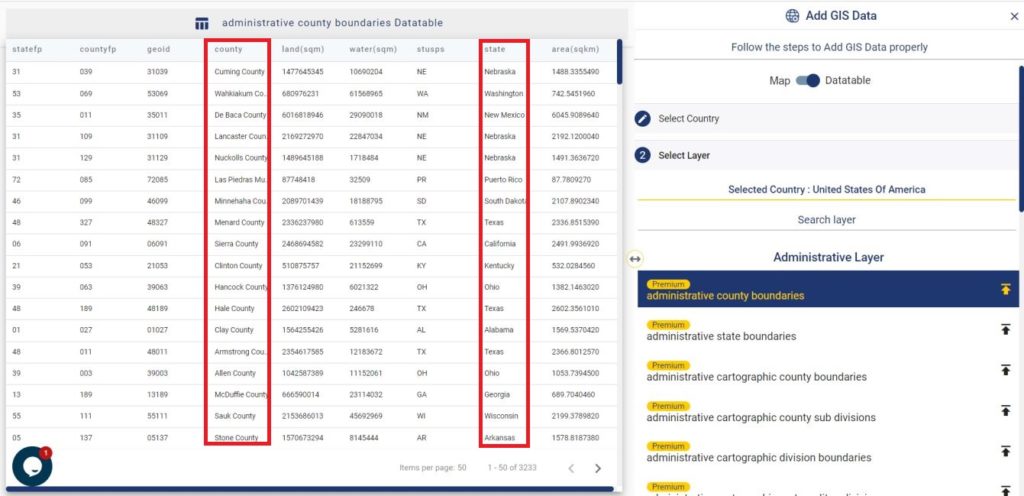
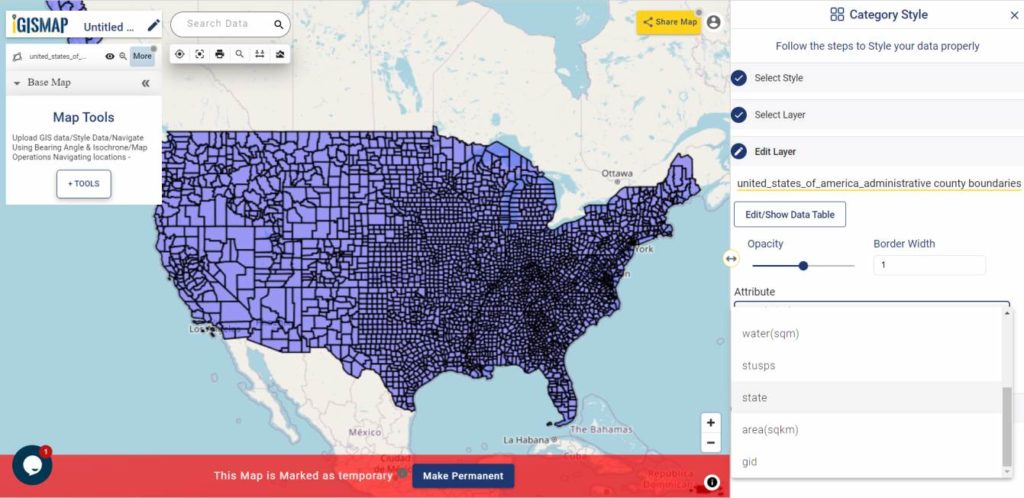
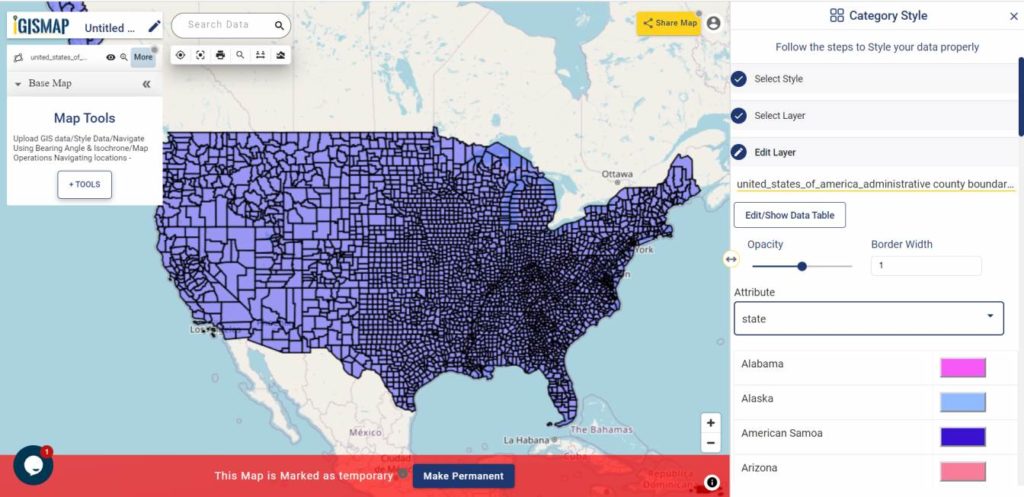
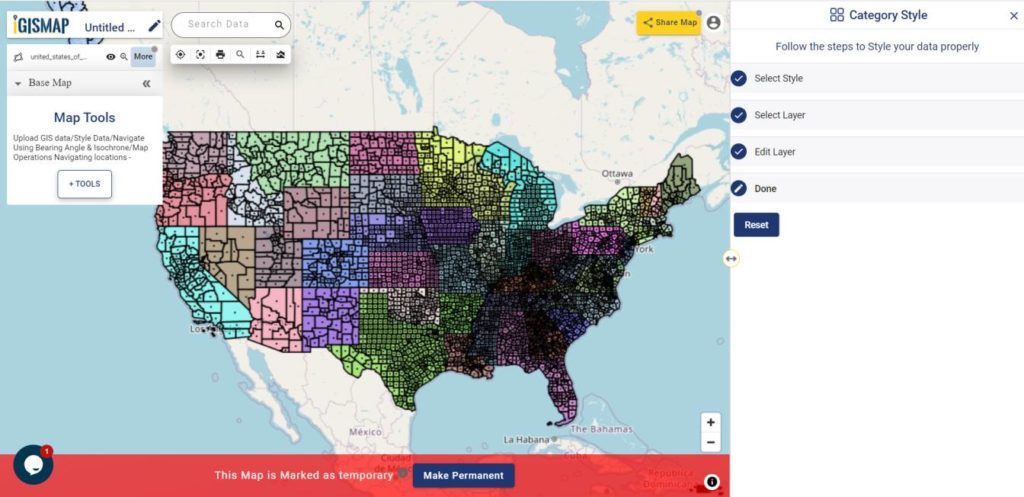
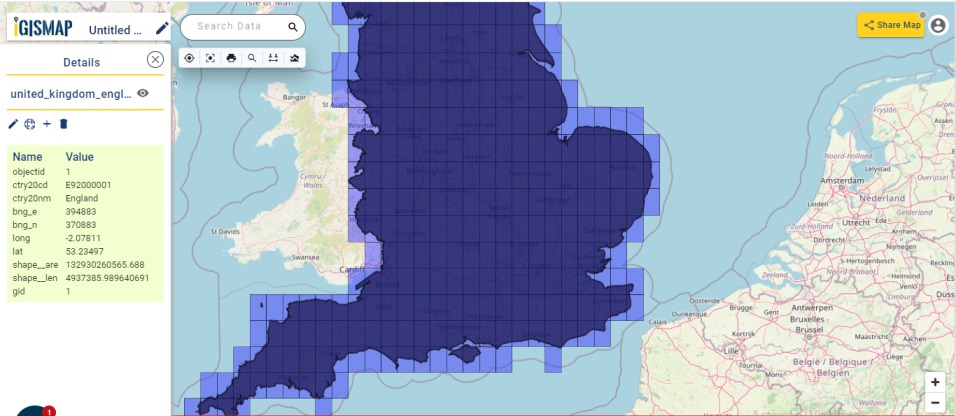
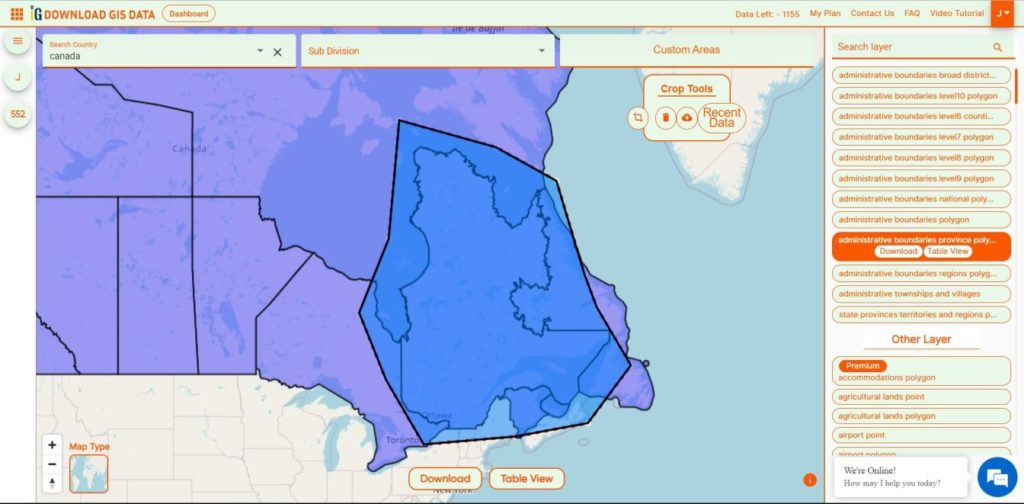
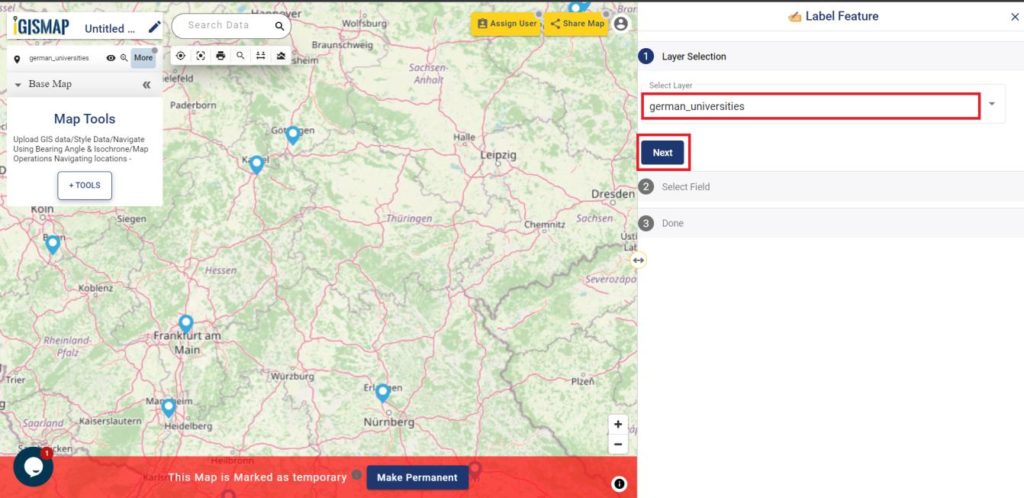
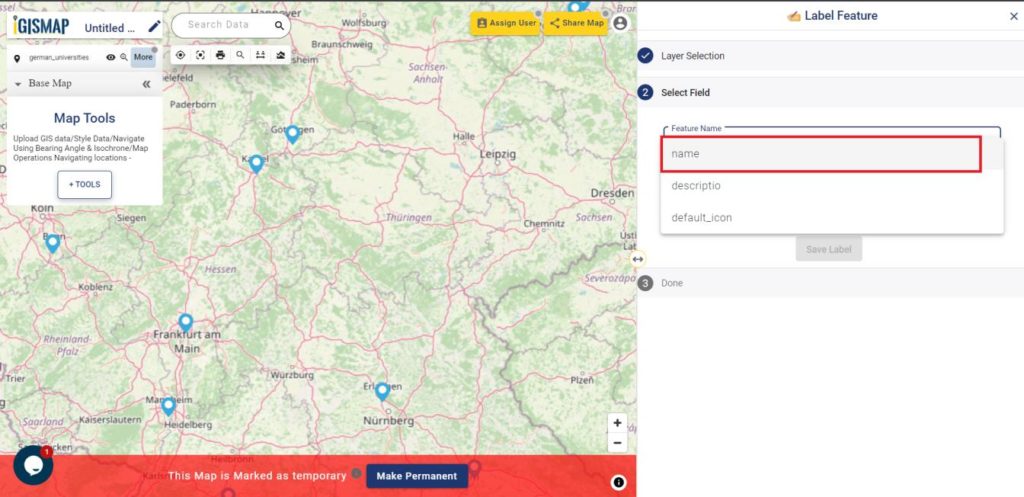
Step 2 is Select Layer that will open the list of GIS data available for the country you selected. You can also use Seach Layer bar to filter the list. Here we will select the Province boundaries of Canada. This data is available in the list as administrative province boundaries full extend. Select the required data to simply preview it on the map. Toggle to Datatable to view the attribute fields and values of each feature of the data.
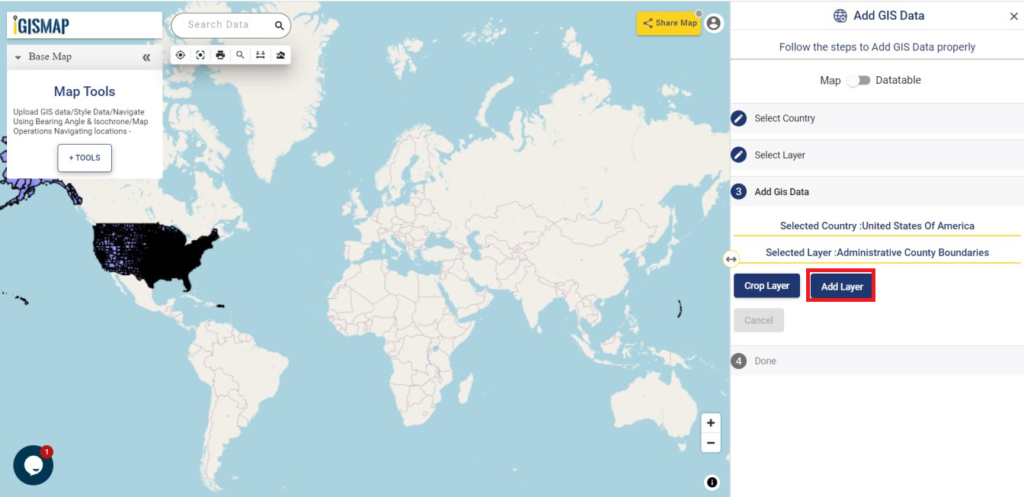
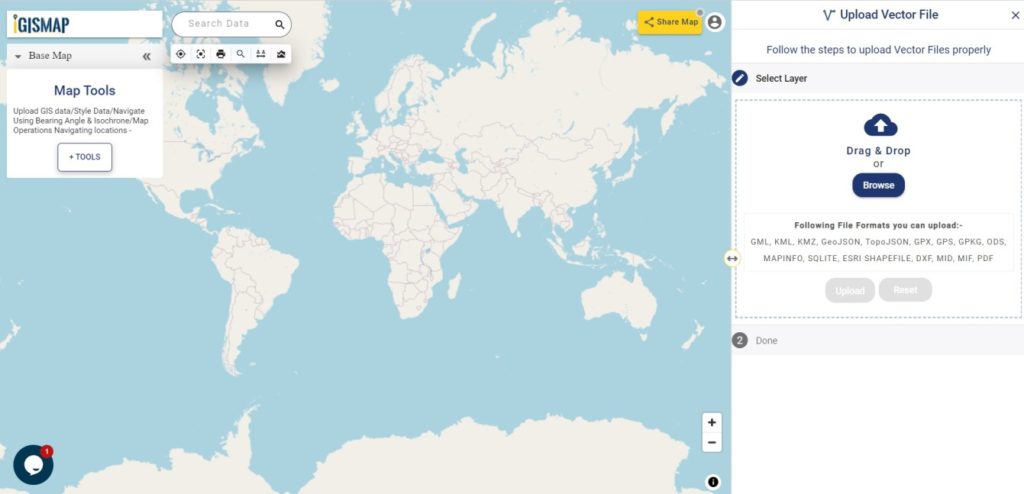
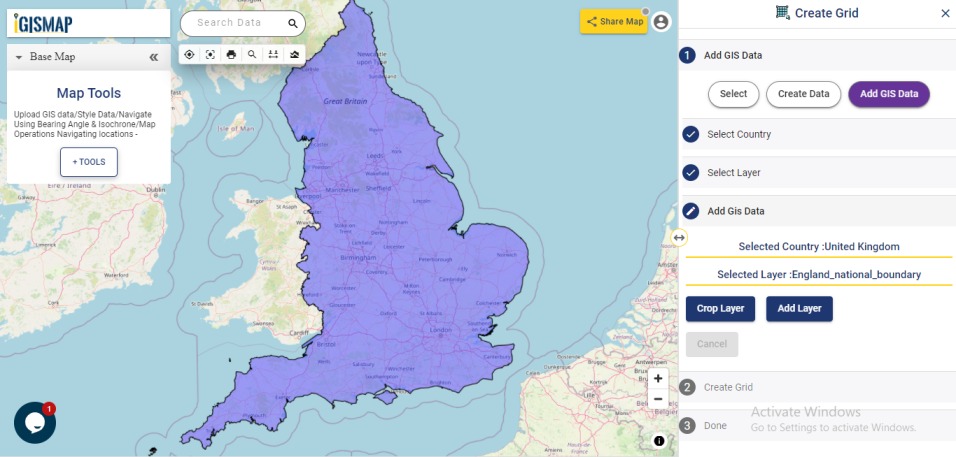
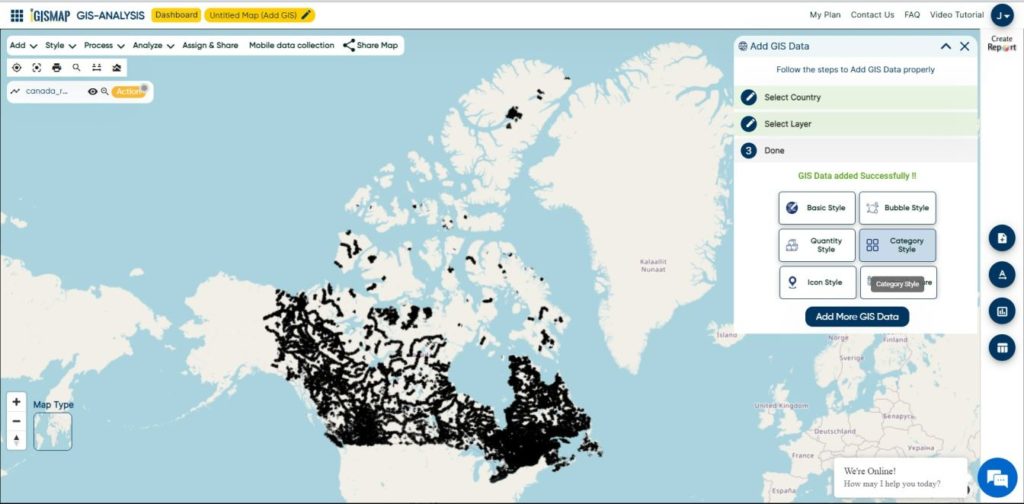
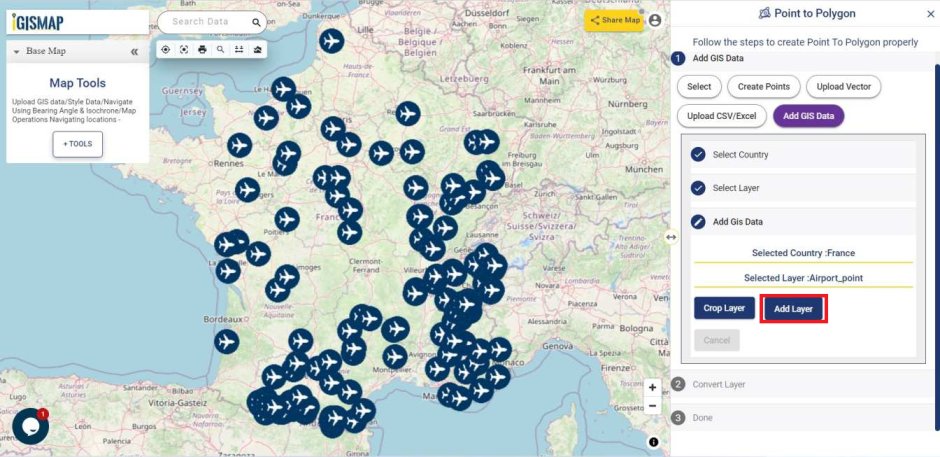
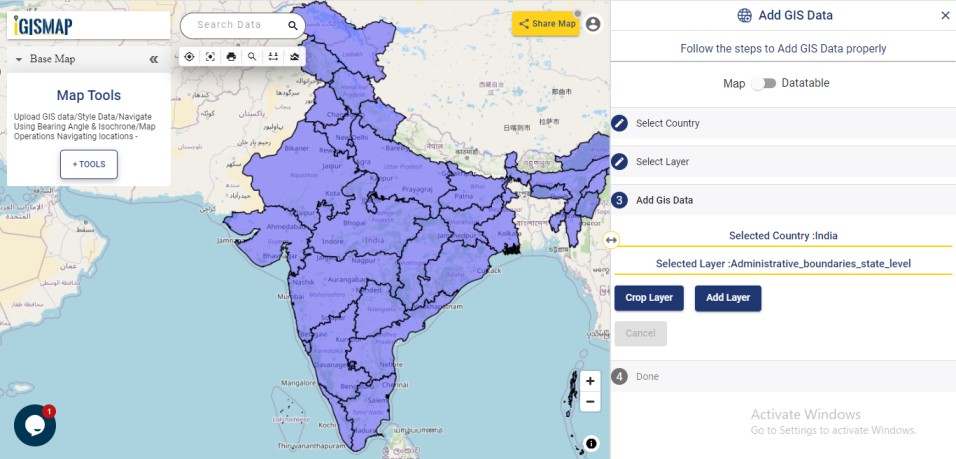
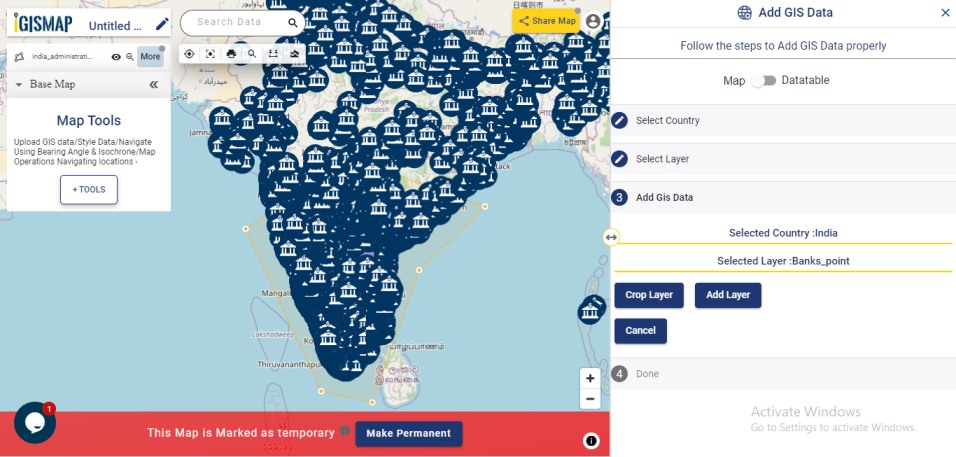
Crop Layer and Add GIS Data
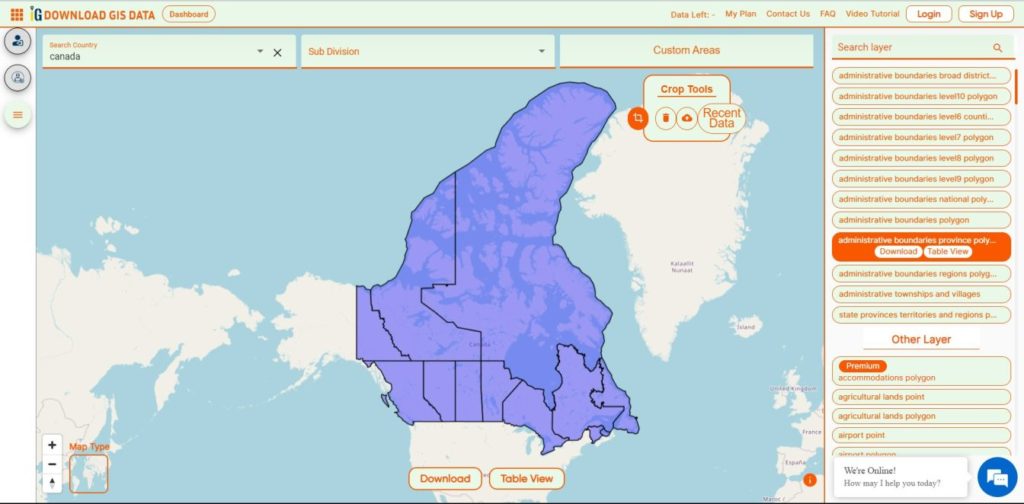
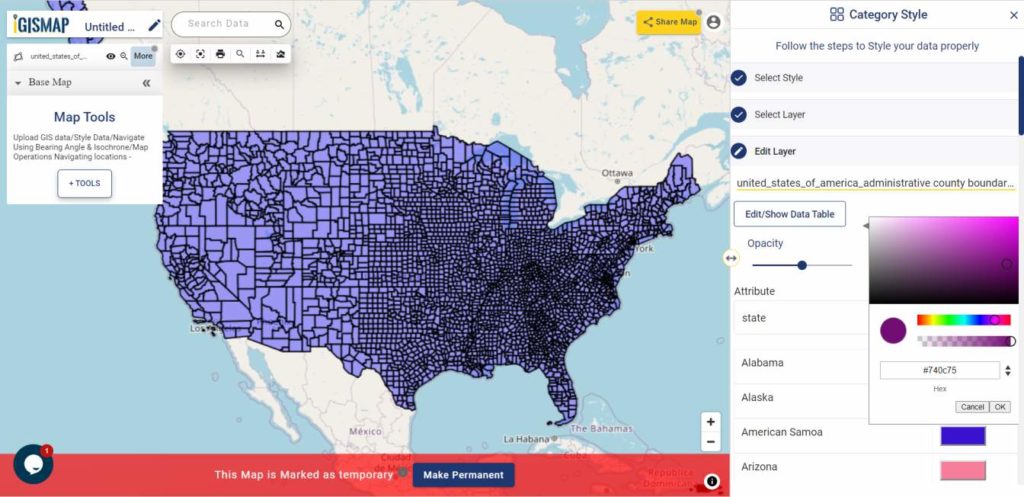
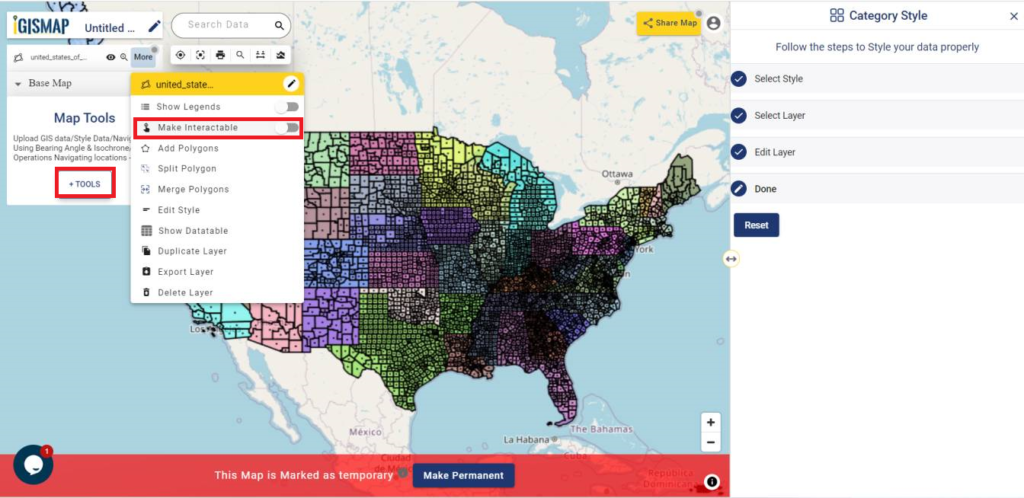
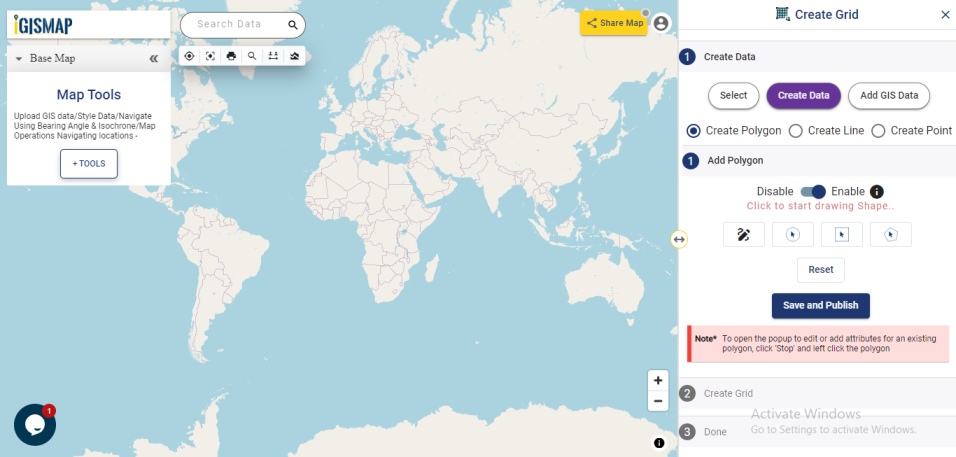
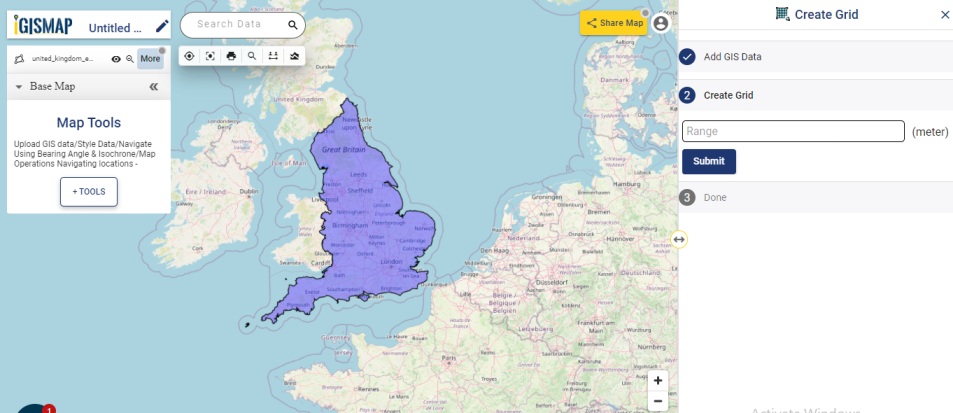
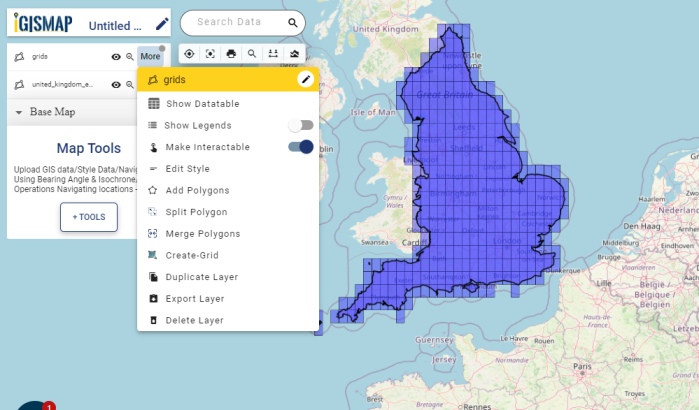
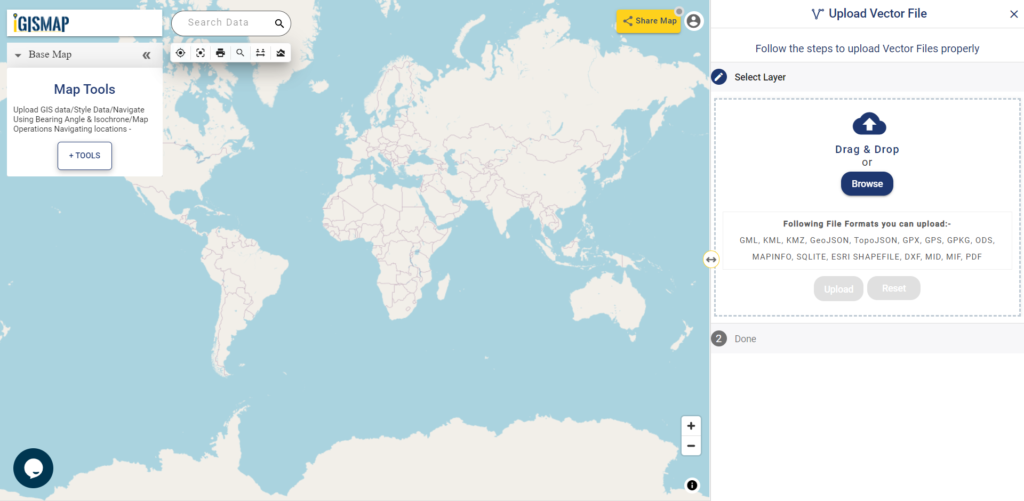
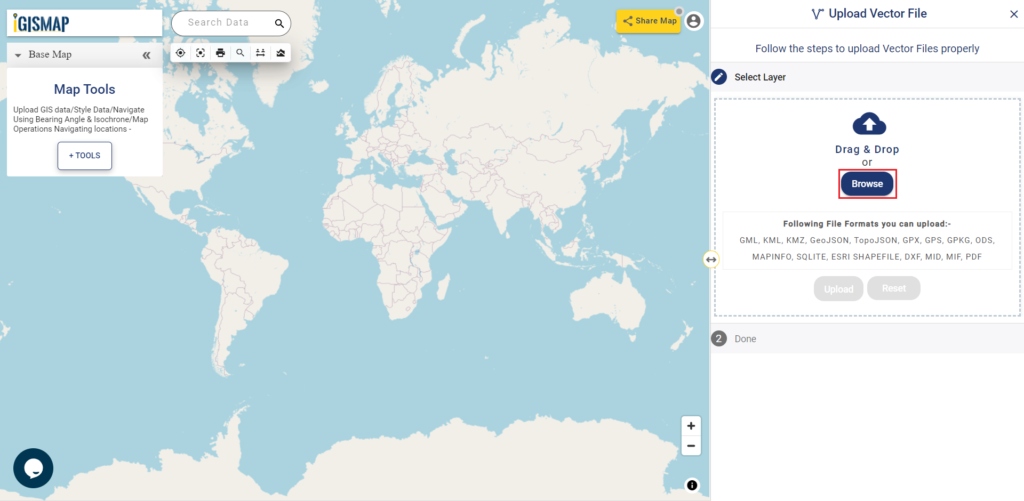
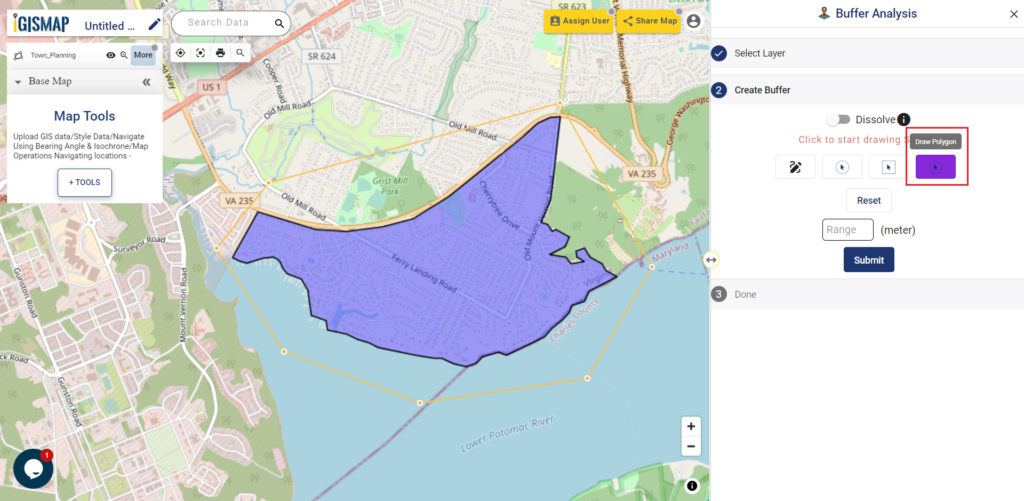
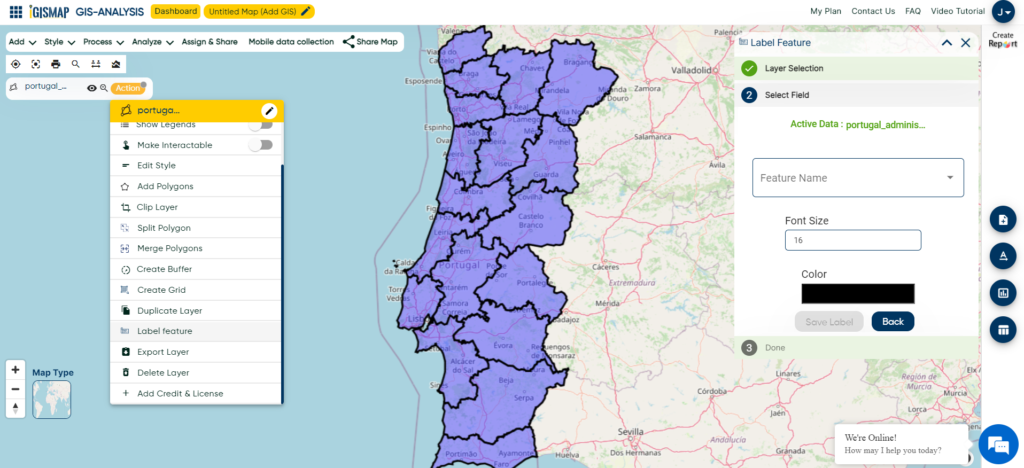
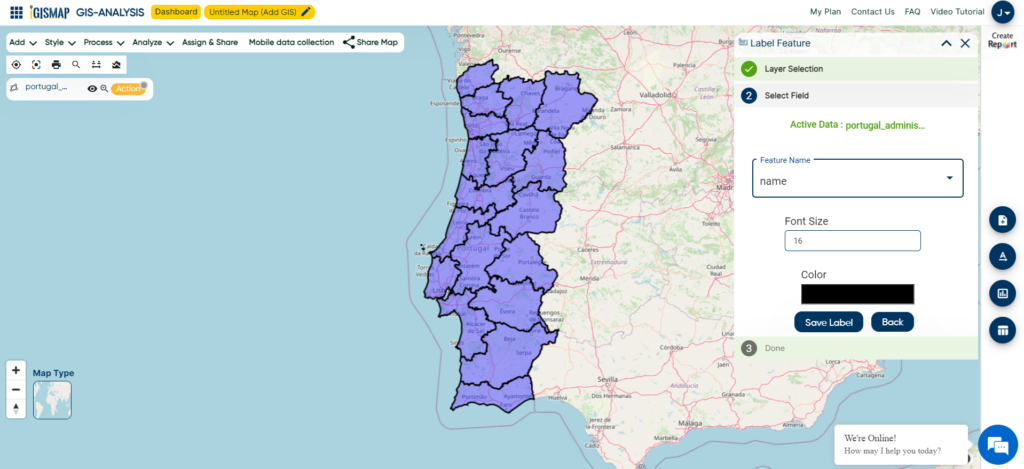
In Add GIS Data step, you can crop the data if necessary. Just Click on Option Custom Areas, Crop Layer. and Click to start the drawing required features to select for adding.
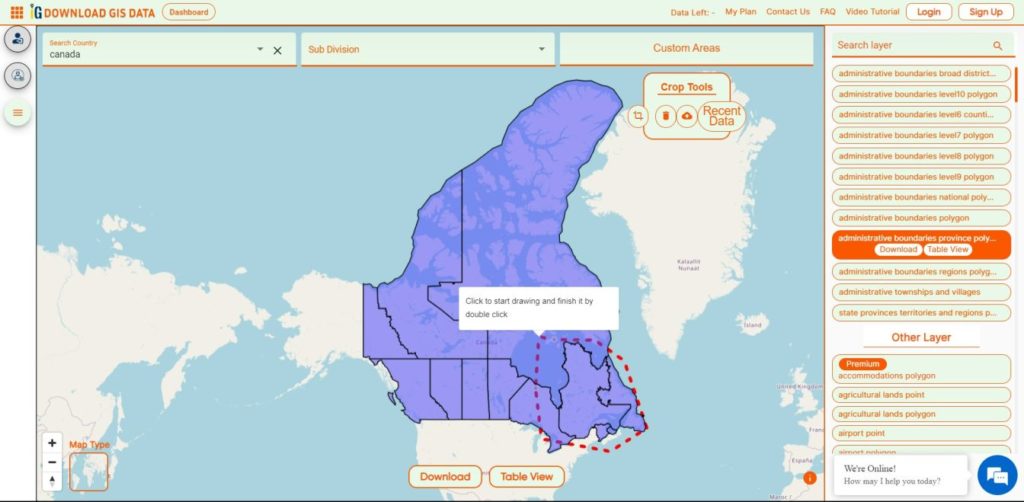
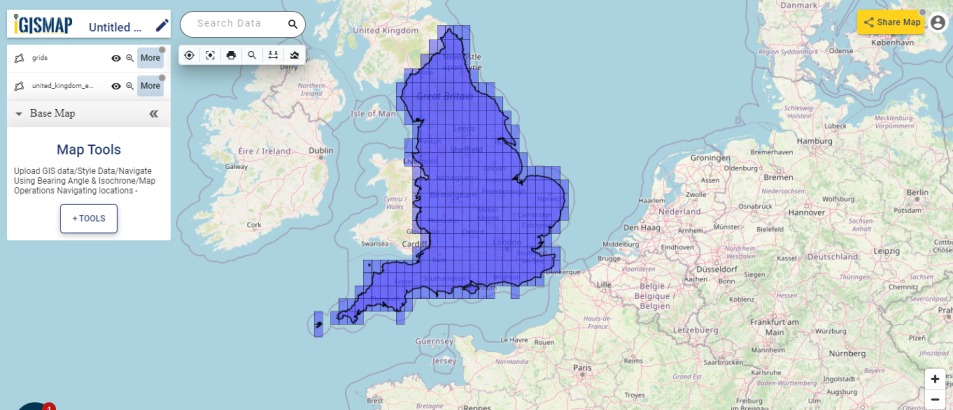
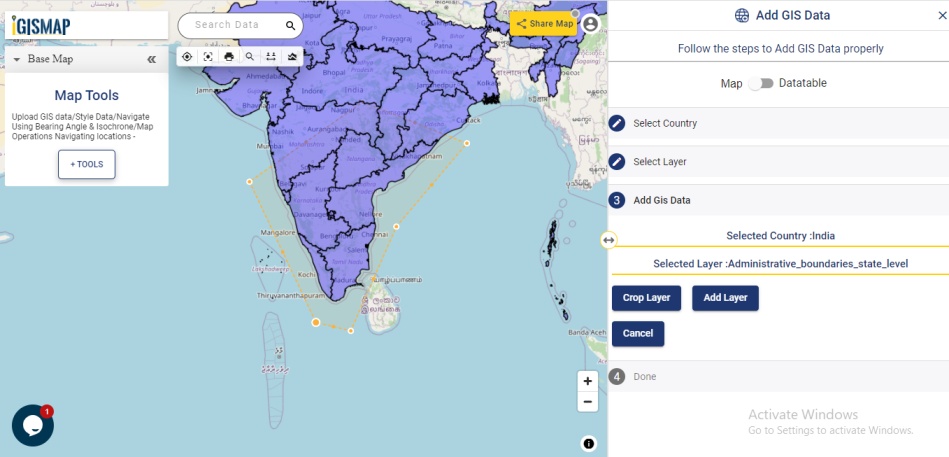
The Crop Layer option will allow you to draw a polygon on the map, such that all the features that are completely within the polygon will be selected for adding in the map. After selecting the Crop Layer option, draw a polygon that covers the polygon features of your interest.
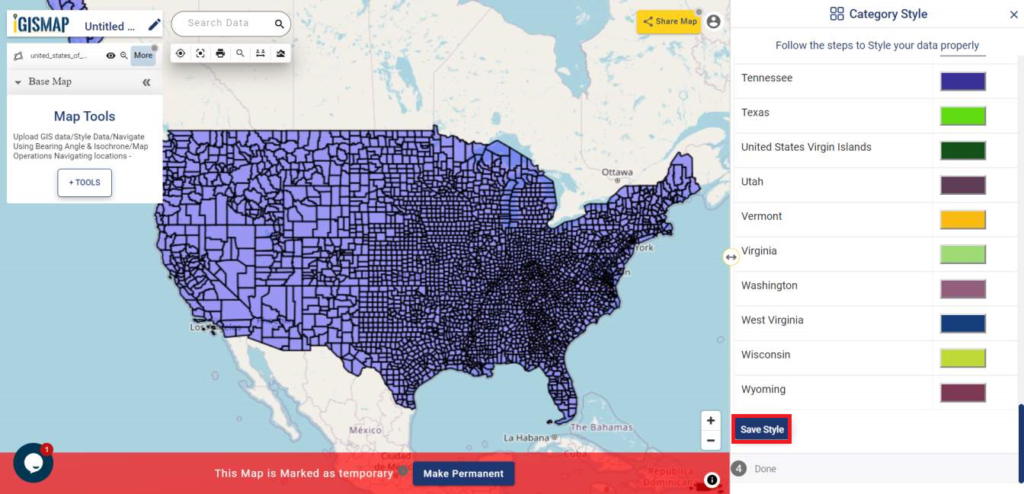
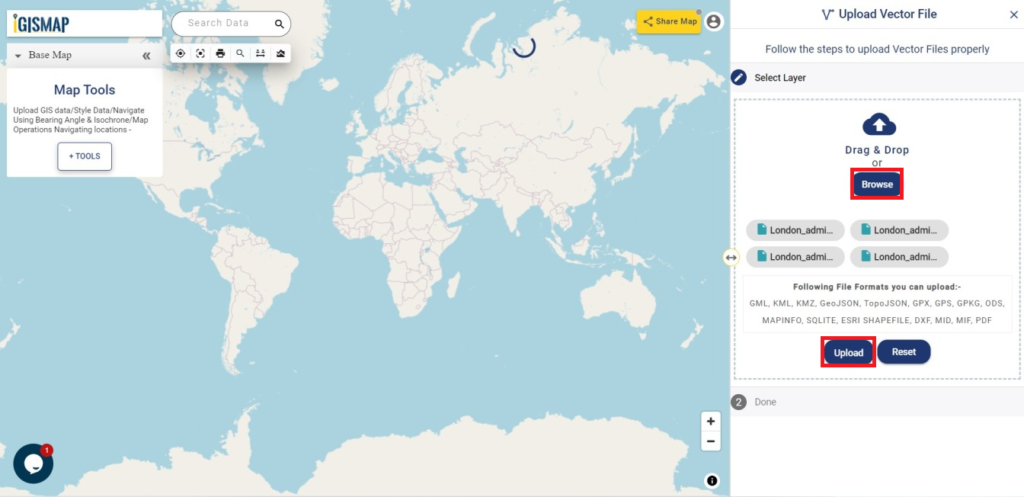
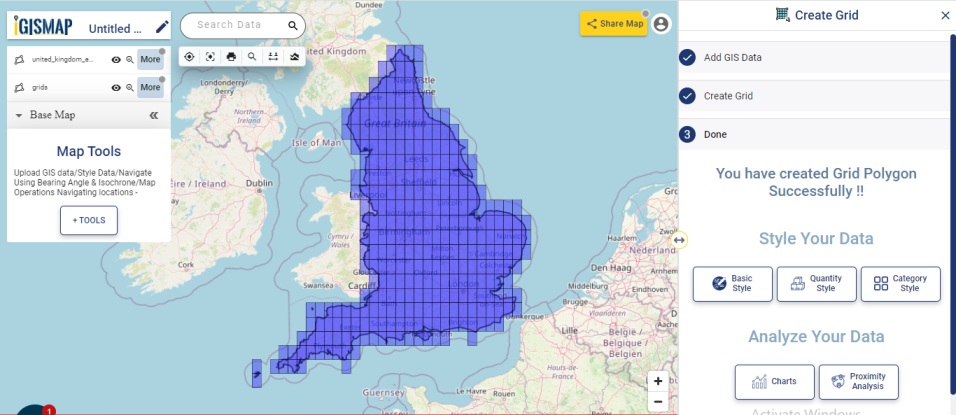
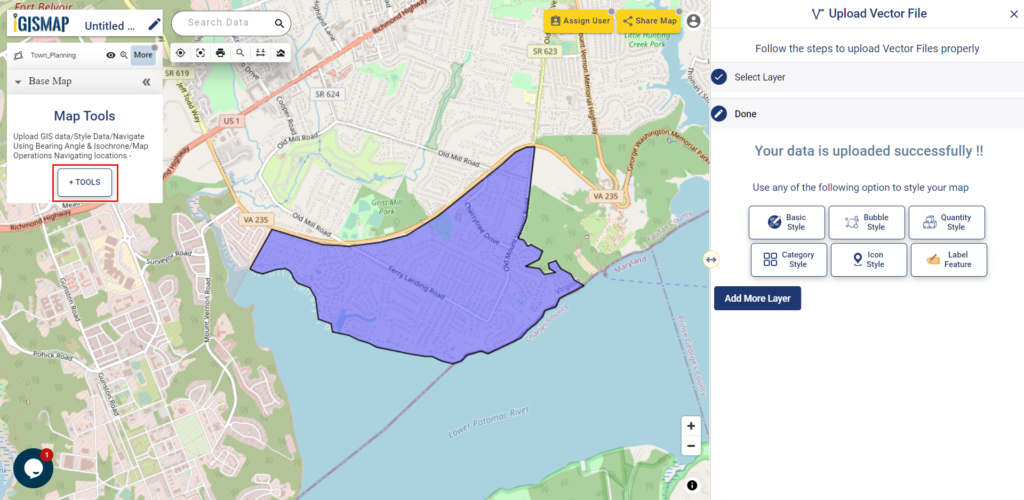
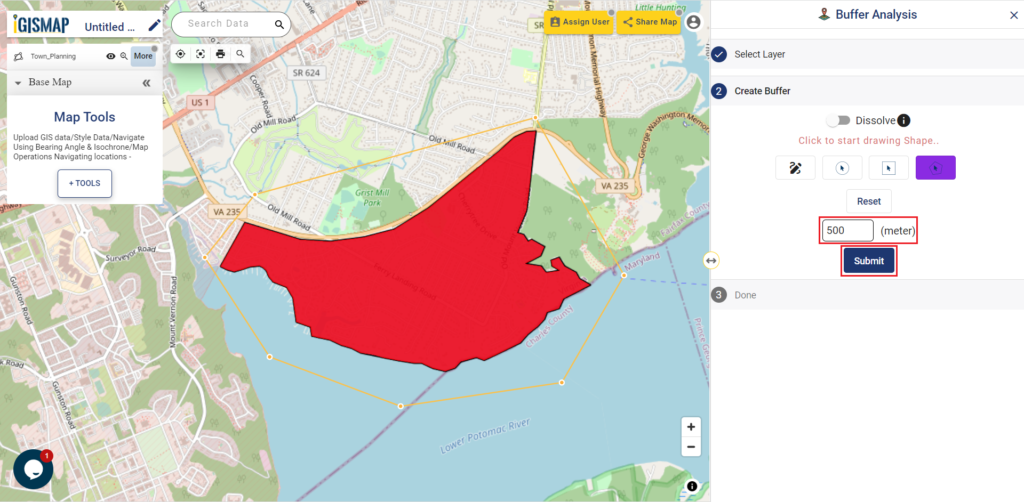
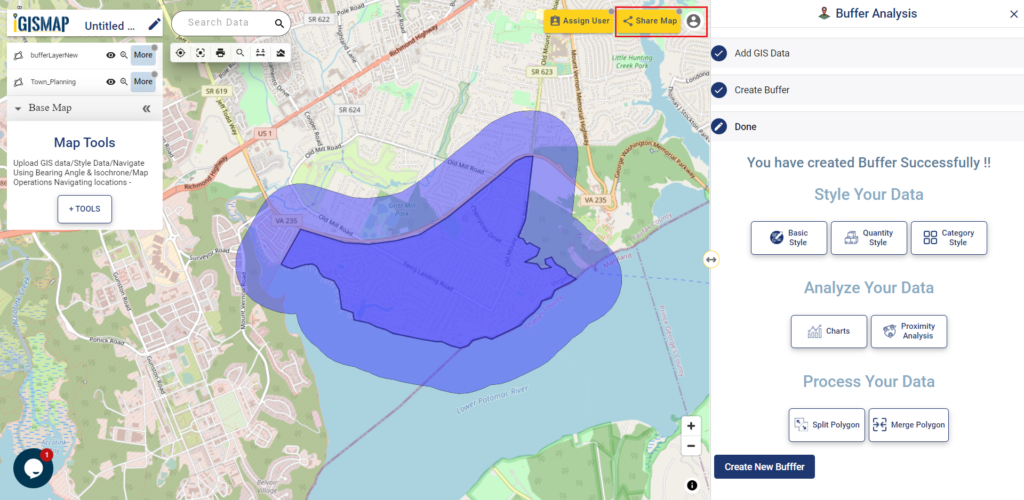
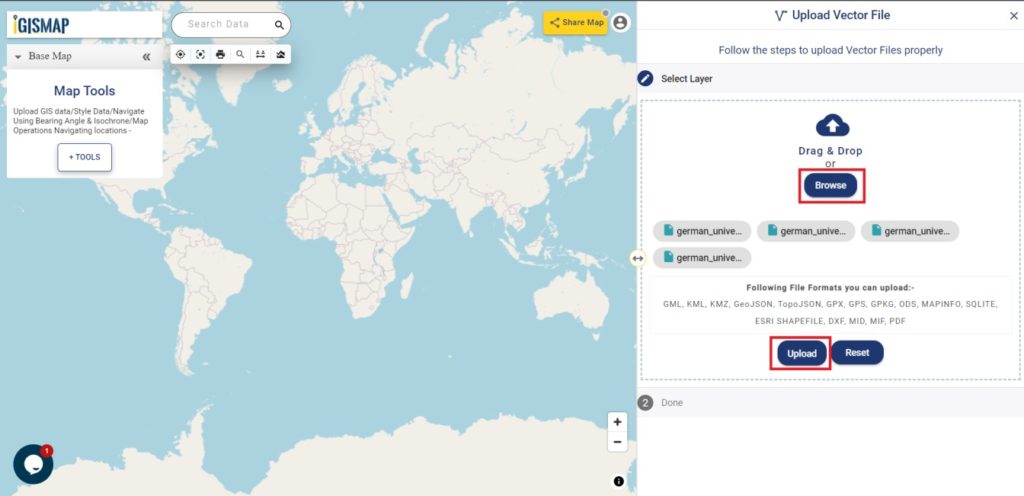
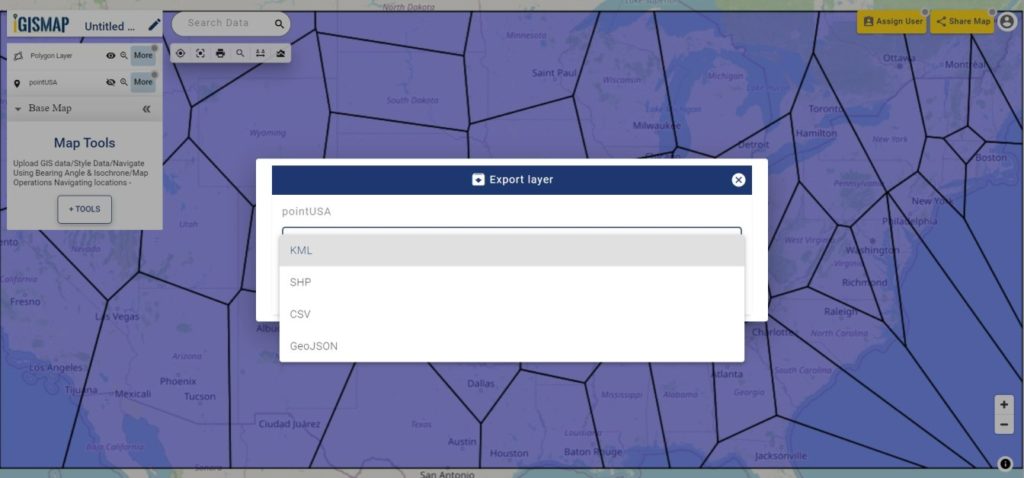
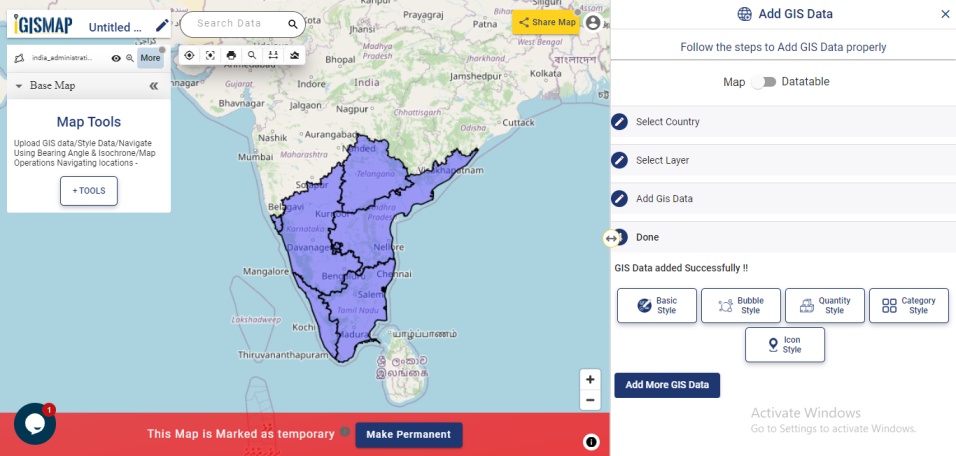
Now to add the data that you have selected or Crop. Click on Download button and select the Format in which you want data.
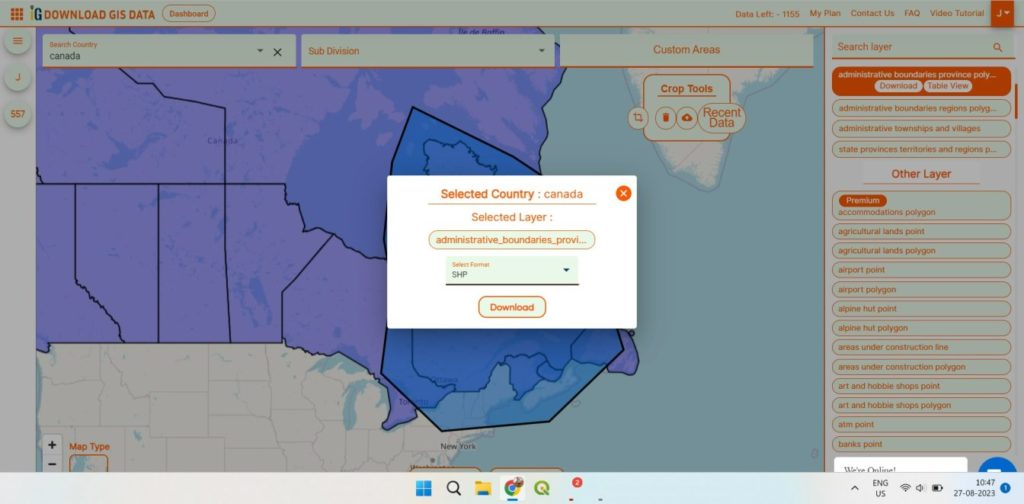
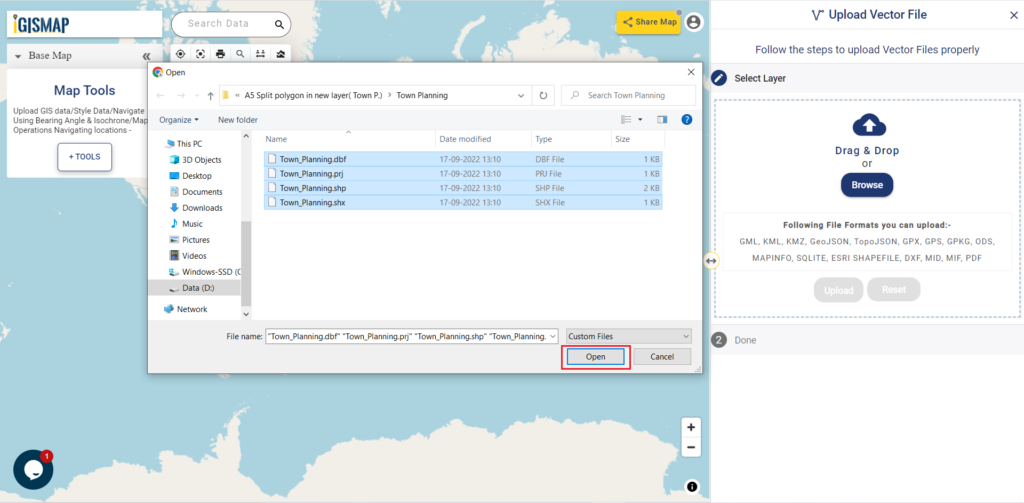
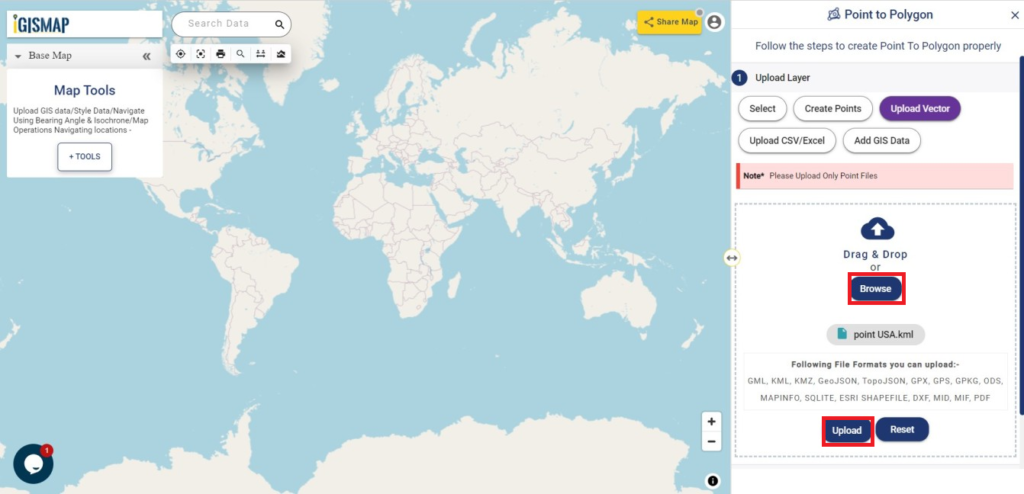
To Add Downloaded Crop Data Go to to Add Vector File and Drag the data which you have downloaded.
Add Polyline Data
Now let’s try to add a polyline GIS data from Add GIS Data tool
Select Country
Click on Select country, and then select the country of your choice, which is Canada itself.
Select Layer
For demonstrating the adding of polyline GIS data, let’s work with rivers line polyline data of Canada. Search for river to filter the list and select river line data to preview. Then click Add Layer icon to start the process of downloading.
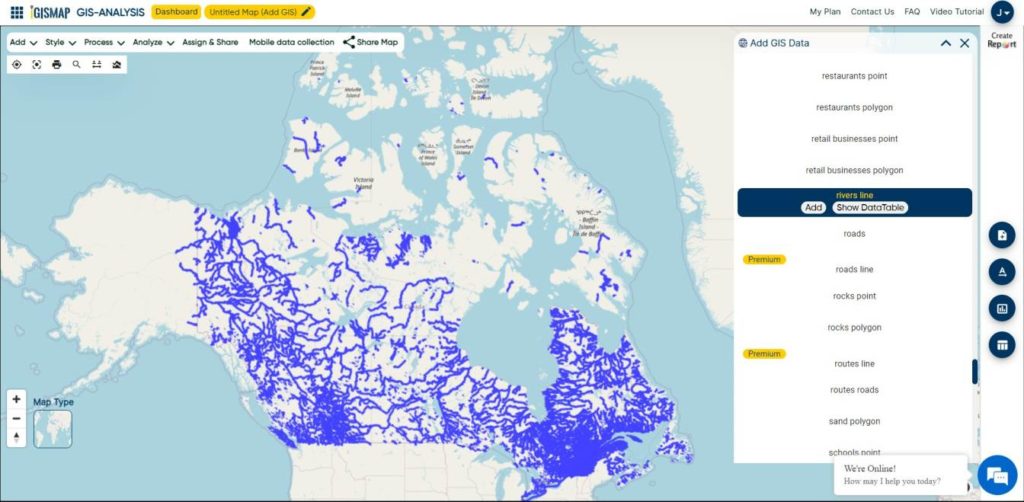
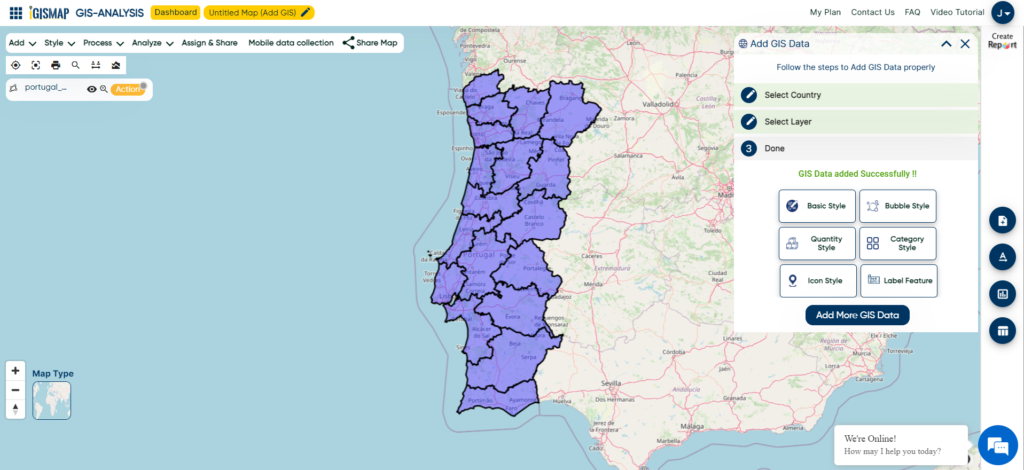
After previewing and confirming to download, click Add Layer icon button to open Add GIS Data step.
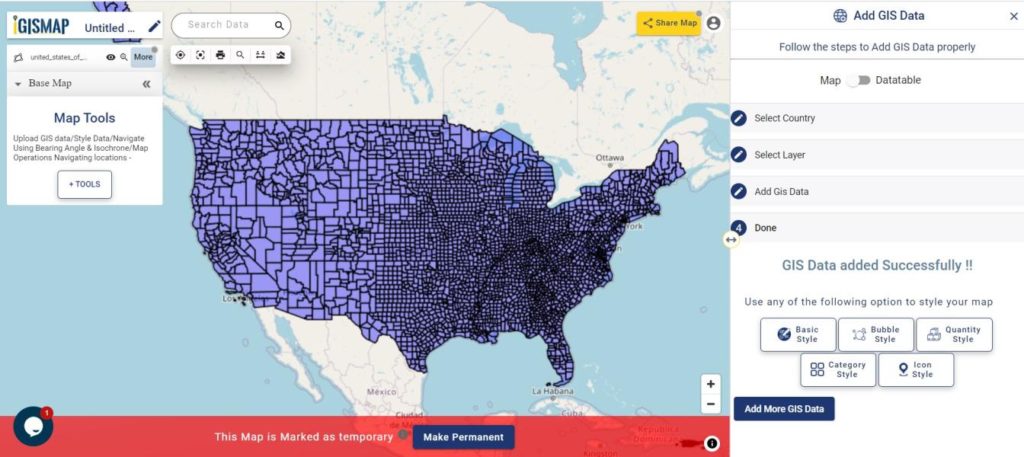
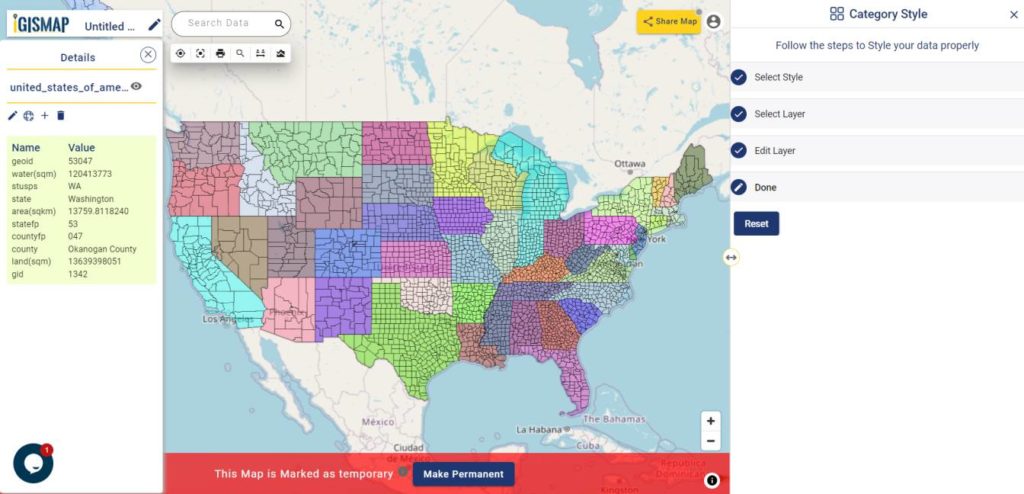
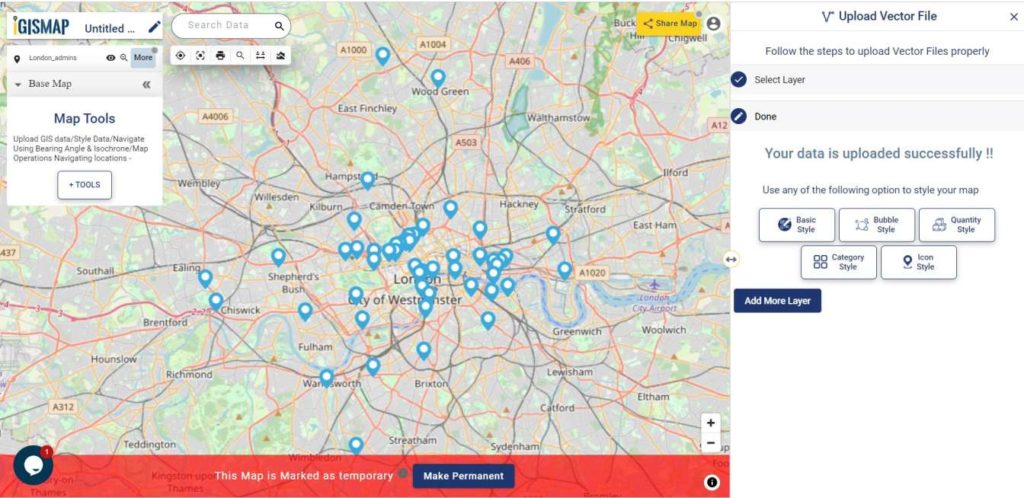
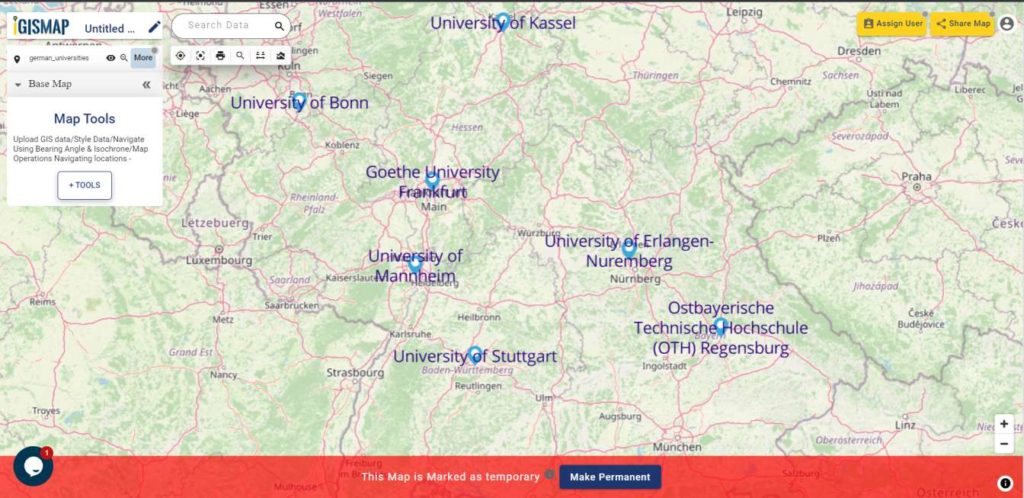
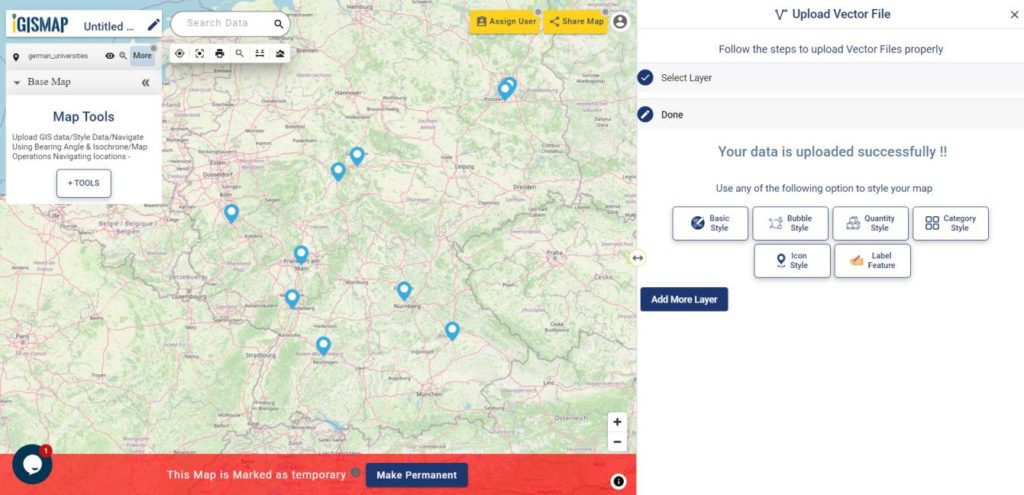
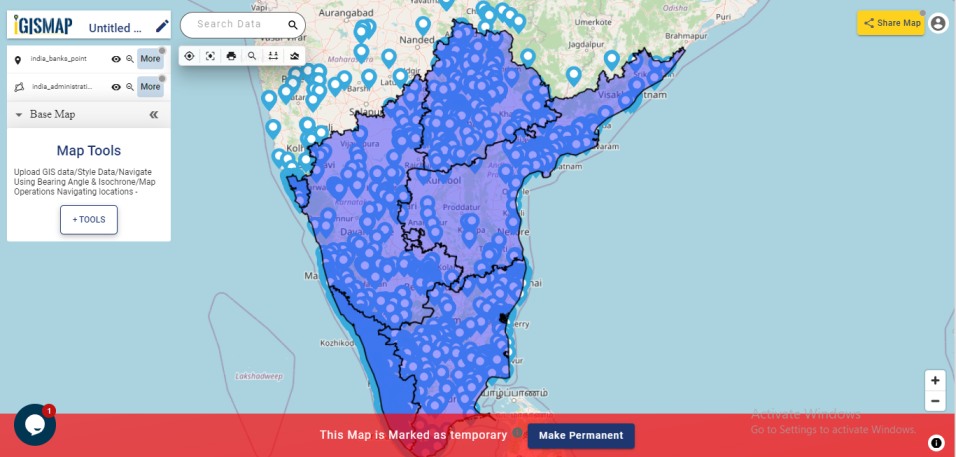
Now the data you have selected has added successfully in the map. You can use all IGISMap tools over the data for editing and analysis.
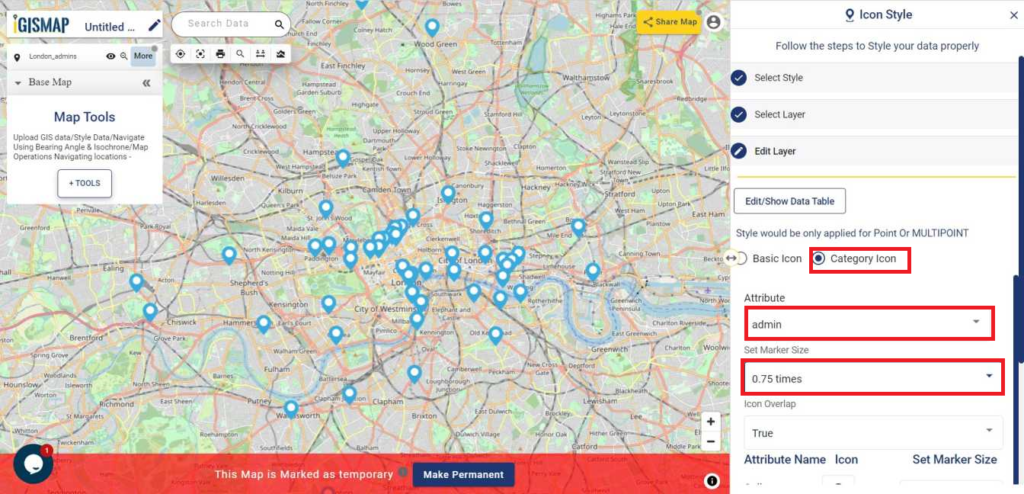
Add Point Data
For the last demonstration, we will add a point GIS data from MAPOG Add GIS Data tool.
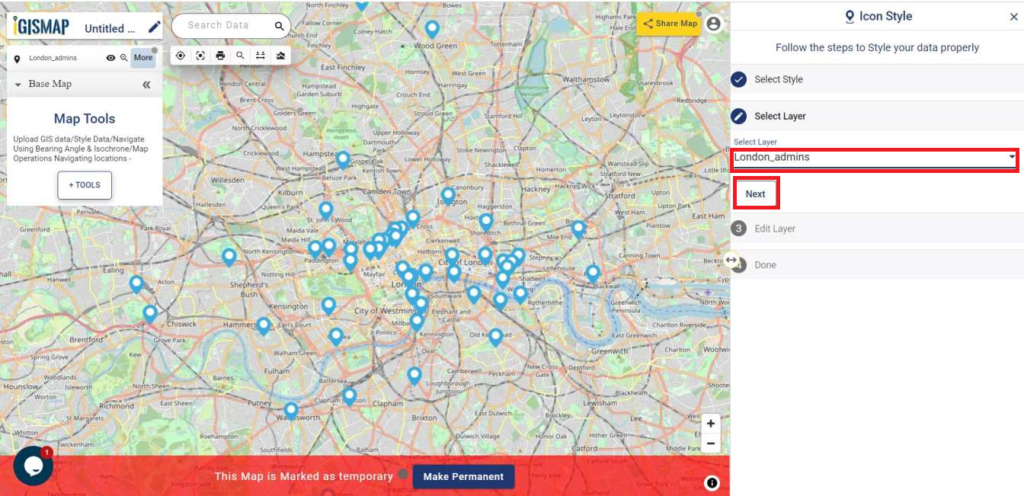
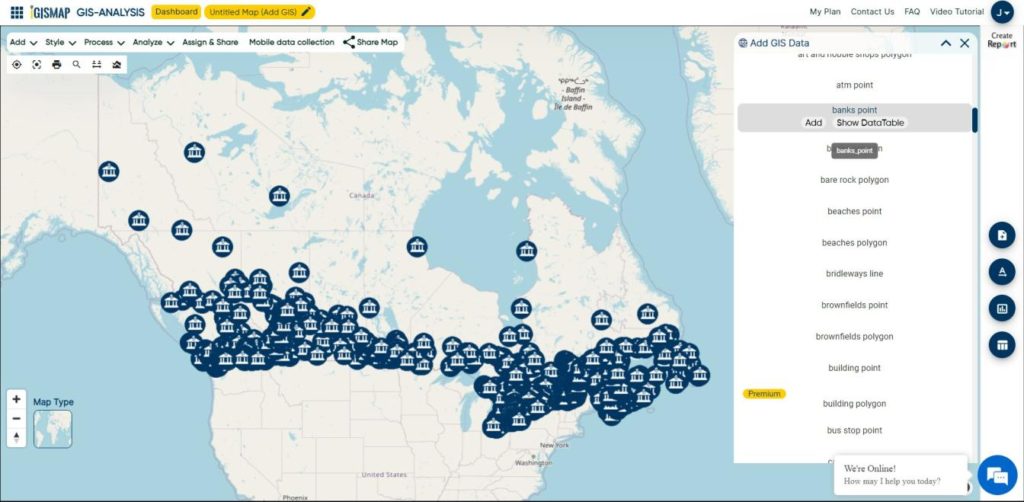
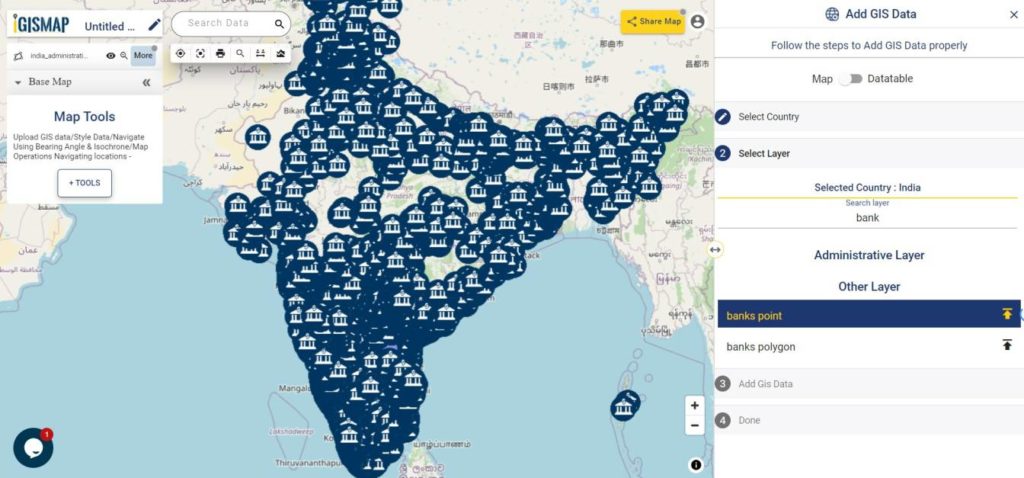
Select Layer
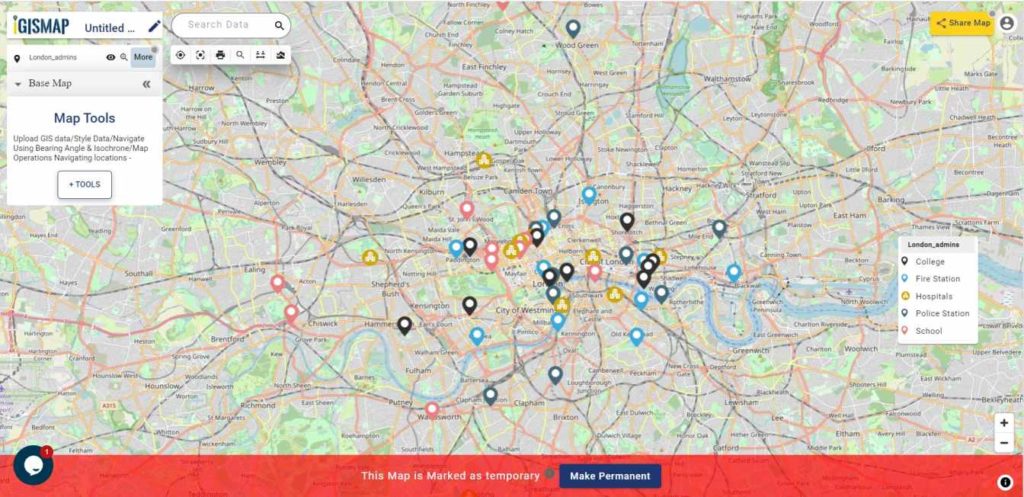
After selecting the country from Select Country, choose the required polyline GIS data. Here we are going to download Banks Point of Canada. Thus select Canada, then select banks point layer from Select Layer step.
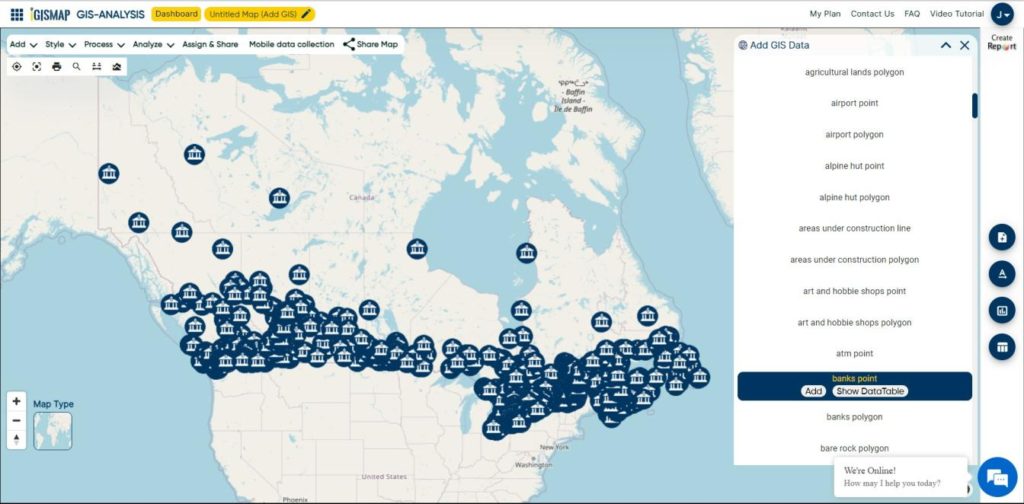
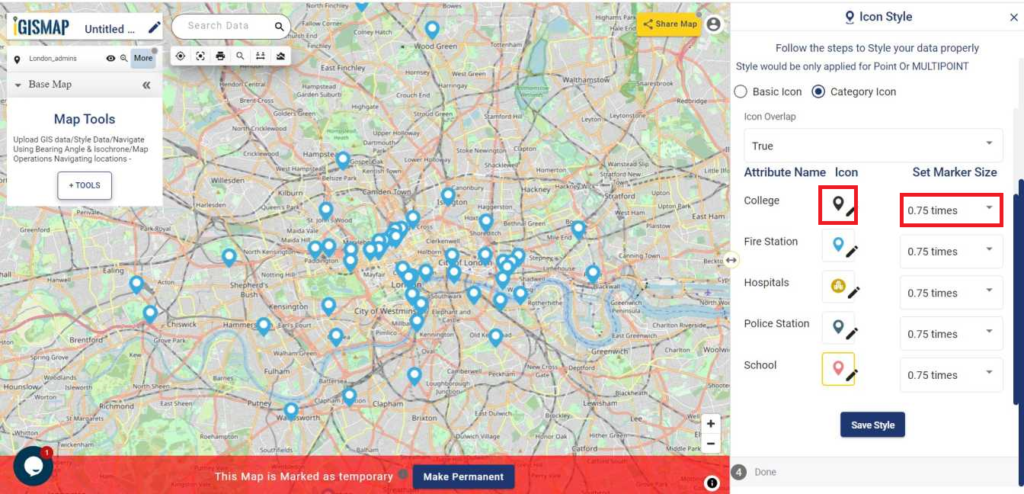
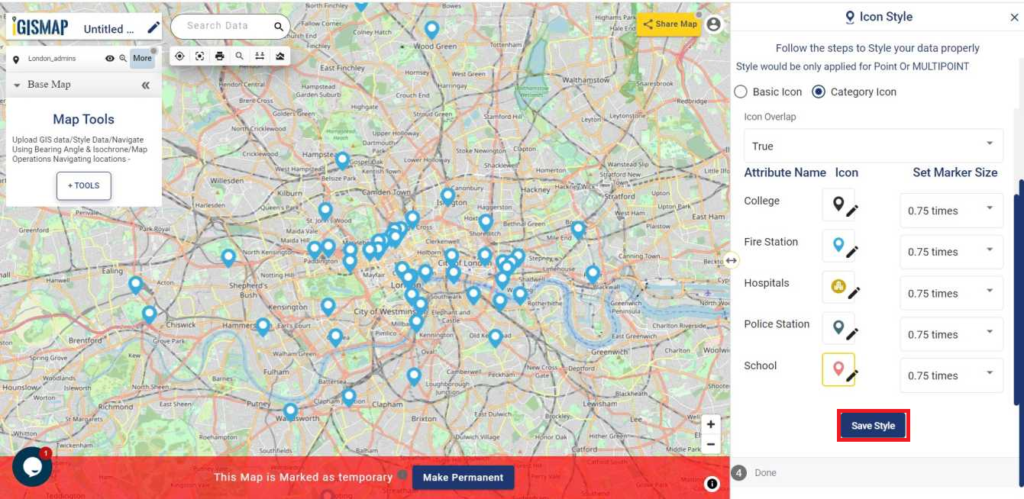
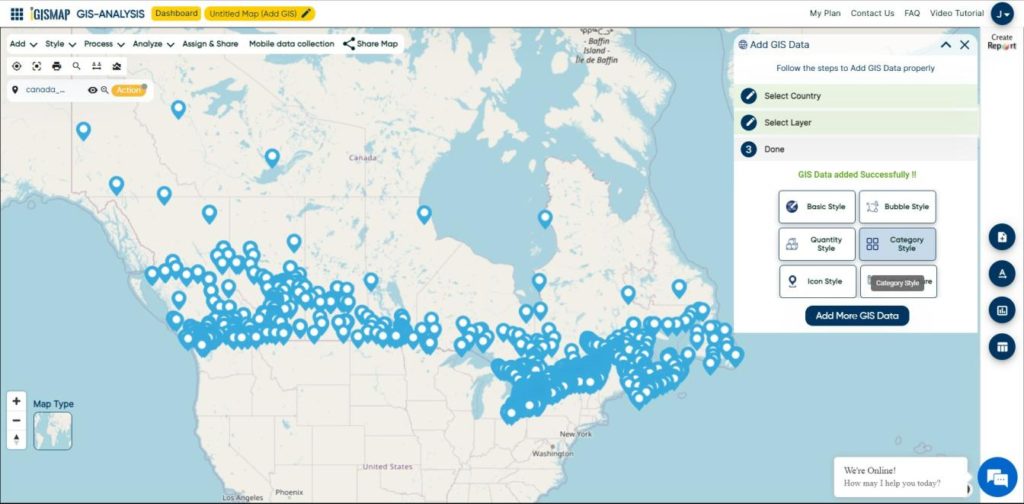
After confirming the data by previewing the data on map and checking the data table, click Add Layer button to start the process of adding in the map.
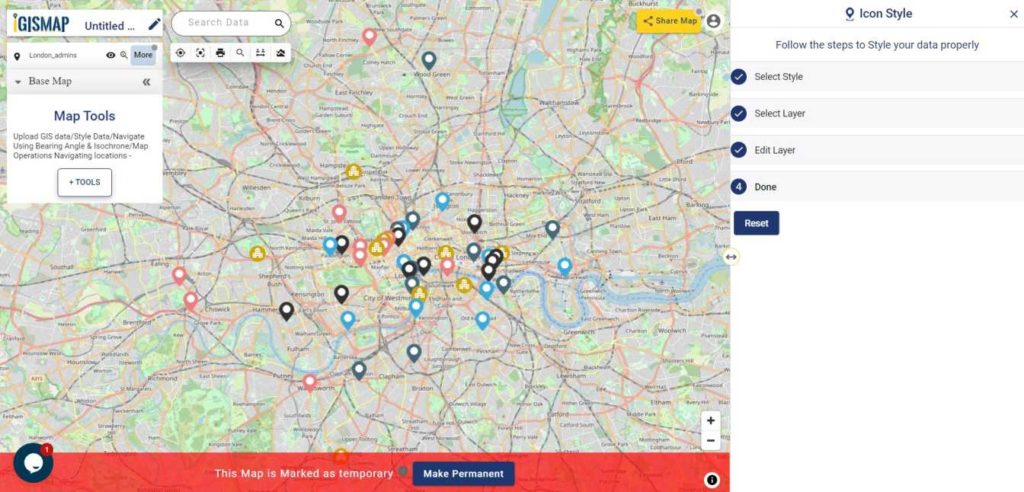
Now the data you have selected has added successfully in the map. You can use all IGISMap tools over the data for editing and analysis.
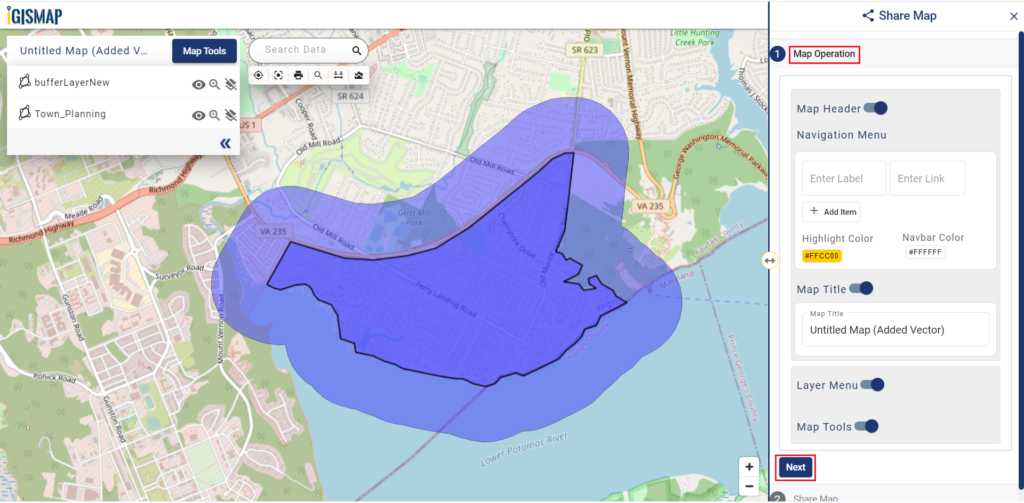
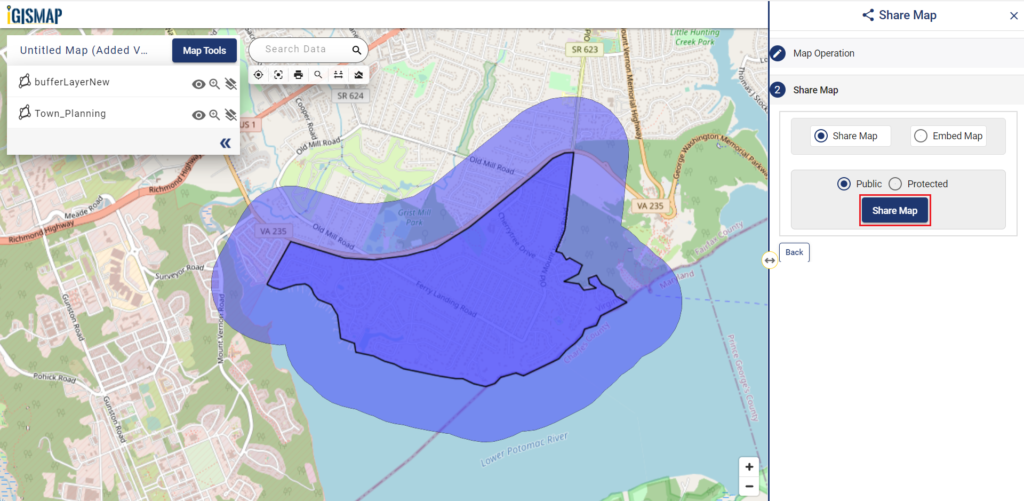
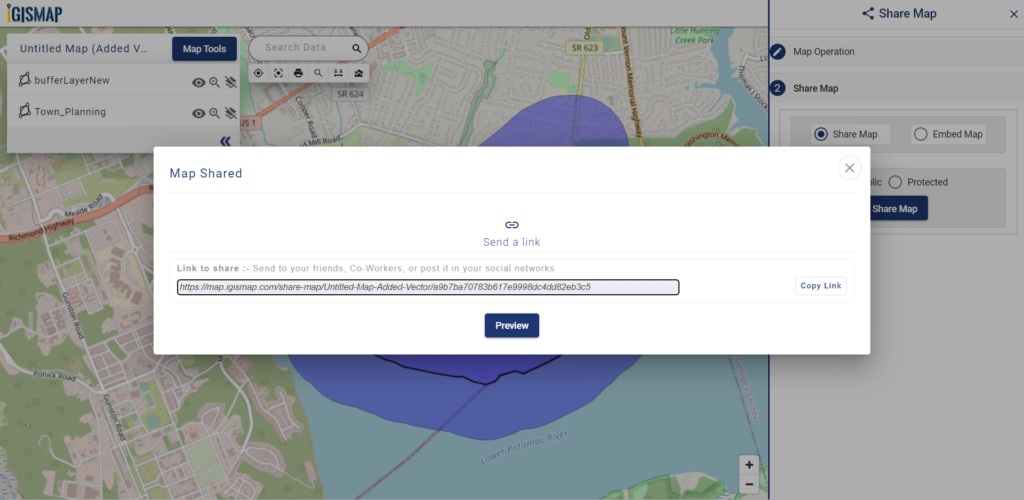
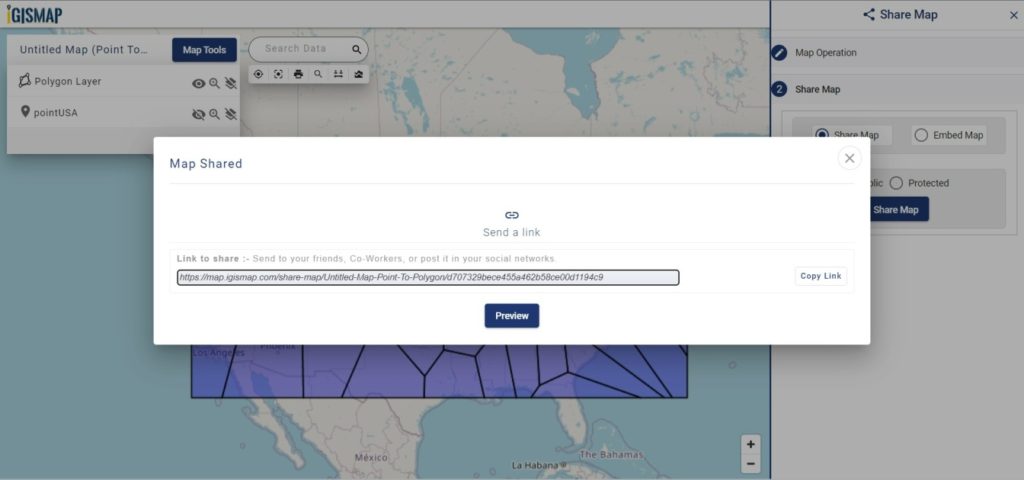
You can share your map with others in public or private mode. Article Share your Map will help you understand more about Share Map feature of IGISMap.
Check other articles:
- Map the locations of slums and embed the map on your website
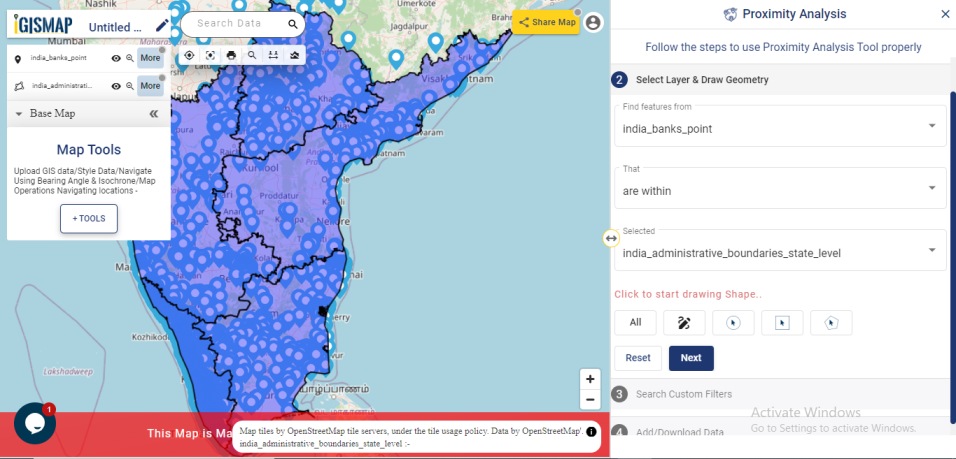
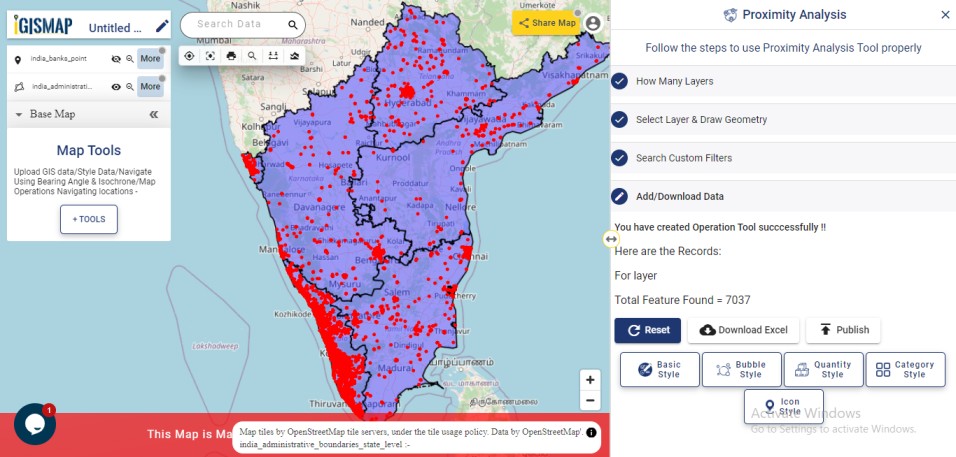
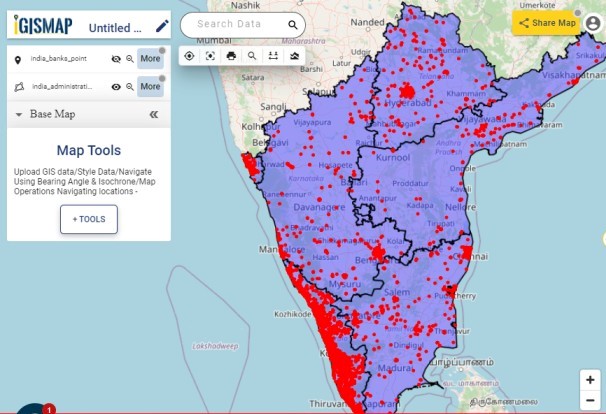
- Create a Map of the Bank Locations in South India
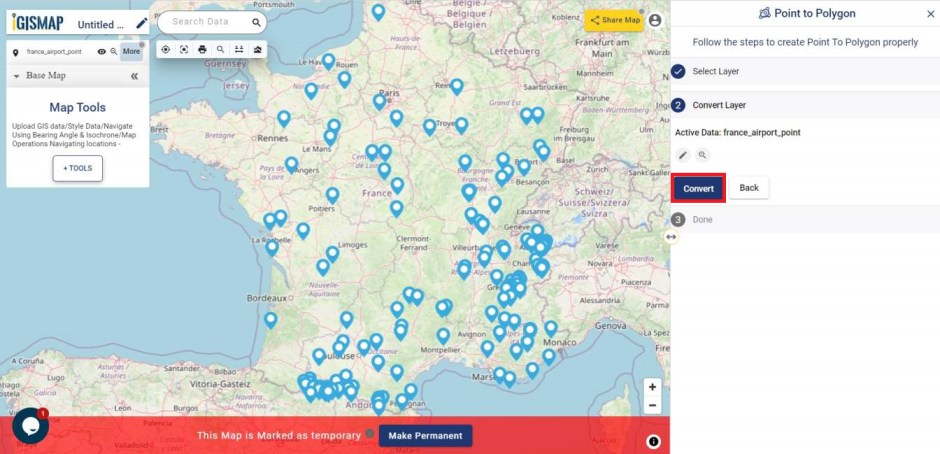
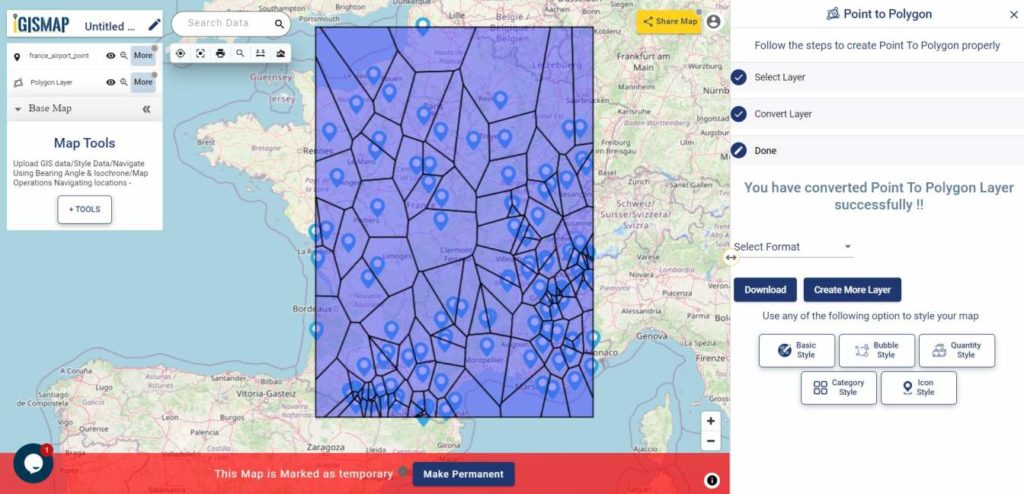
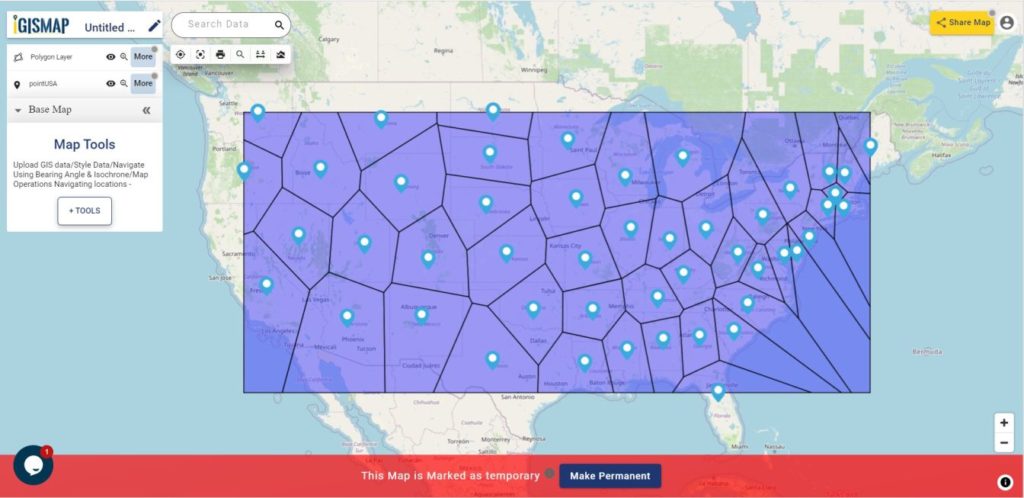
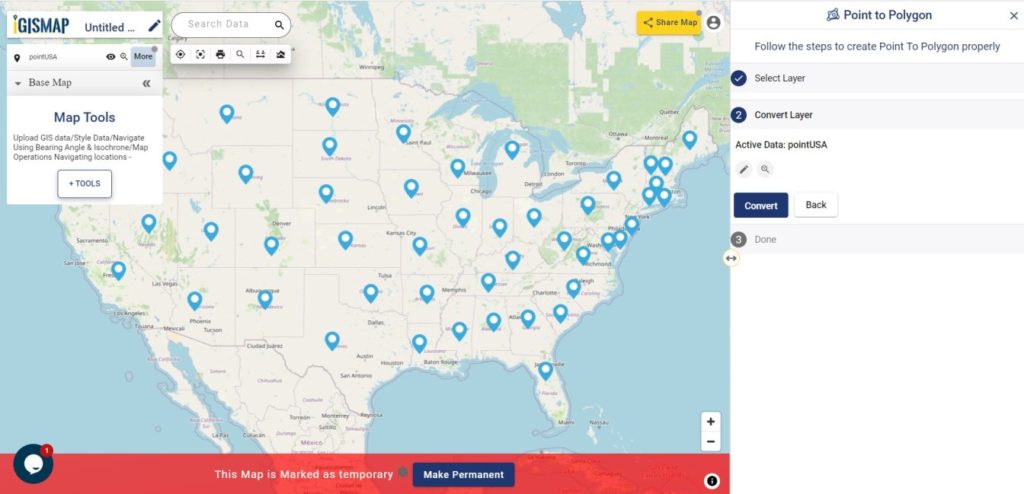
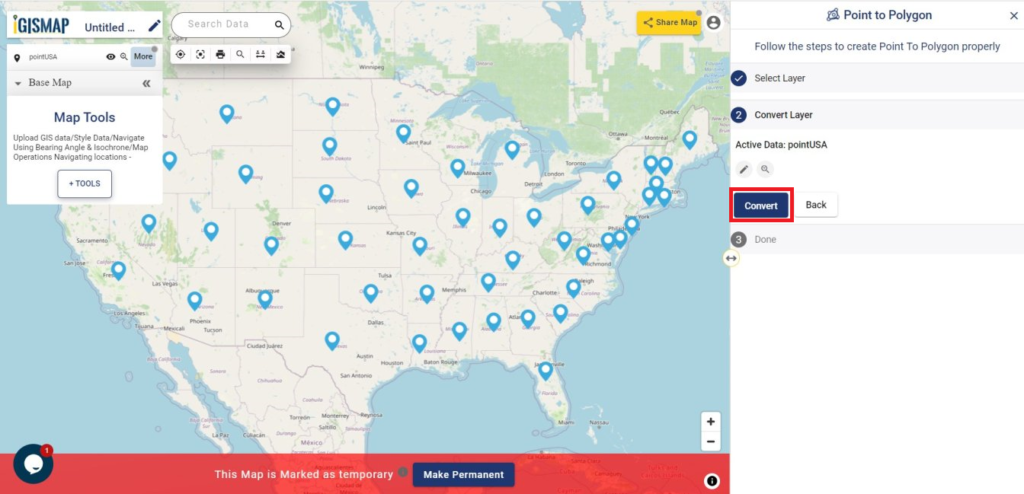
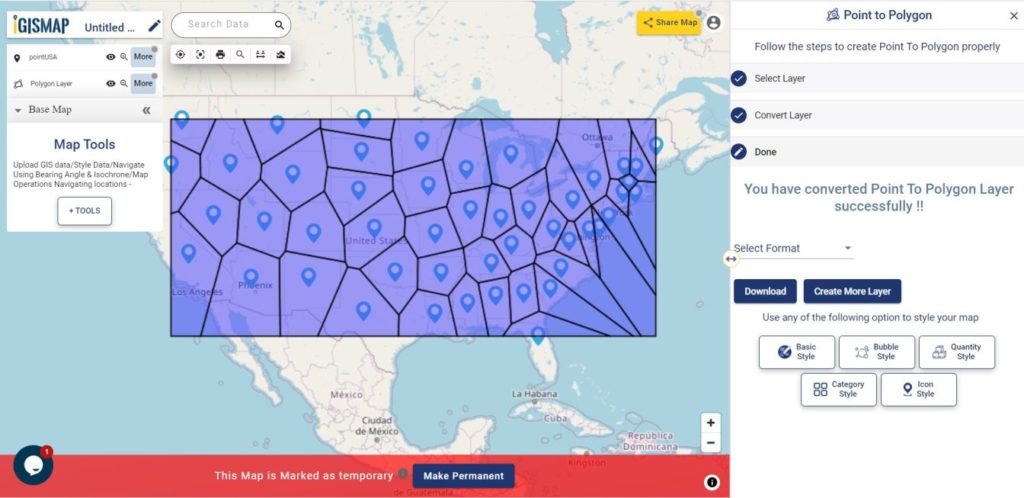
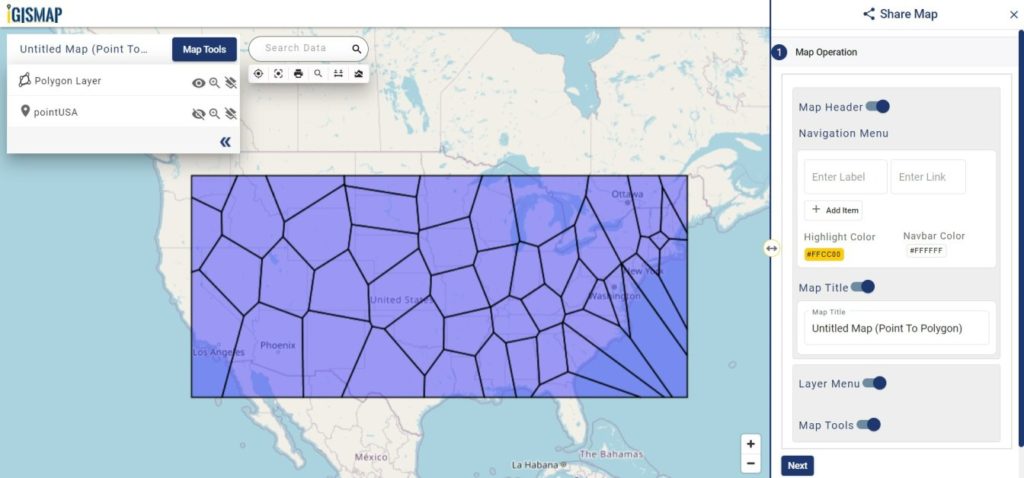
- Create point data and convert it into polygons
- Charts with Map – Create Bar Chart, Histogram, Number Chart, Table
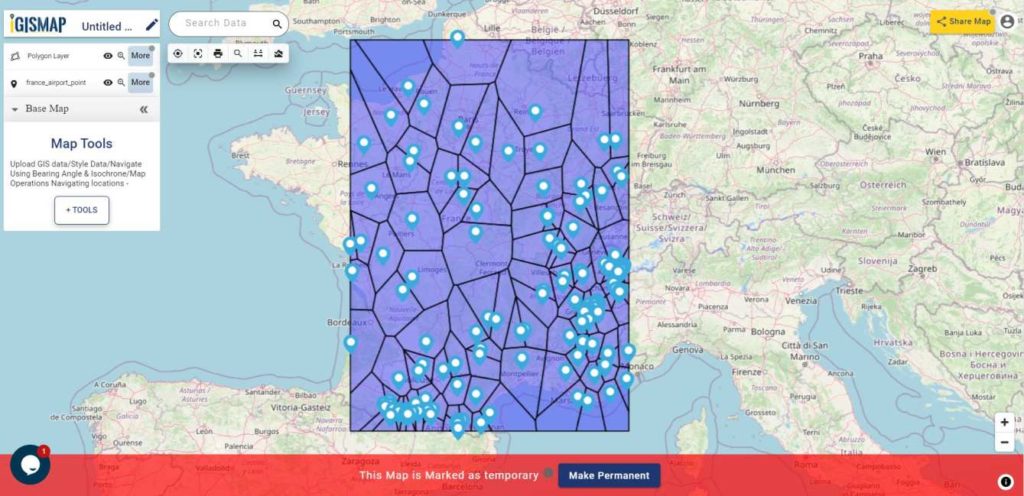
- Plot points from spreadsheet file and create voronoi polygons

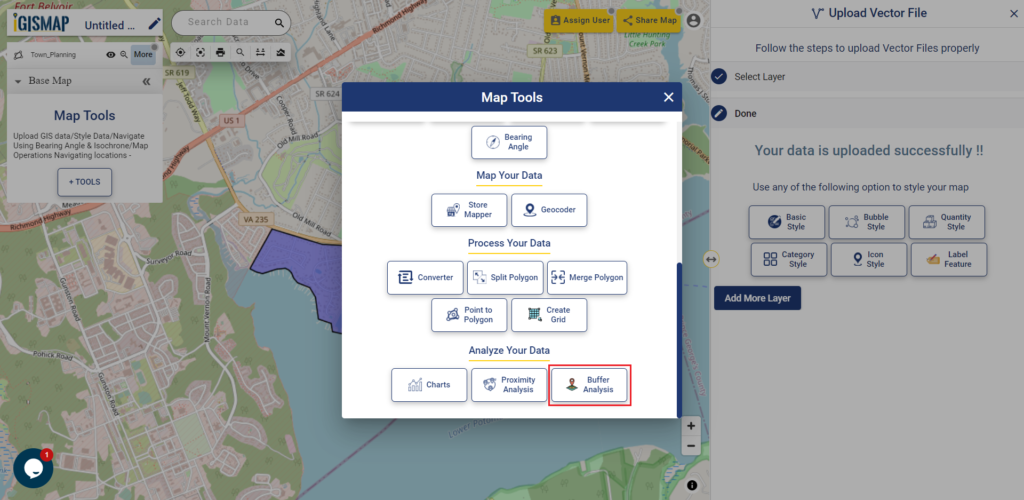

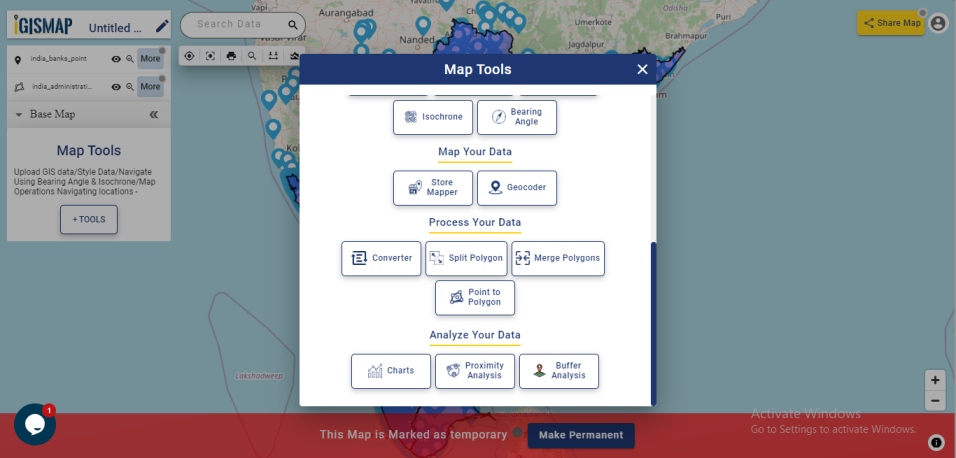
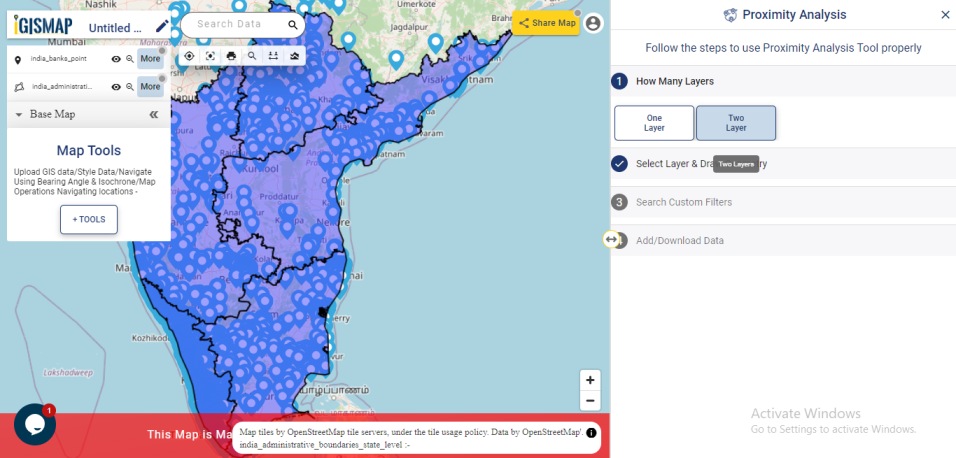
 from Map Tools to get the list of IGISMap tools from which you need to select Proximity Analysis tool.